Sample Space Tree Diagrams WORKSHEET
Sample Space Tree Diagrams WORKSHEET DESCRIPTION
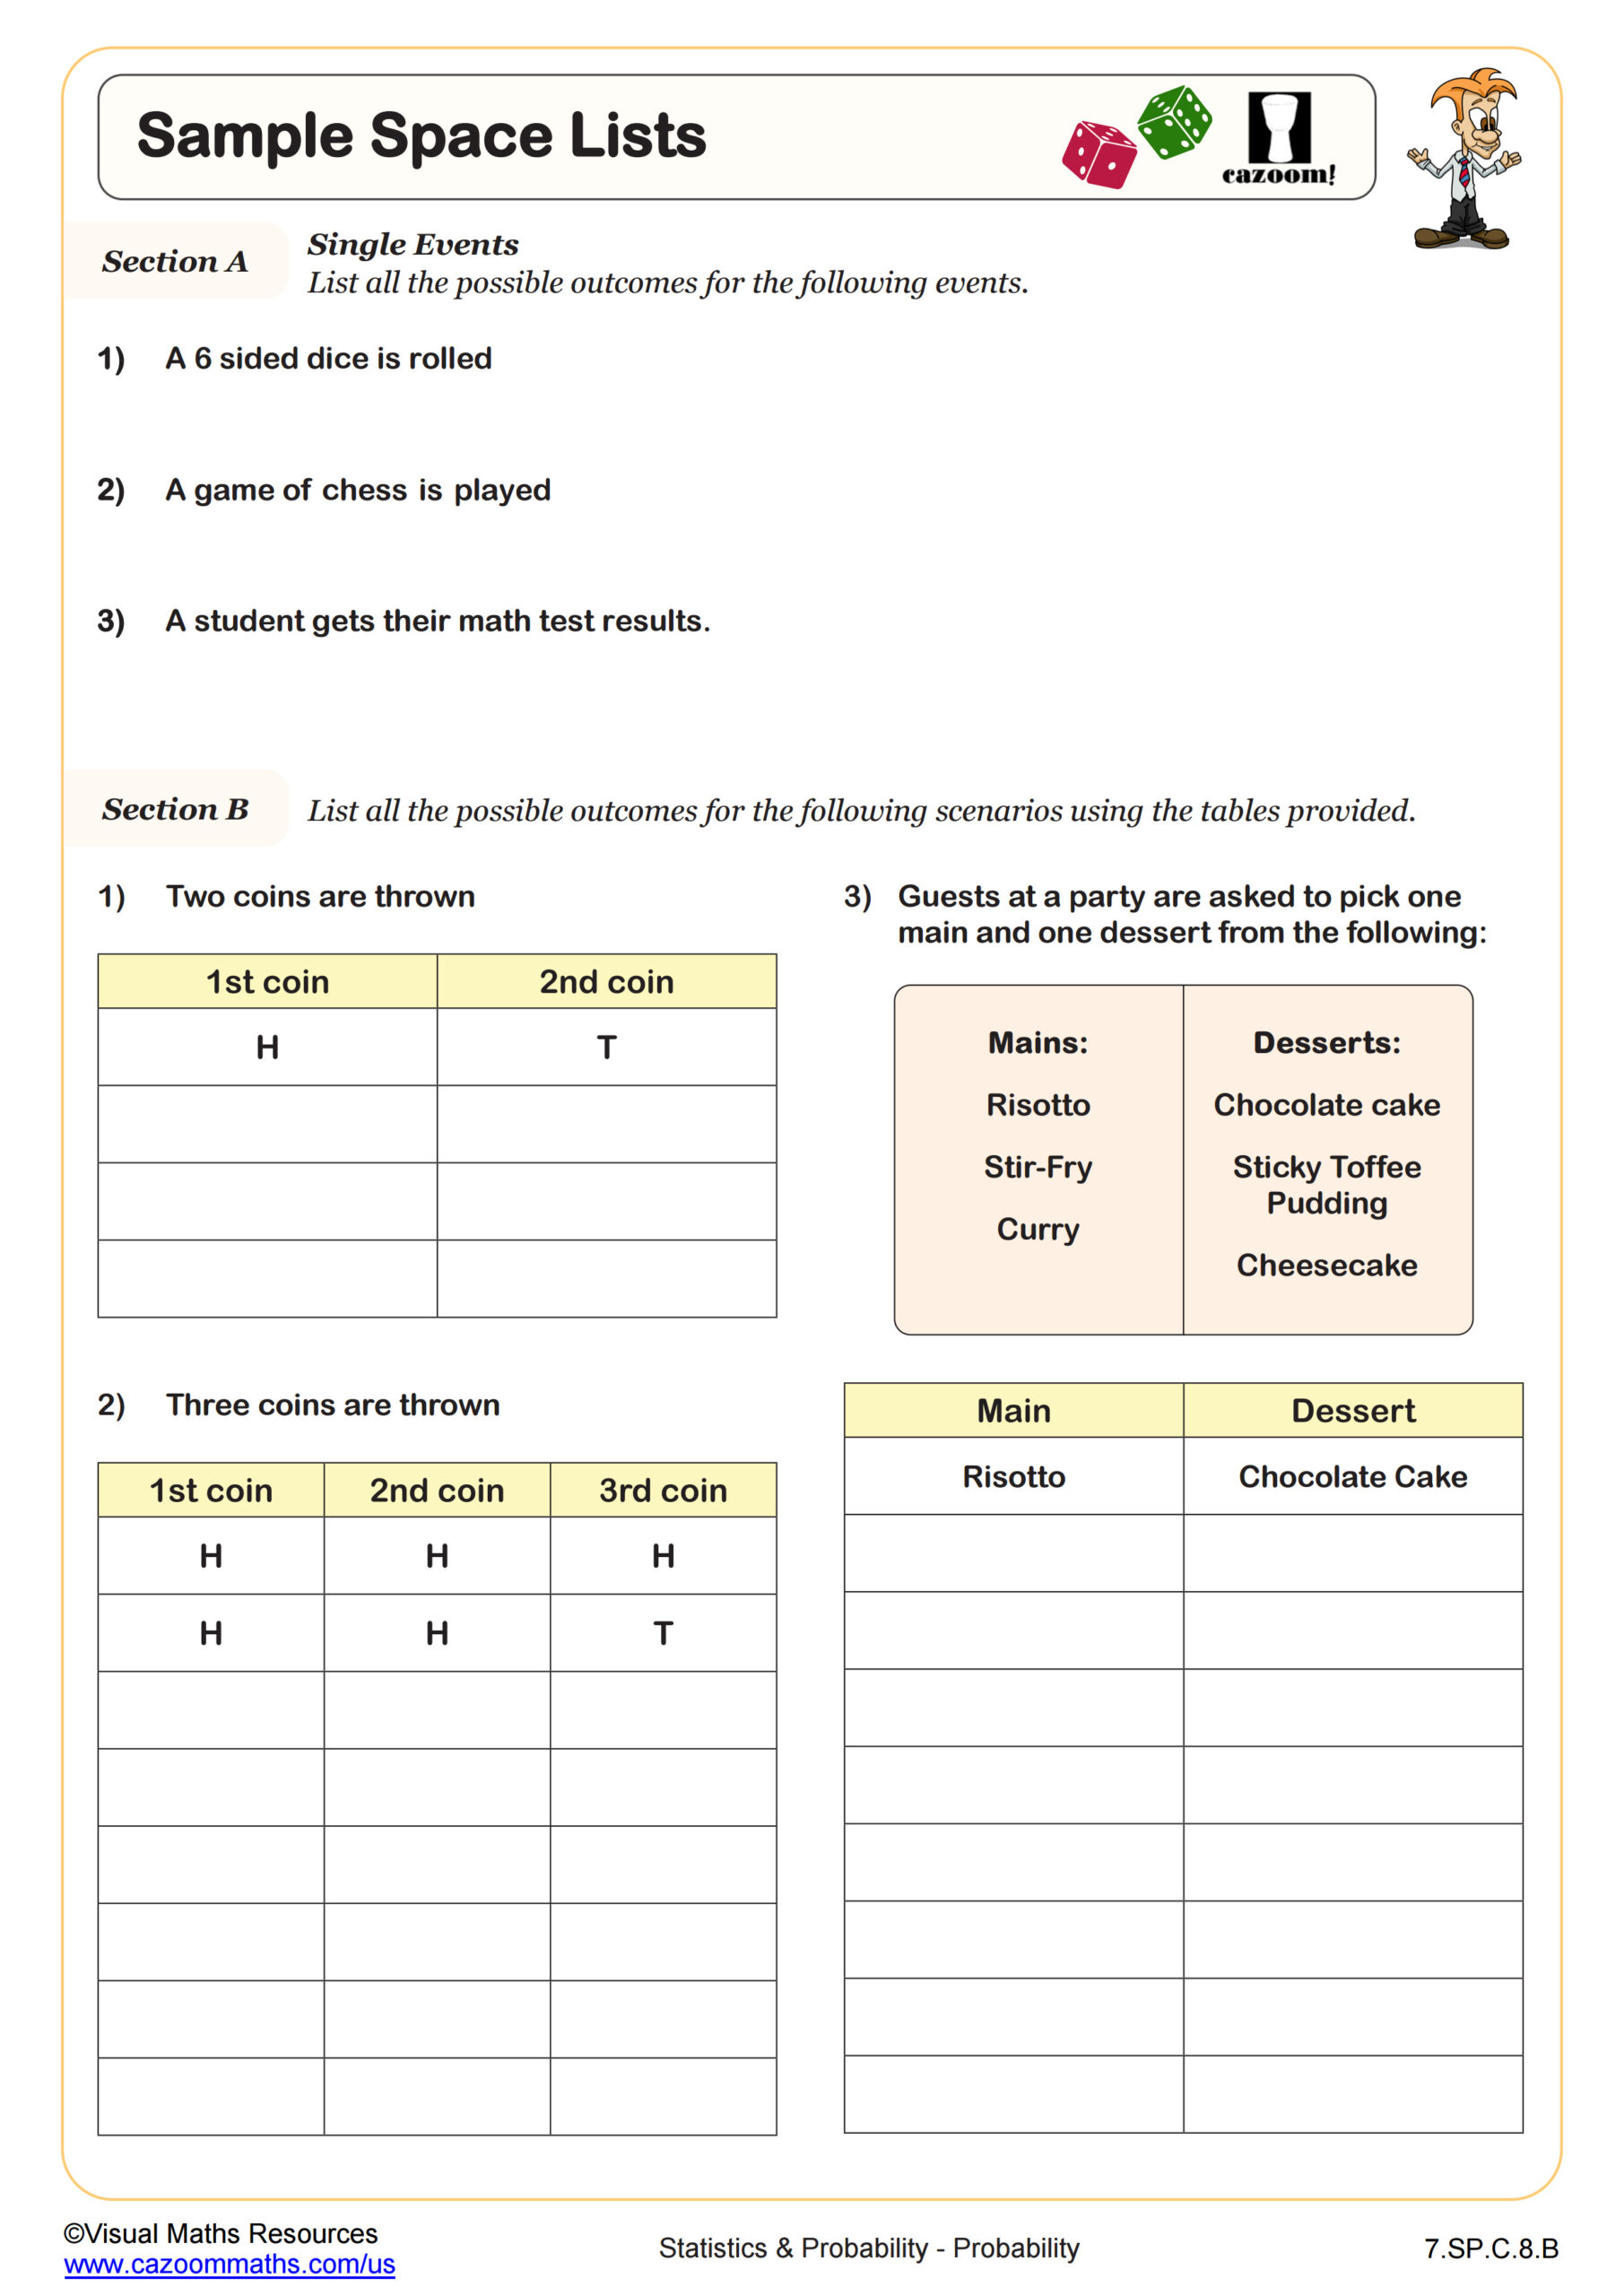
Students will complete sample space diagrams and use them to find probabilities throughout this worksheet.
Section A is based around throwing two dice and the scores being added, multiplied, or subtracted to complete three separate sample space diagrams, all of which are pre drawn for your students. Once the sample space diagrams are complete, students are asked questions regarding the number of outcomes and to find various probabilities.
Section B sees students construct their own sample space diagrams to represent all possible outcomes of multiple events. Events this time include tossing a coin, spinning a spinner, and balls inside two bags.
All worksheets are created by the team of experienced teachers at Cazoom Math.

RELATED TO Sample Space Tree Diagrams WORKSHEET
.jpg?w=3840)
Frequently Asked Questions
This sample space tree diagrams worksheet is designed for students in 7th Grade and aligns with Common Core State Standards.