Scatter Plots: Line of Best Fit WORKSHEET
Know that straight lines are widely used to model relationships between two quantitative variables. For scatter plots that suggest a linear association, informally fit a straight line, and informally assess the model fit by judging the closeness of the data points to the line.
Represent data on two quantitative variables on a scatter plot, and describe how the variables are related. a. Fit a function to the data; use functions fitted to data to solve problems in the context of the data. Use given functions or choose a function suggested by the context. Emphasize linear, quadratic, and exponential models. b. Informally assess the fit of a function by plotting and analyzing residuals. c. Fit a linear function for a scatter plot that suggests a linear association.
Scatter Plots: Line of Best Fit WORKSHEET DESCRIPTION
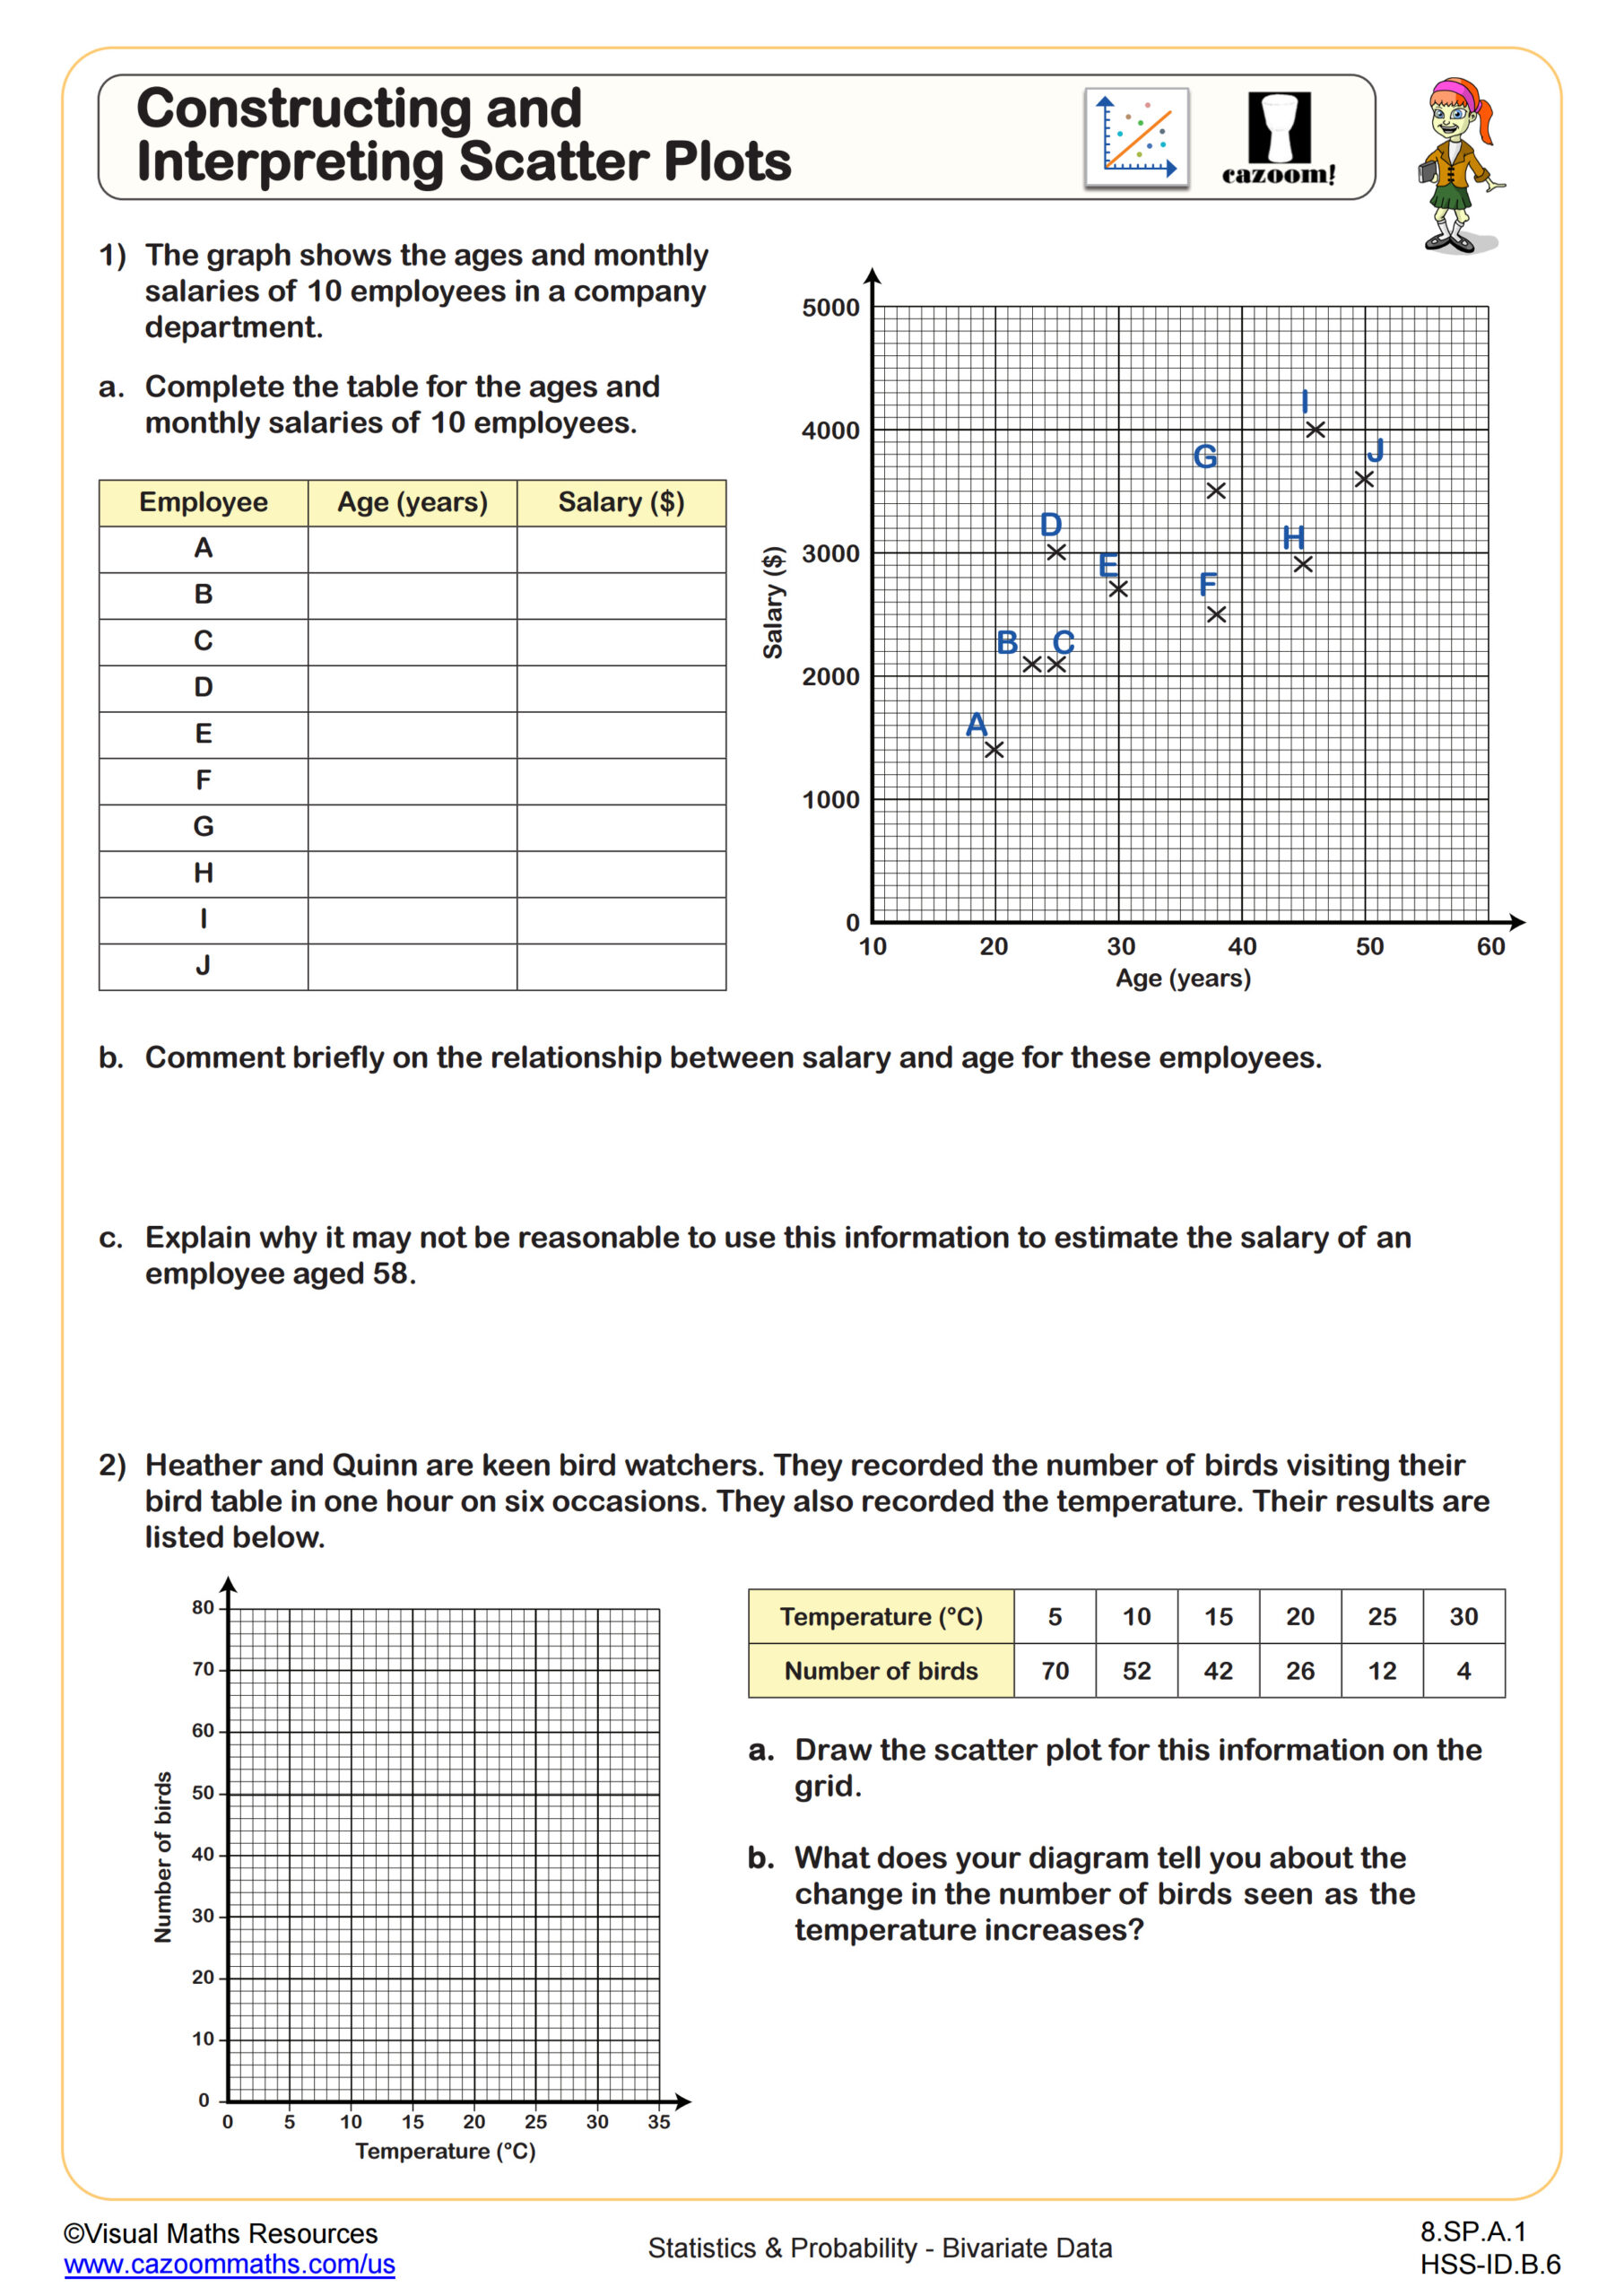
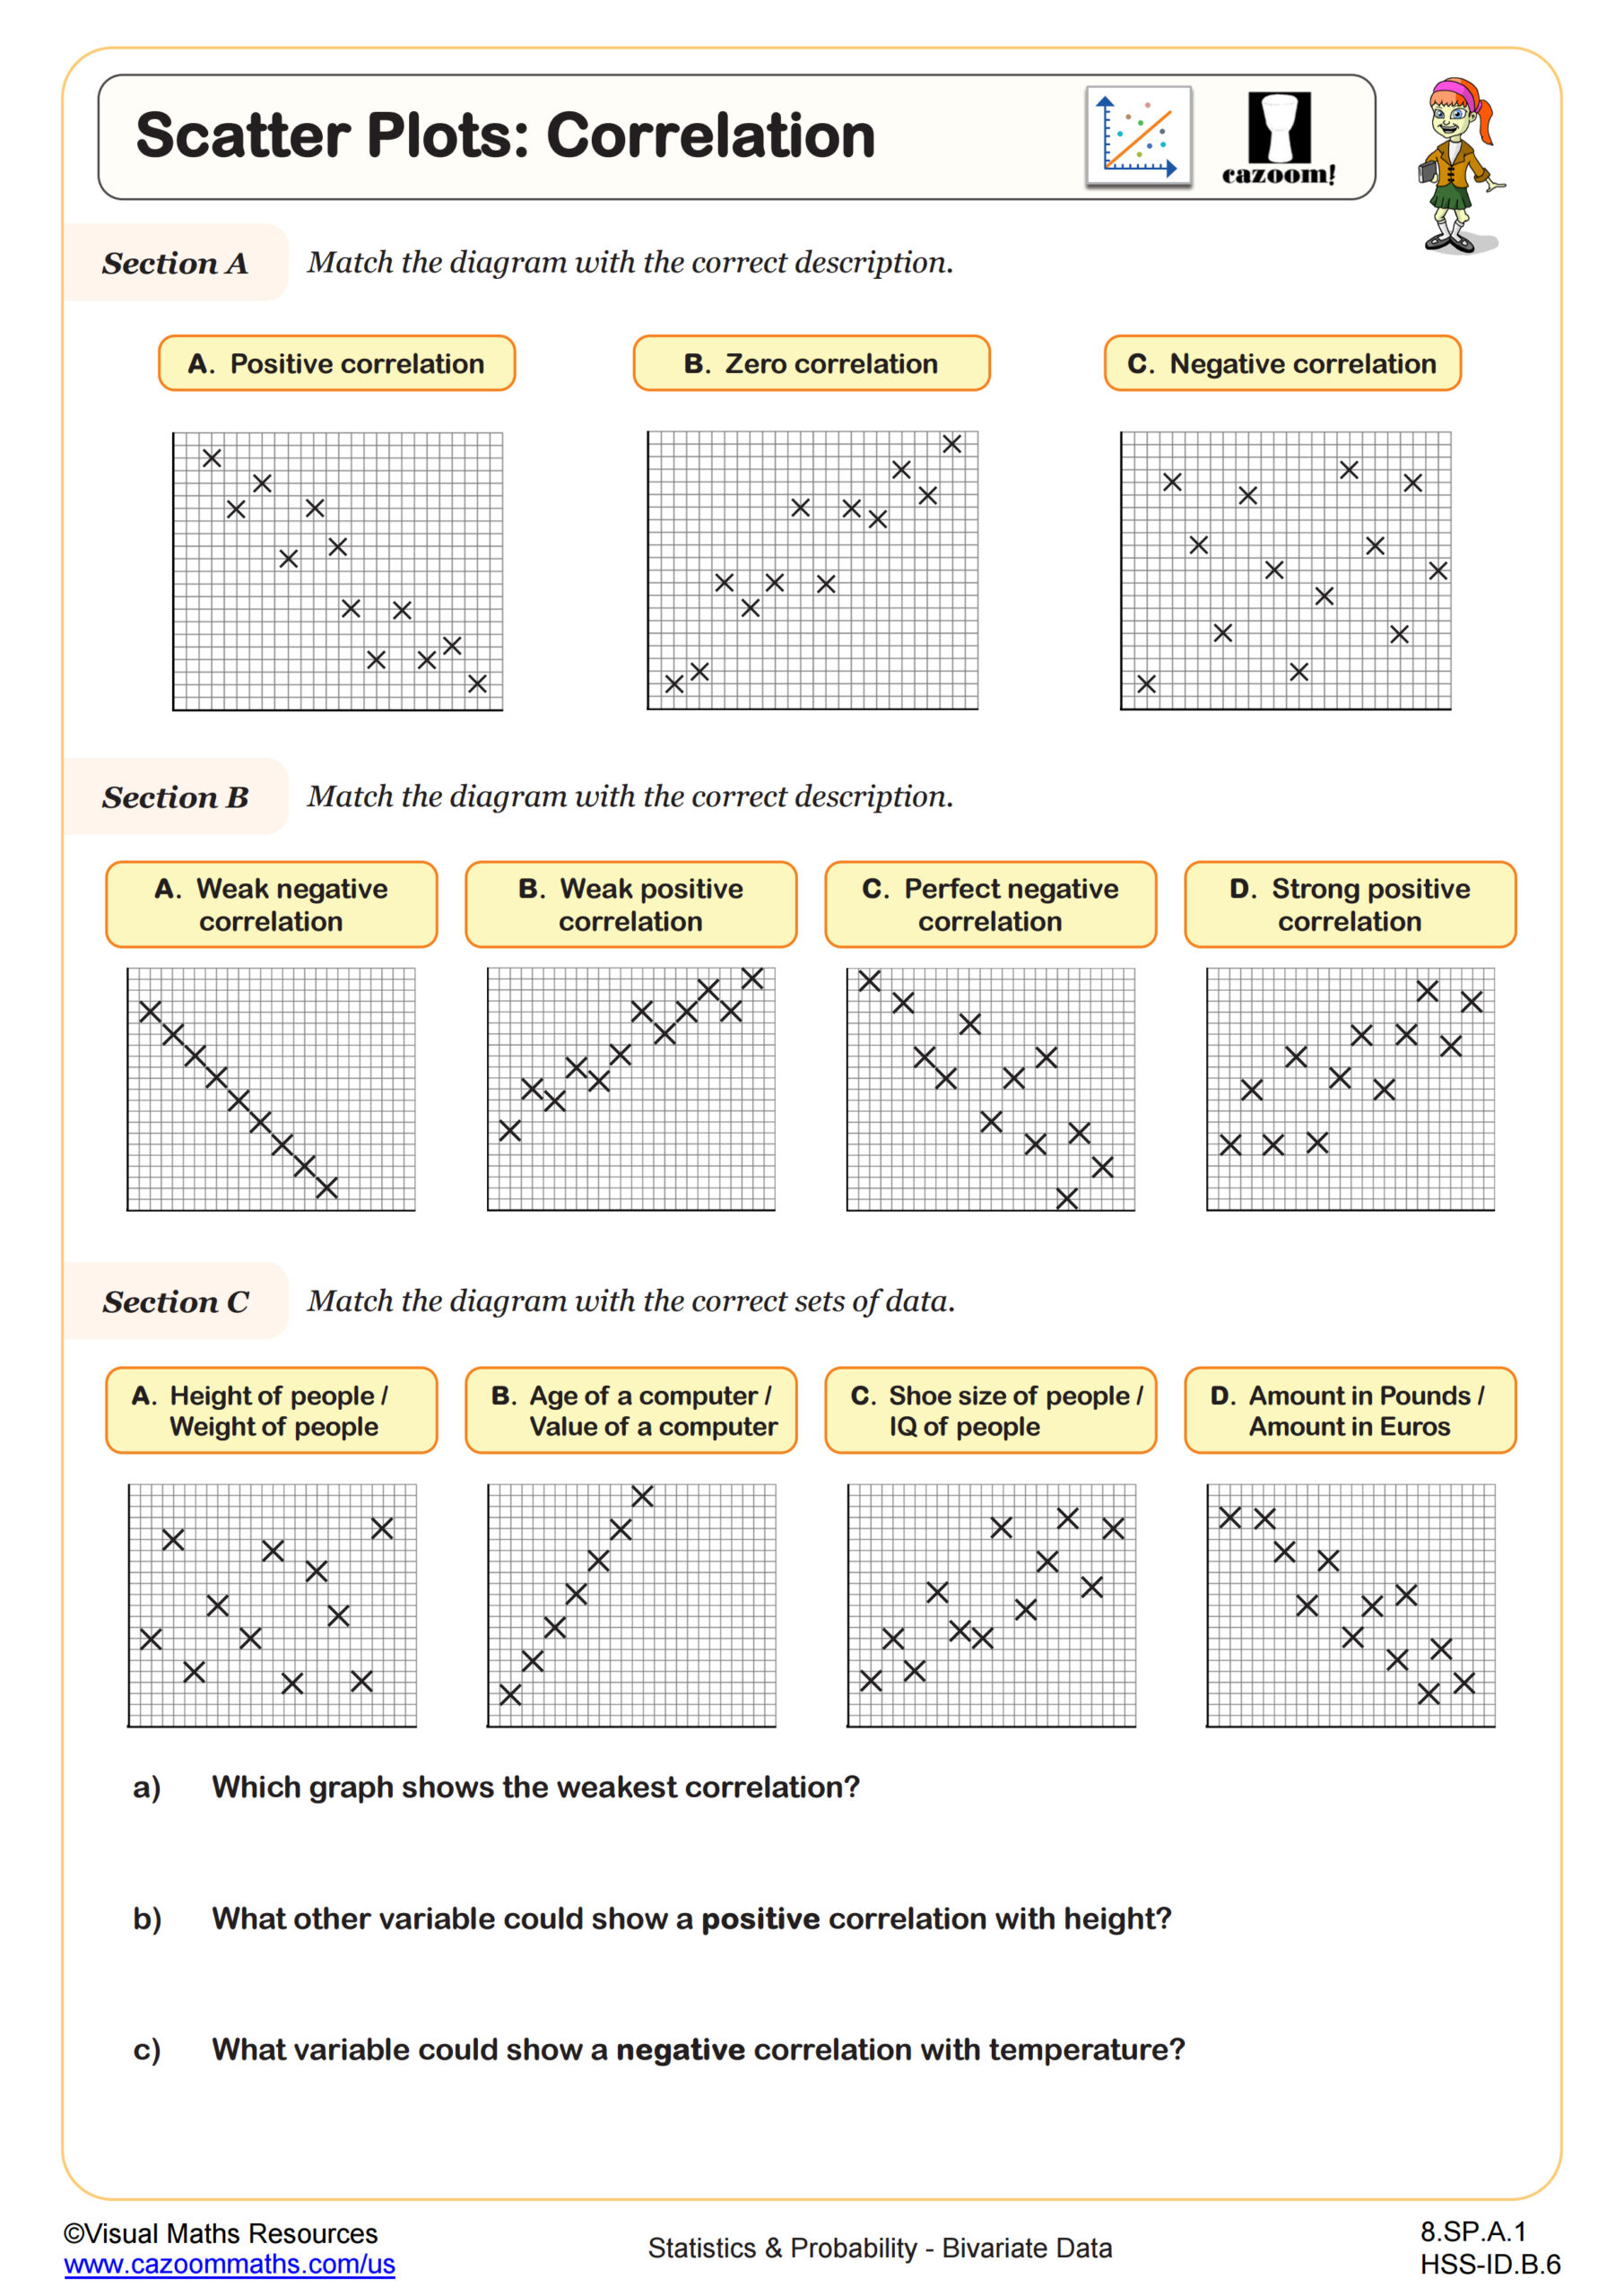
Use this worksheet alongside Constructing and Interpreting Scatter Plots and Scatter Plots: Correlation. This worksheet provides an opportunity for learners to practice the skill of drawing and reading from a line of best fit. Section A gives four scatter plots to describe the correlation. Section B then requires learners to plot some bivariate data, describe the correlation, draw a line of best fit, and then use that line to estimate a value. Section C provides a completed scatter plot and asks for a description of the relationship, a line of best fit, and an estimation. There is also an extension task for learners to collect and plot their own data about arm span and hand span.
All worksheets are created by the team of experienced teachers at Cazoom Math.

RELATED TO Scatter Plots: Line of Best Fit WORKSHEET
Frequently Asked Questions
This scatter plots: line of best fit worksheet is designed for students in 8th Grade and Algebra I and aligns with Common Core State Standards.