Back to:
Solving Real-Life Problems using Graphs WORKSHEET
Suitable for Grades: Algebra I, IM 1
CCSS: HSF.IF.B.4
CCSS Description: For a function that models a relationship between two quantities, interpret key features of graphs and tables in terms of the quantities, and sketch graphs showing key features given a verbal description of the relationship. Key features include: intercepts; intervals where the function is increasing, decreasing, positive, or negative; relative maximums and minimums; symmetries; end behavior; and periodicity.
Solving Real-Life Problems using Graphs WORKSHEET DESCRIPTION
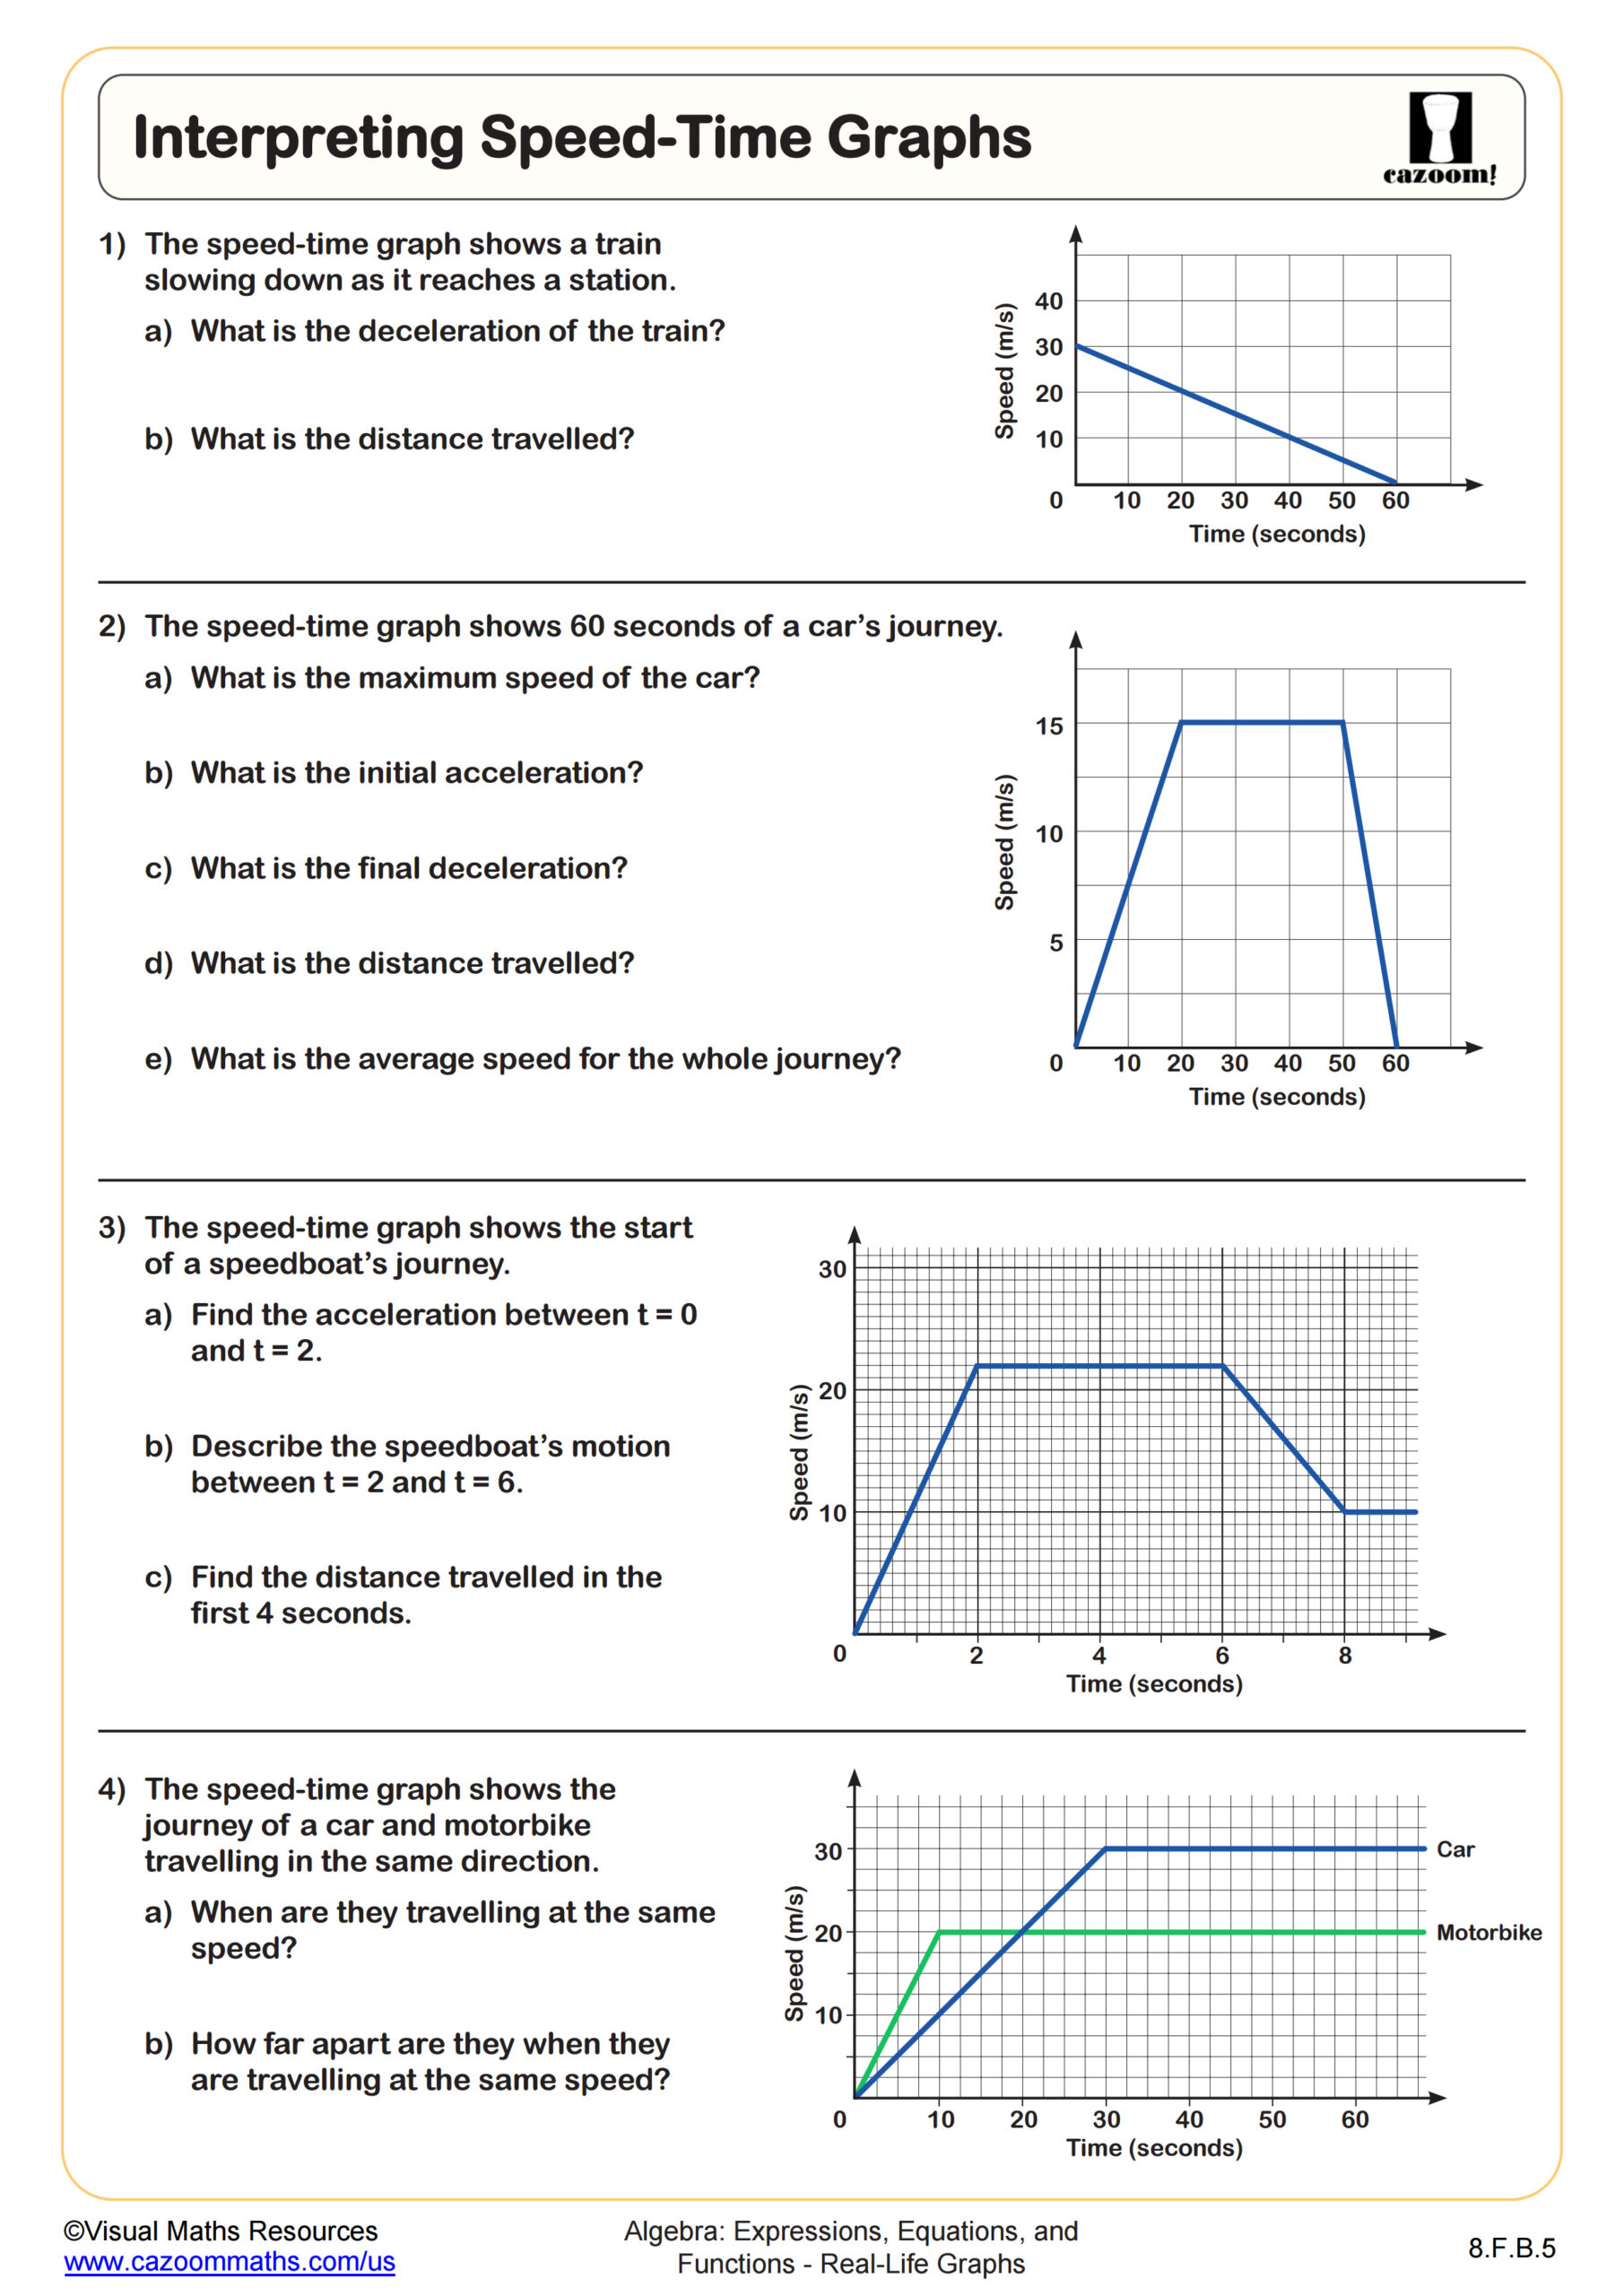
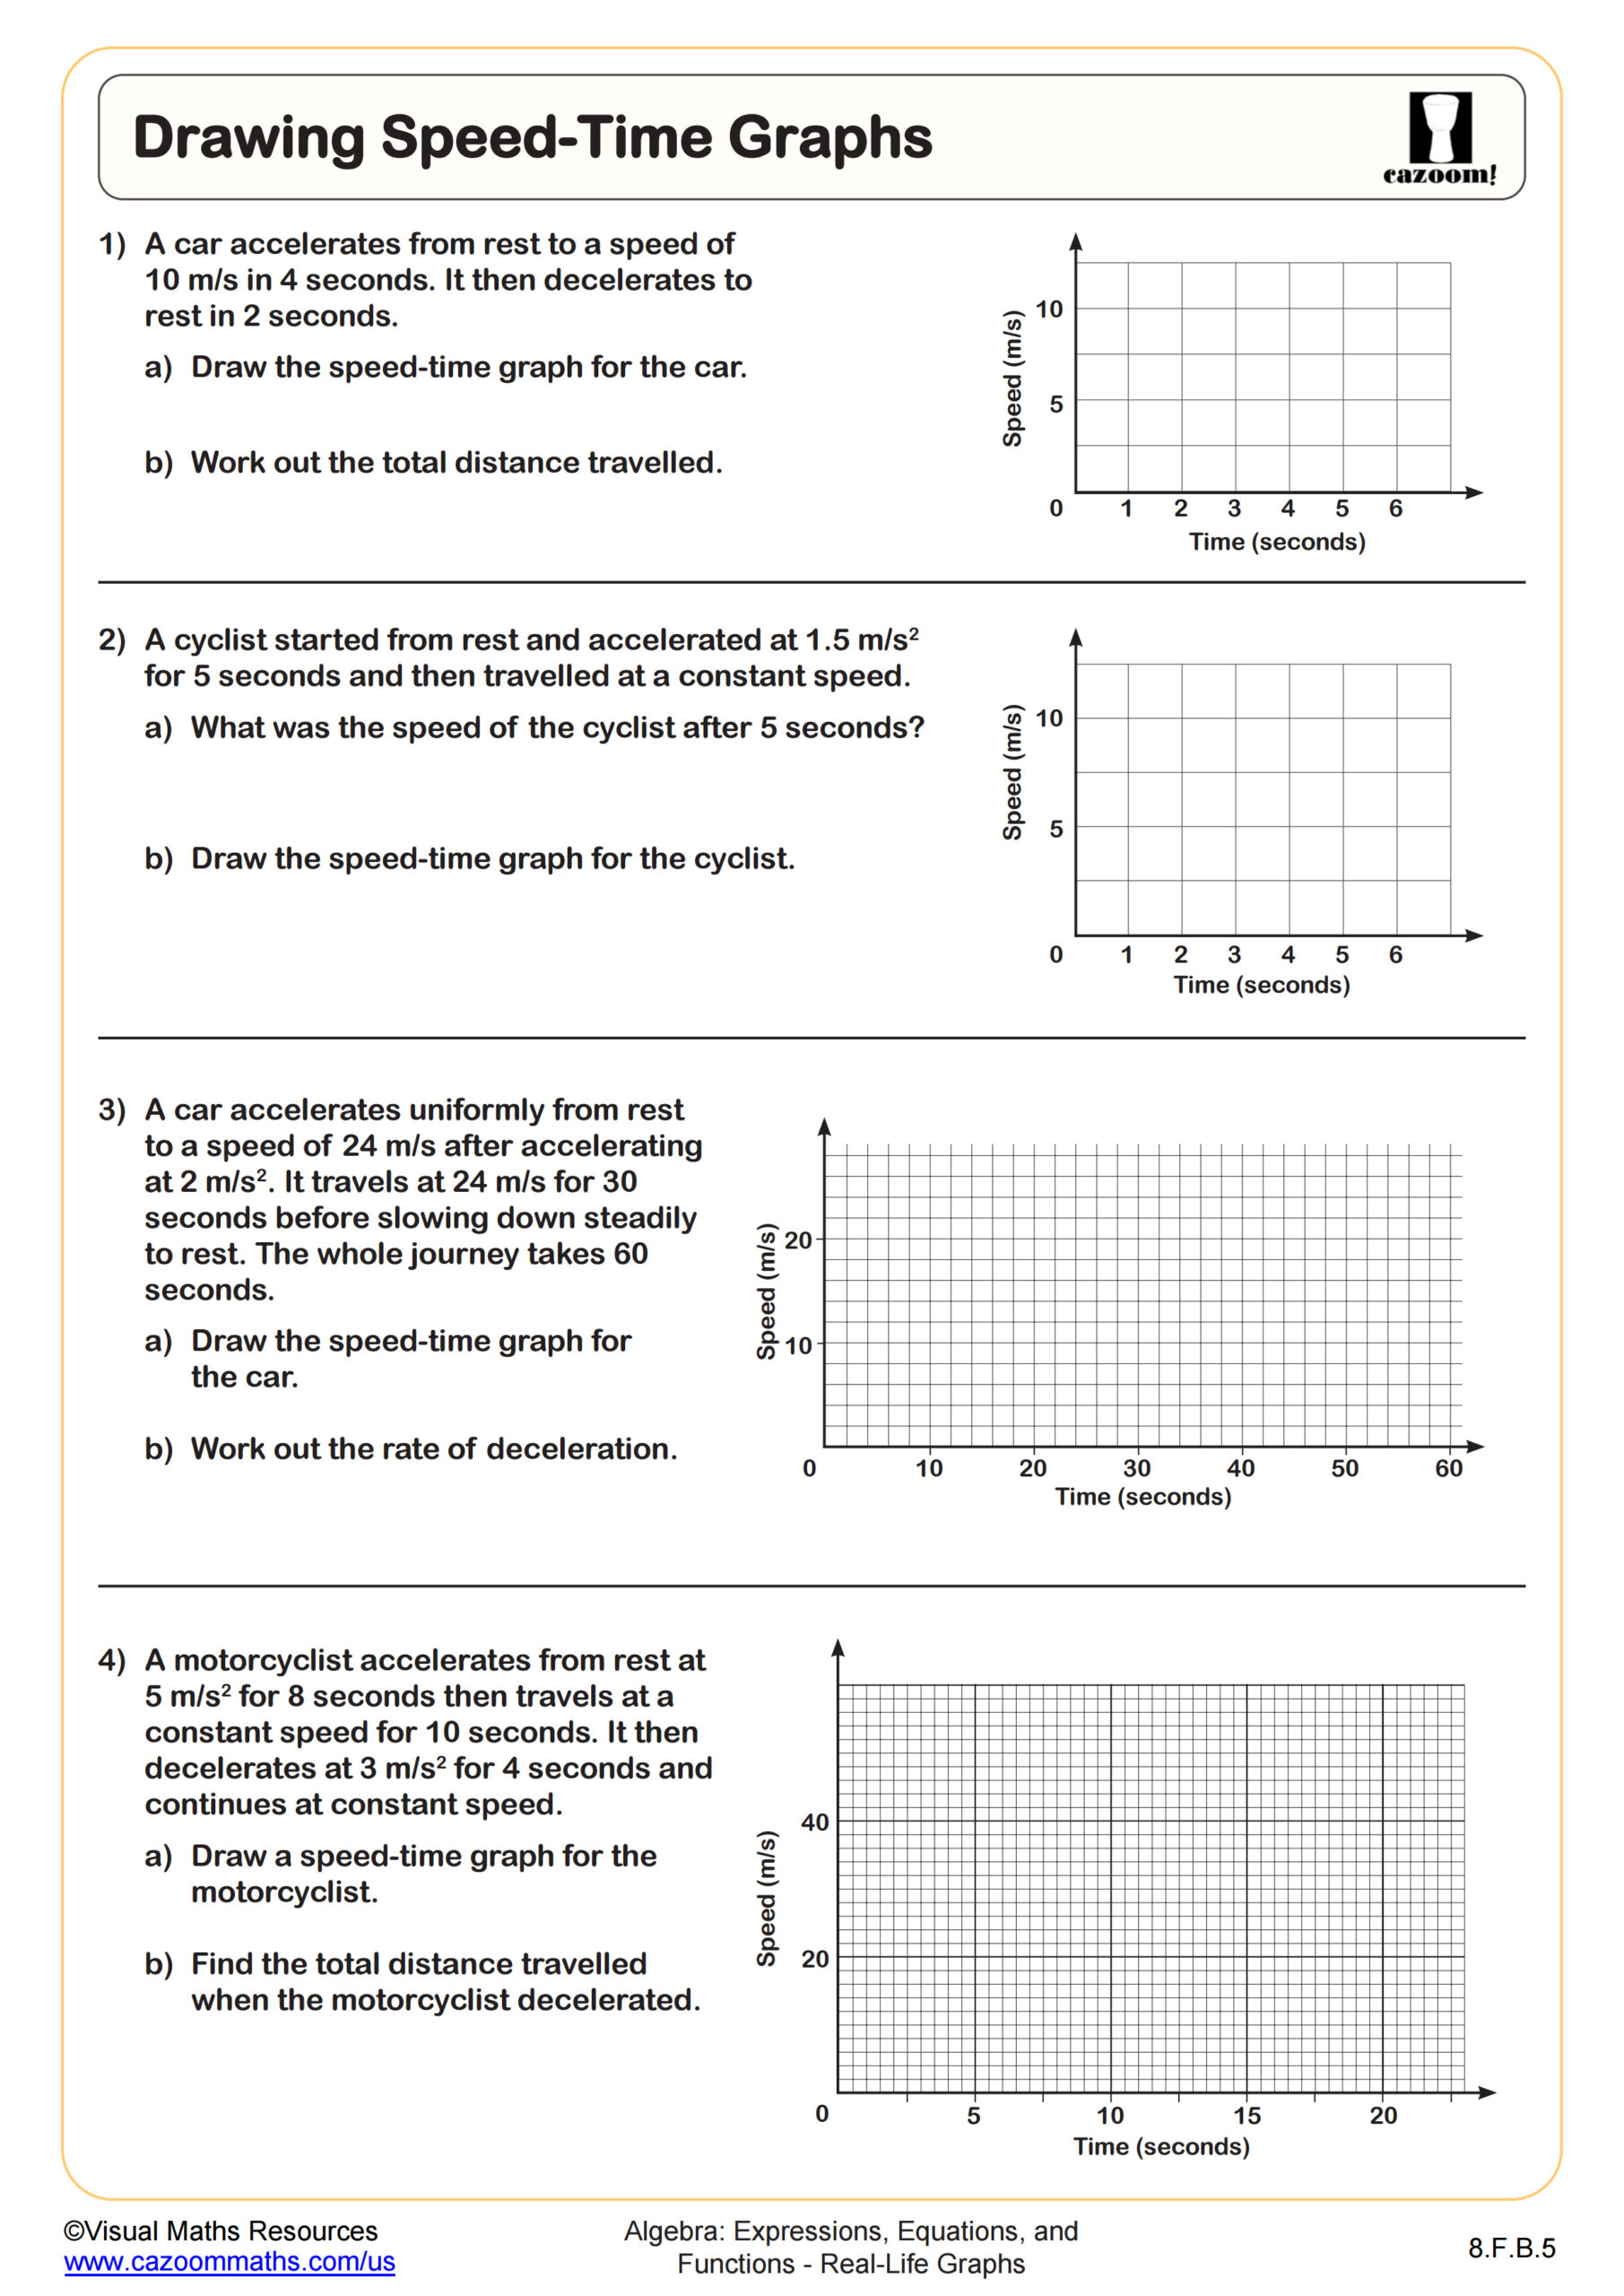
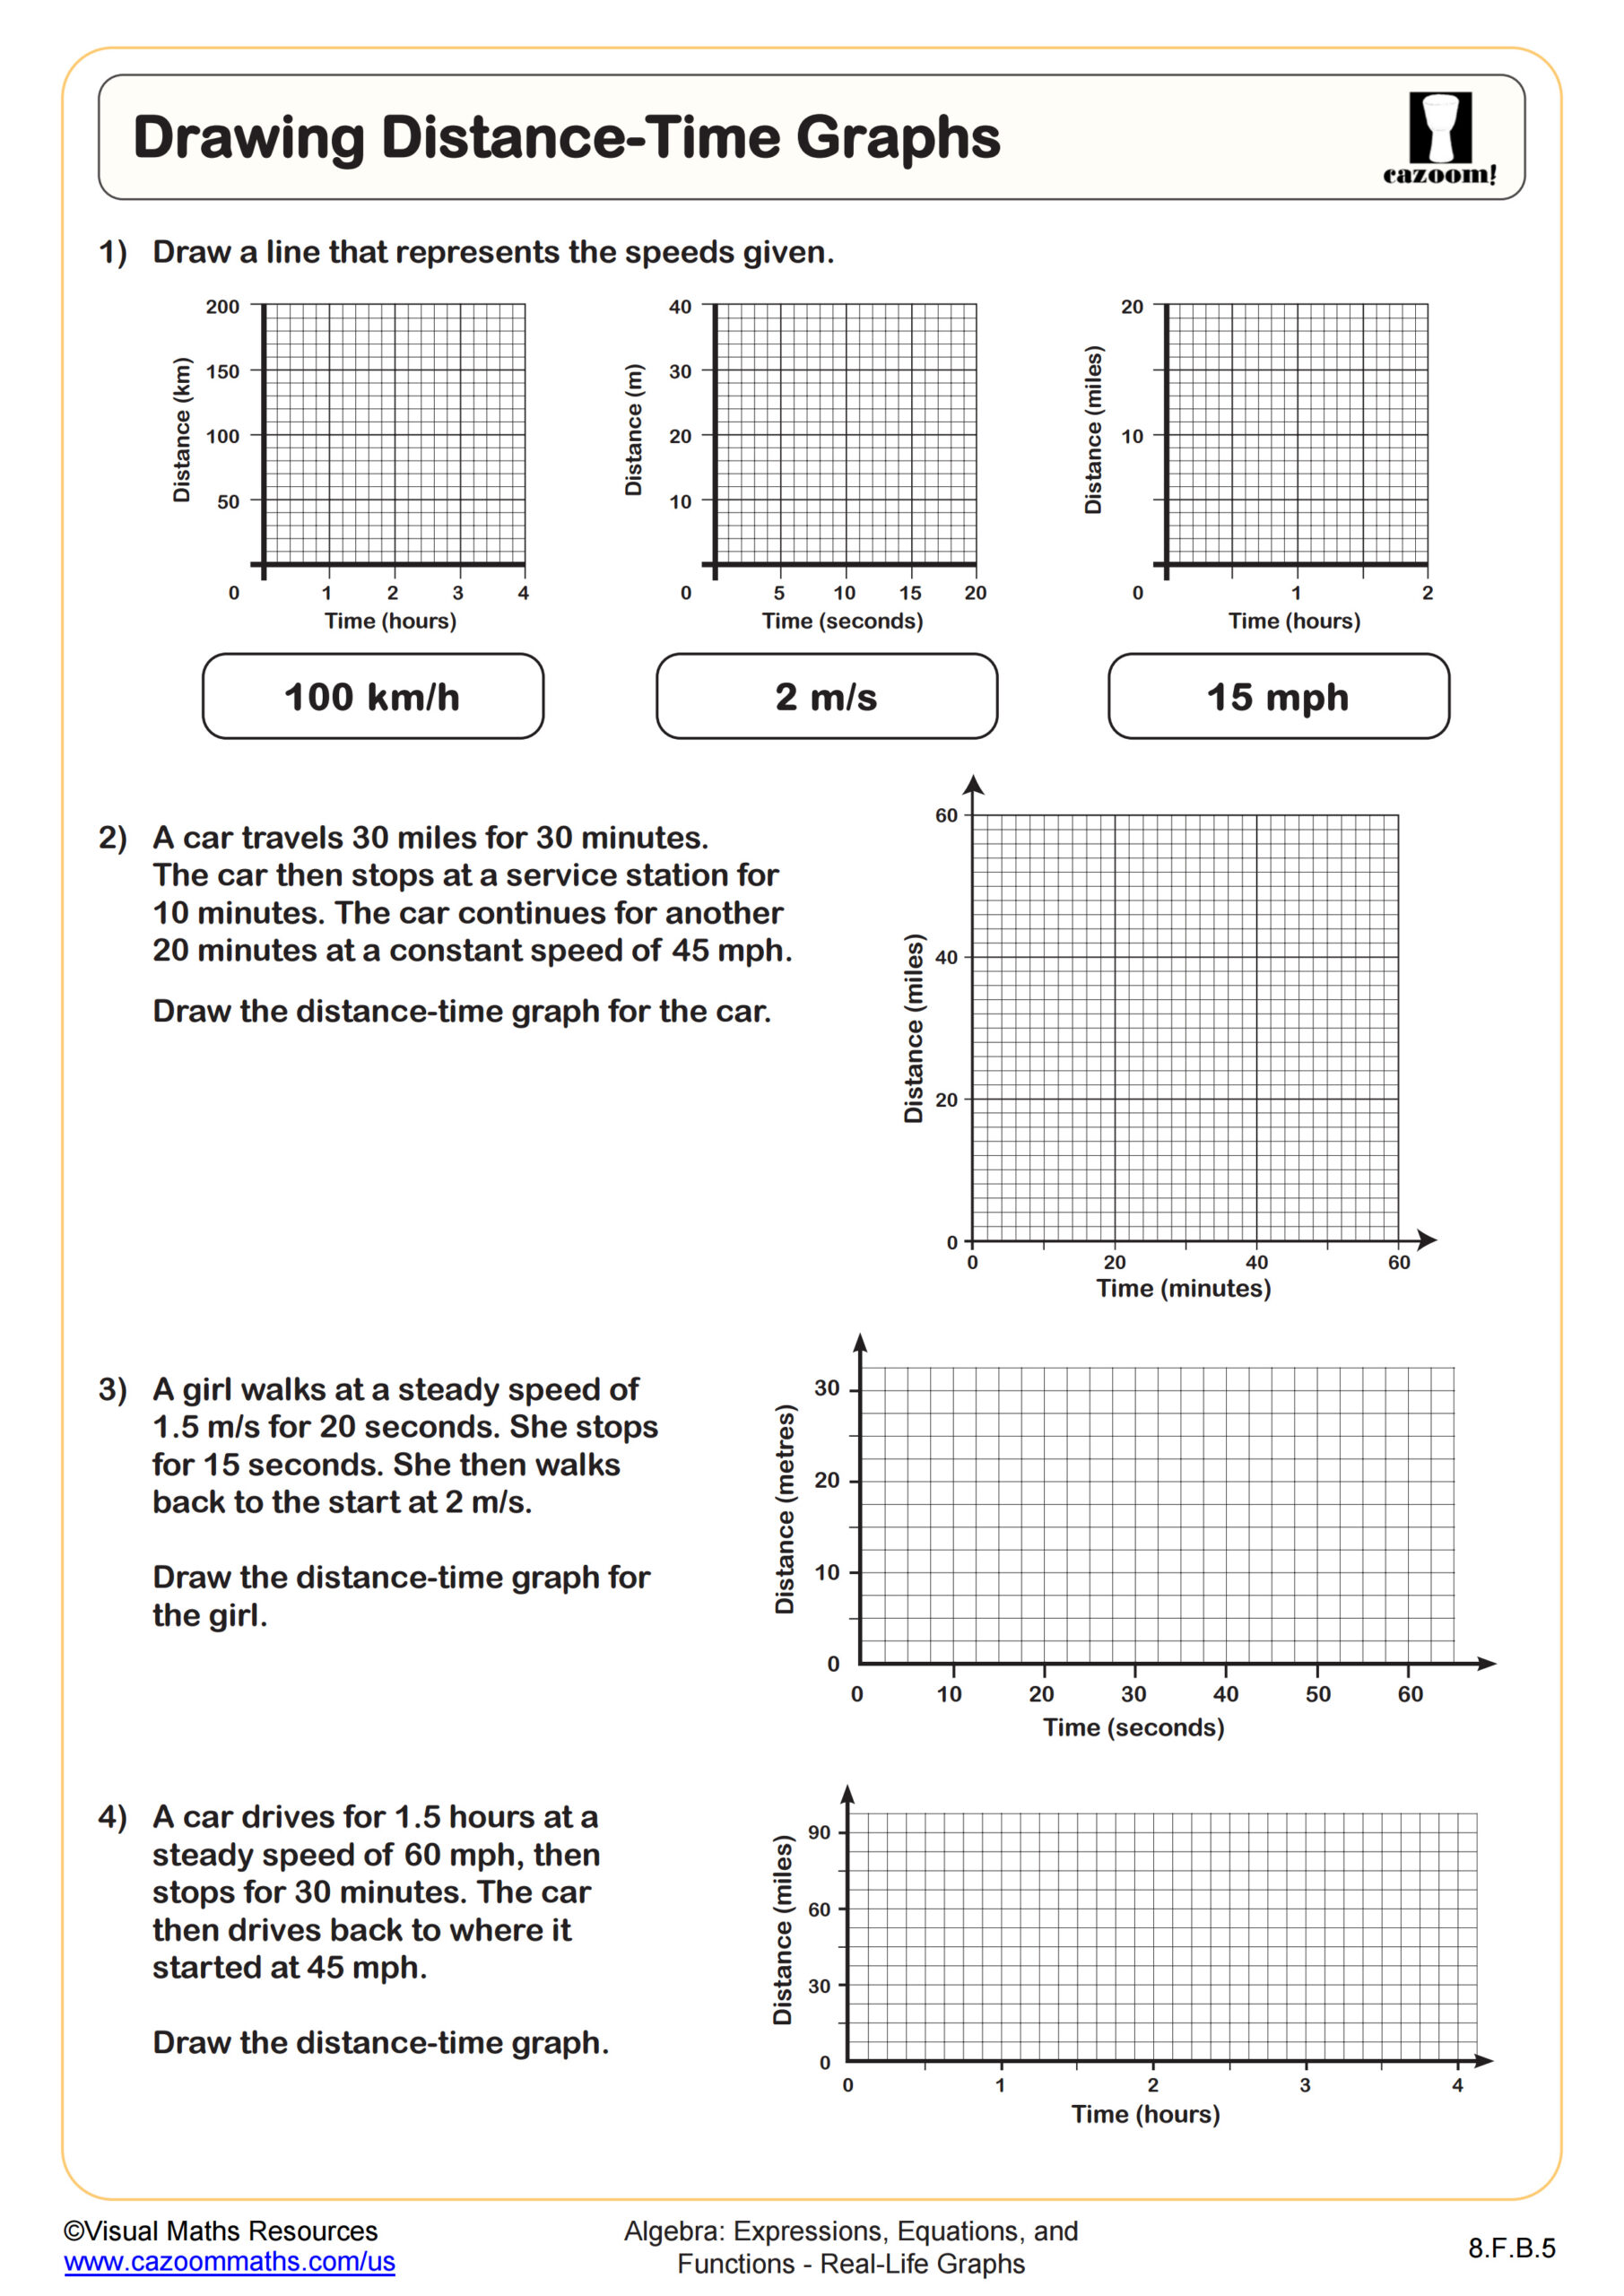
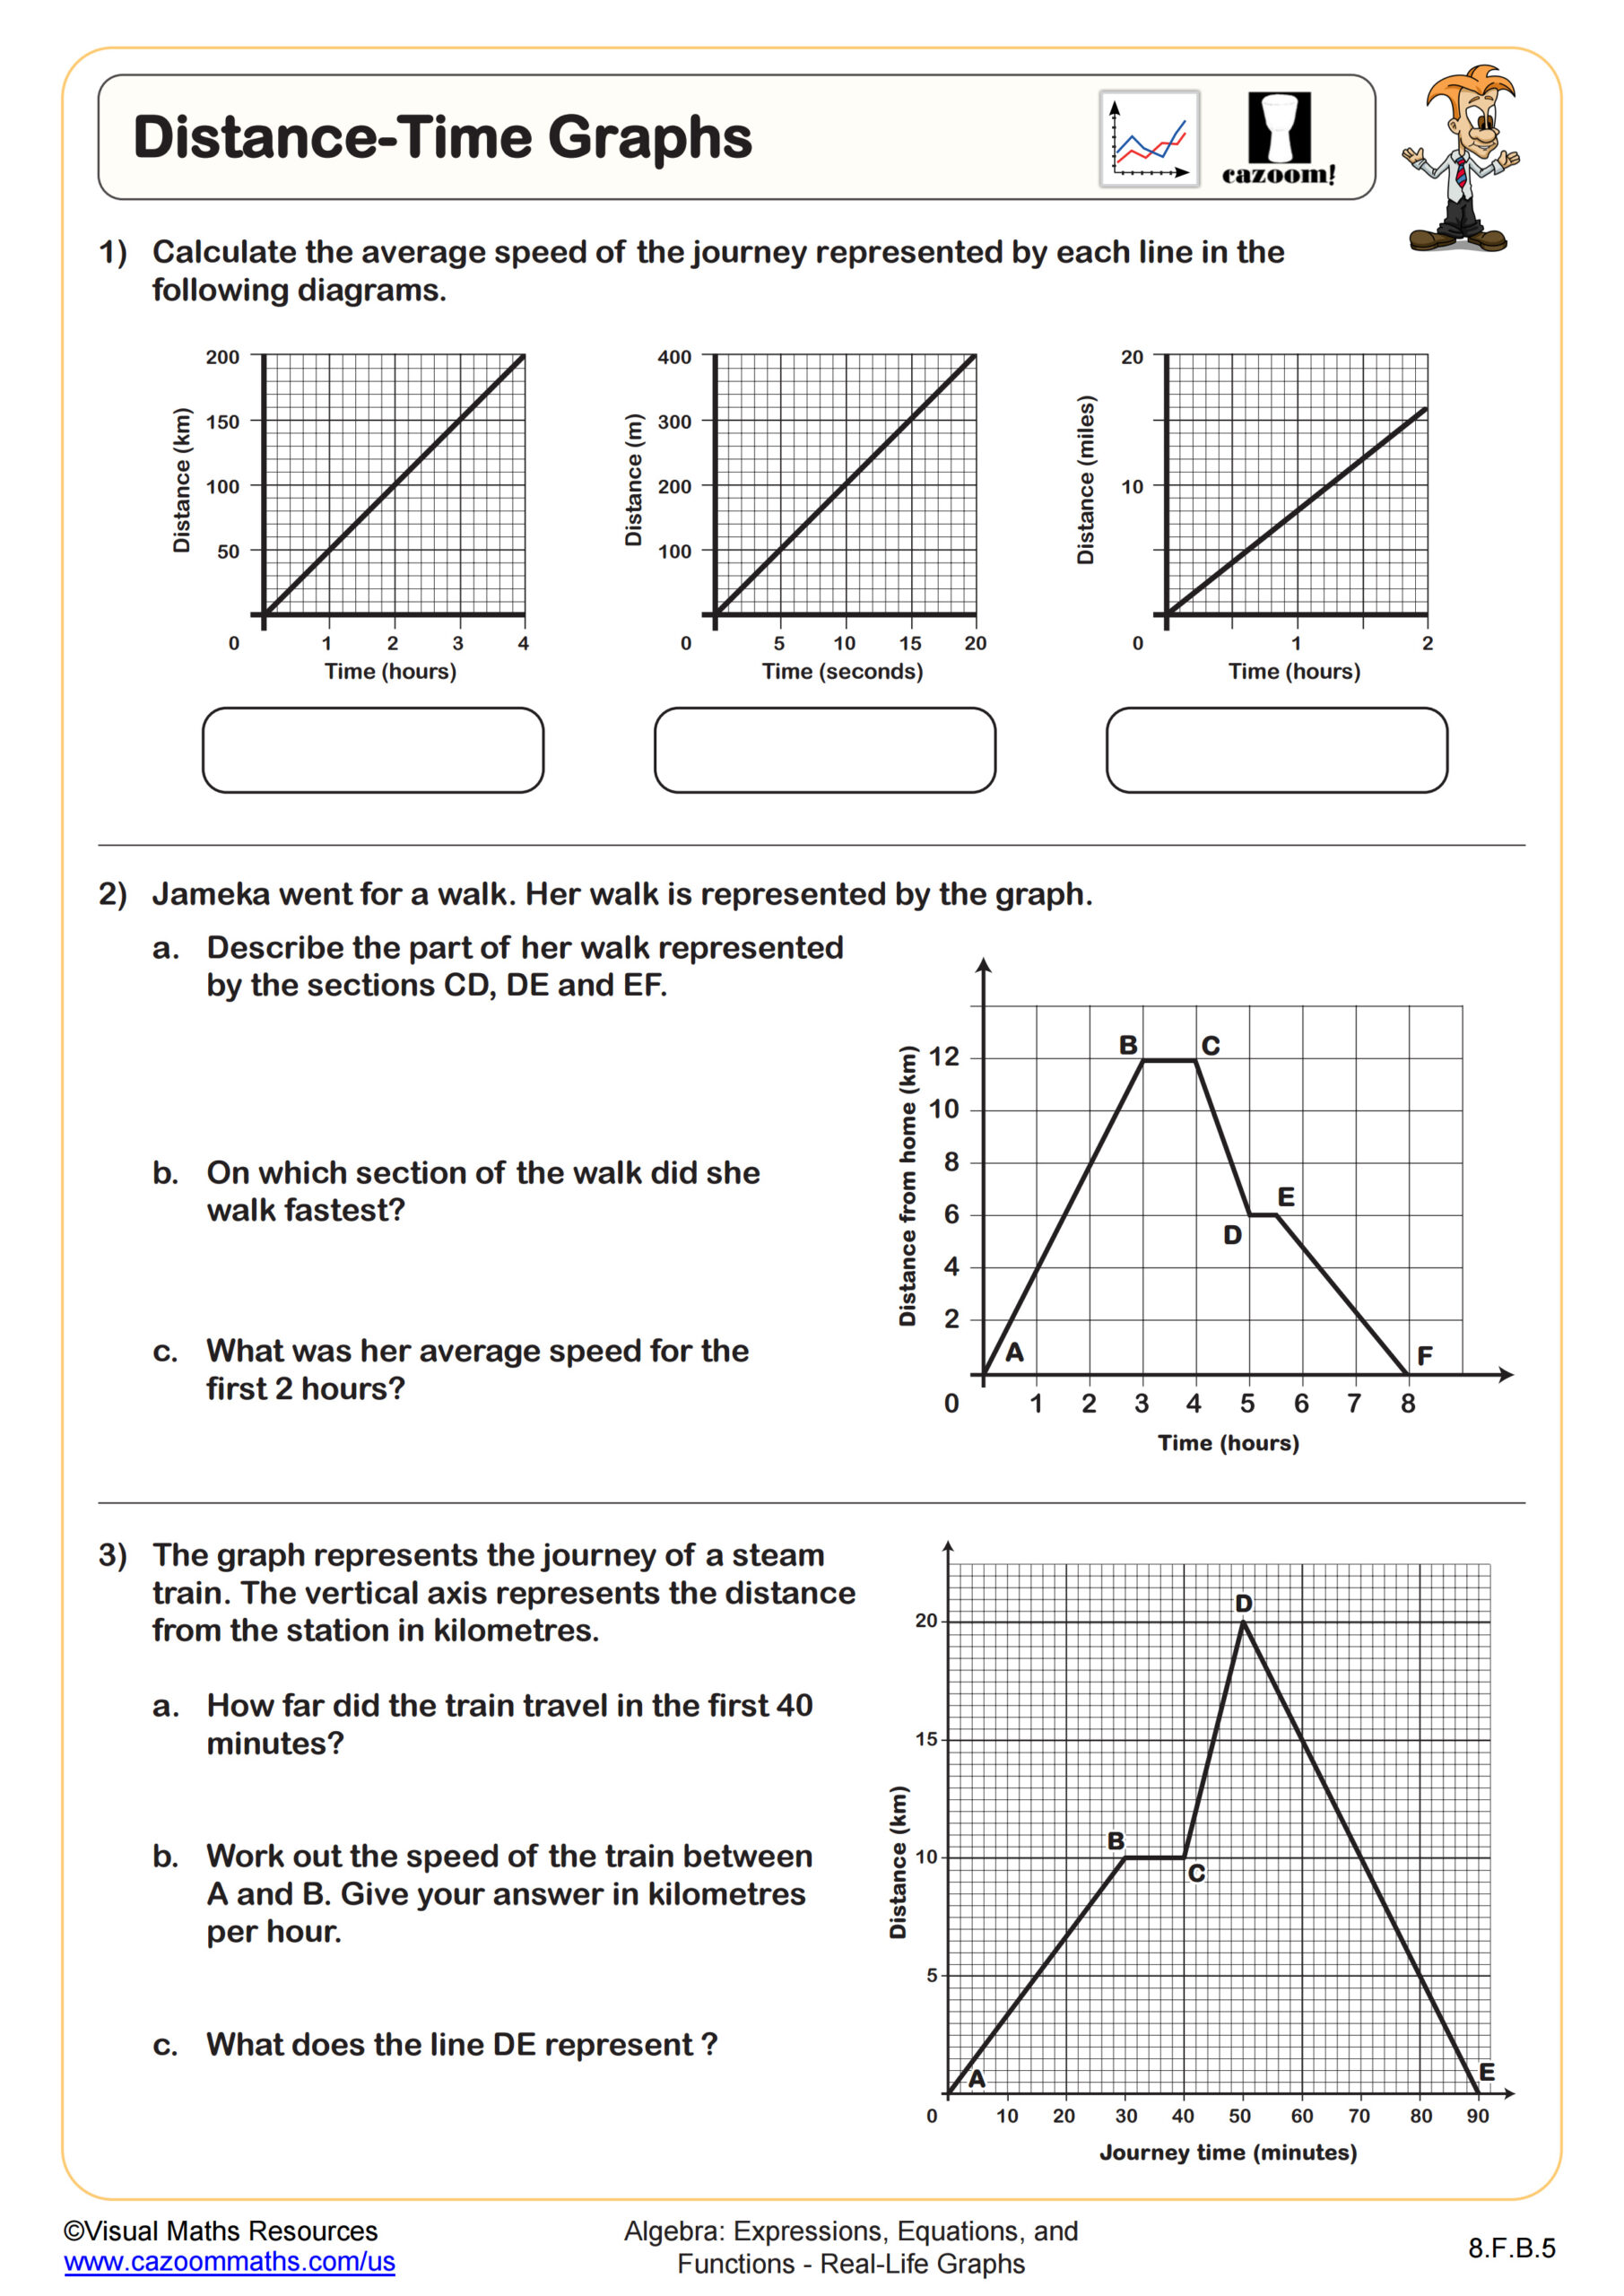
This worksheet will give learners the opportunity to looks at different graphs describing real life contexts. They will need to read from the graphs, describe the situation from the shape of the graph, and solve problems based on information presented in the graph. The worksheet also introduces some vocabulary, such as logarithmic growth.
All worksheets are created by the team of experienced teachers at Cazoom Math.

RELATED TO Solving Real-Life Problems using Graphs WORKSHEET
Frequently Asked Questions
This solving real-life problems using graphs worksheet is designed for students in Algebra I and IM 1 and aligns with Common Core State Standards.