Back to:
Stem and Leaf Plots (B) WORKSHEET
Suitable for Grades: 6th Grade, Geometry
CCSS: 6.SP.B.4, HSS.ID.A.1
CCSS Description: Display numerical data in plots on a number line, including dot plots, histograms, and box plots.
Represent data with plots on the real number line (dot plots, histograms, and box plots).
Represent data with plots on the real number line (dot plots, histograms, and box plots).
Stem and Leaf Plots (B) WORKSHEET DESCRIPTION
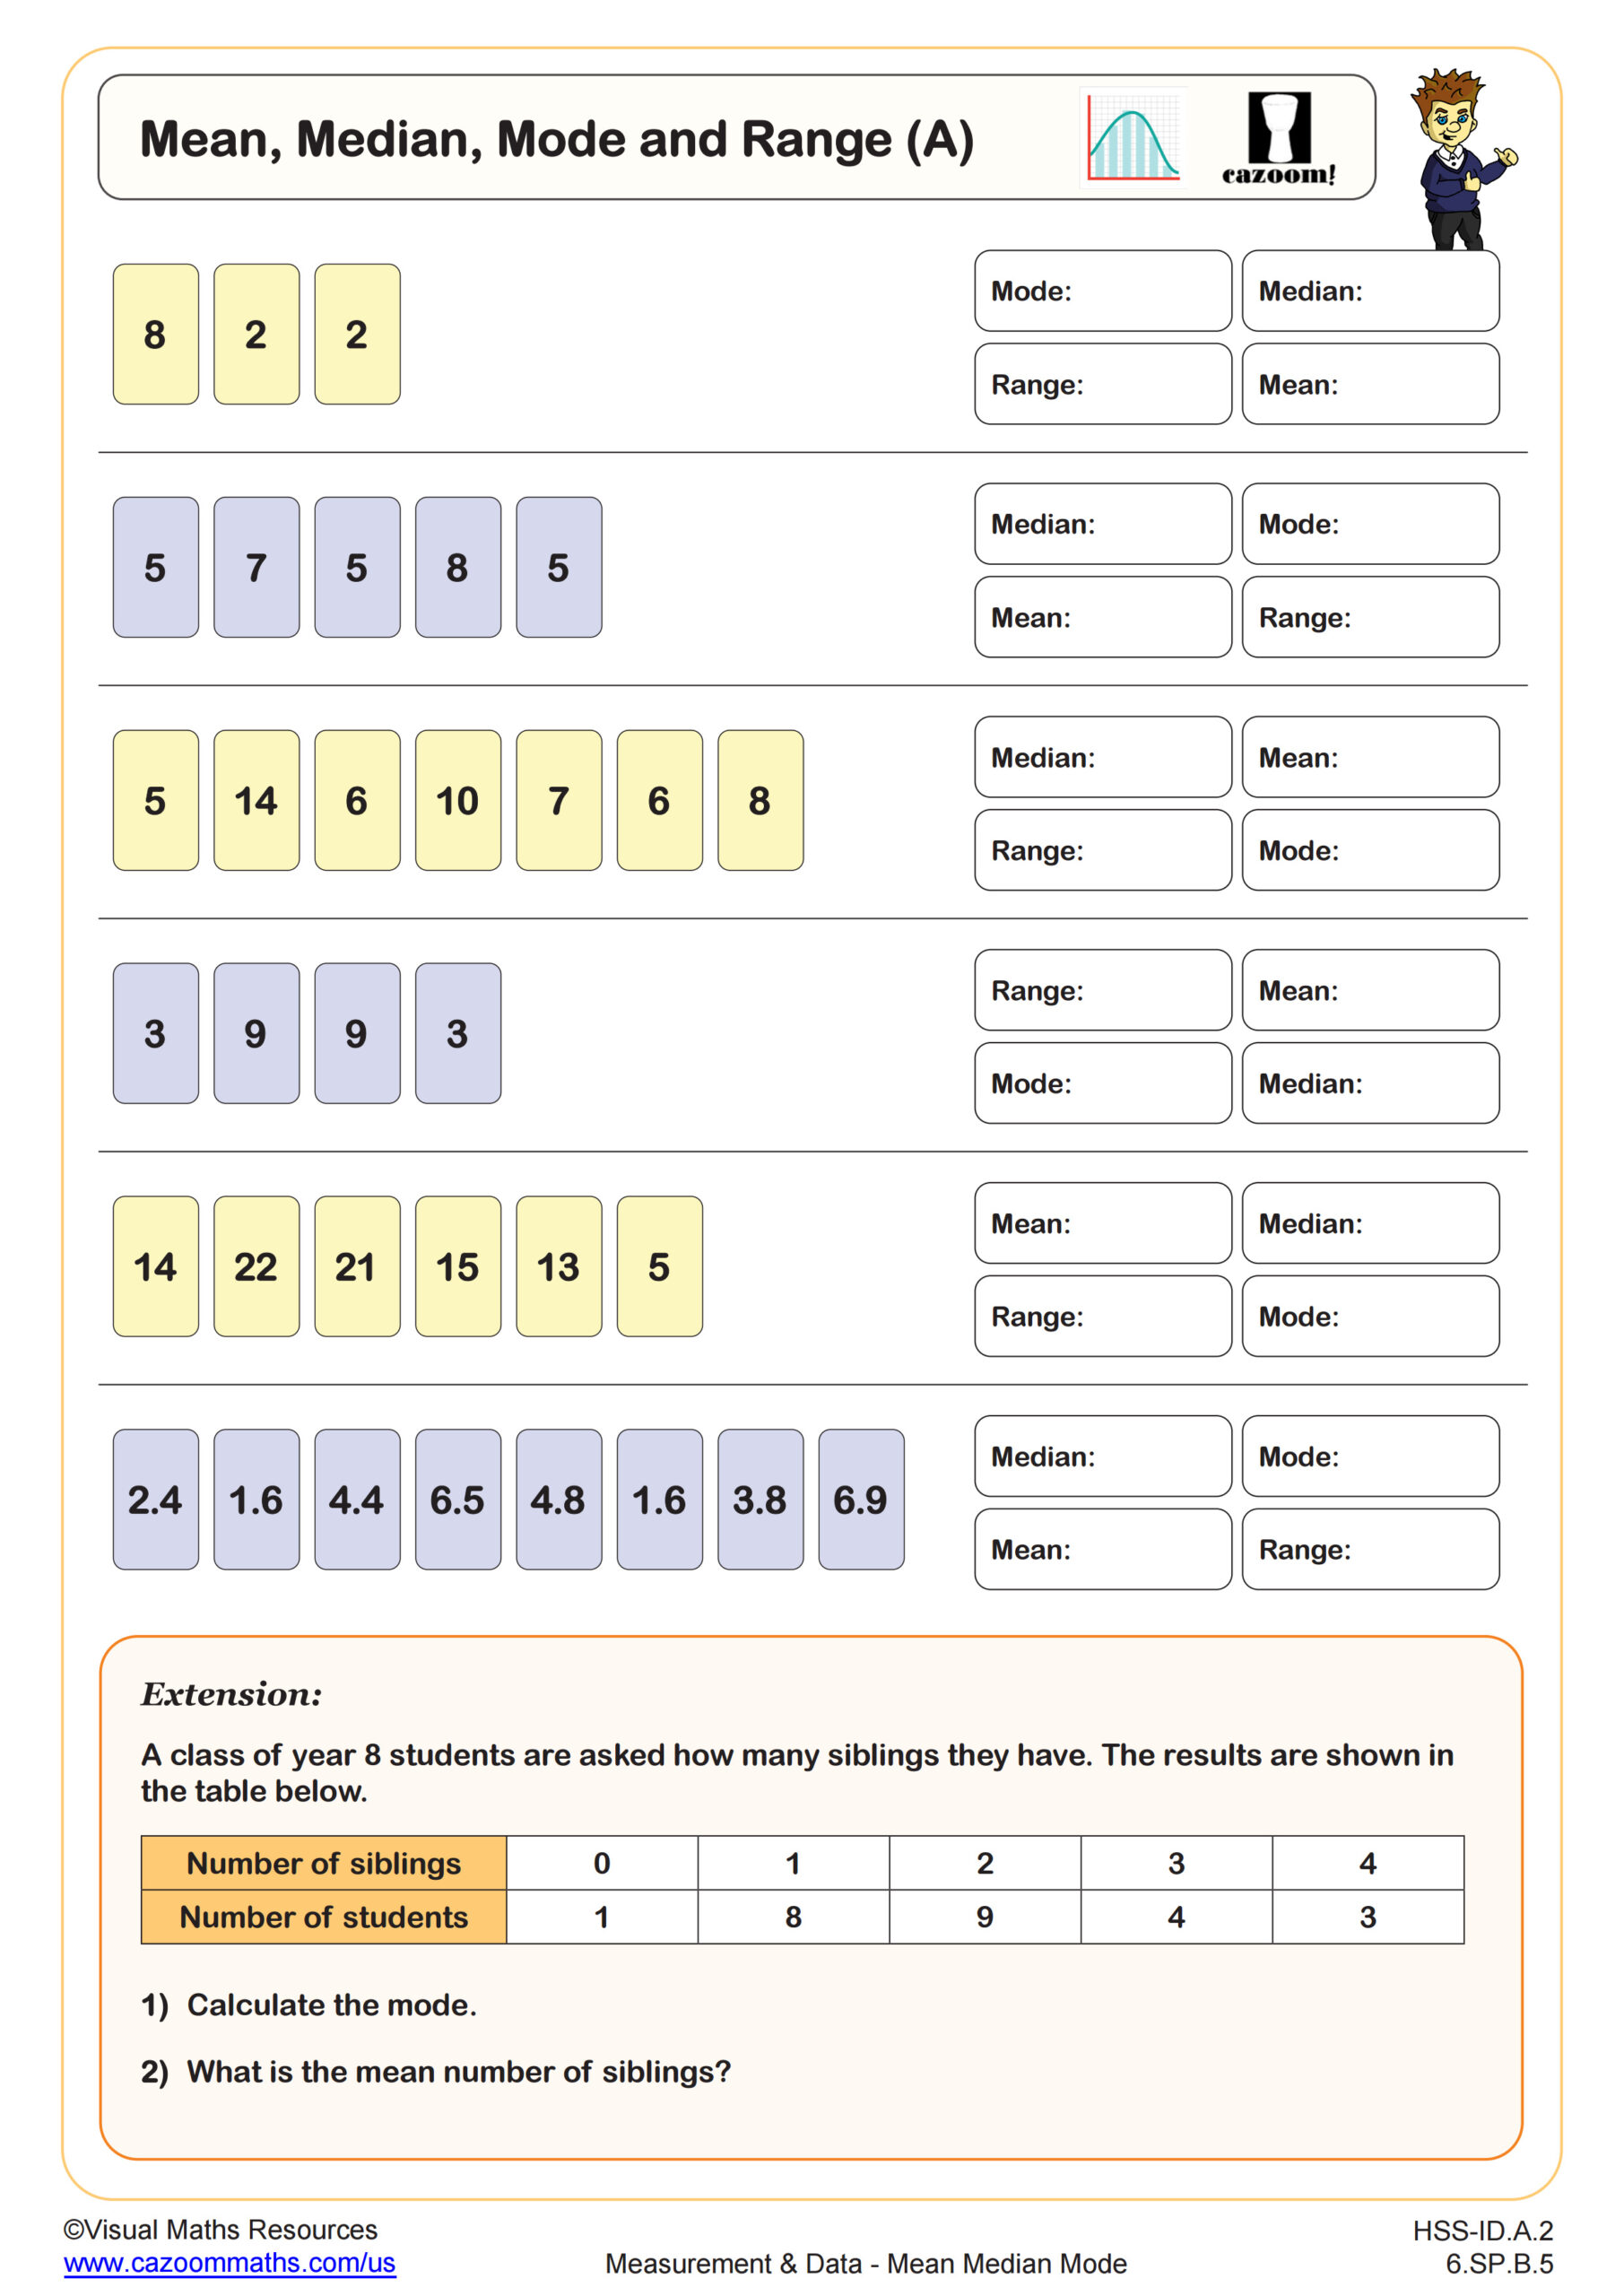
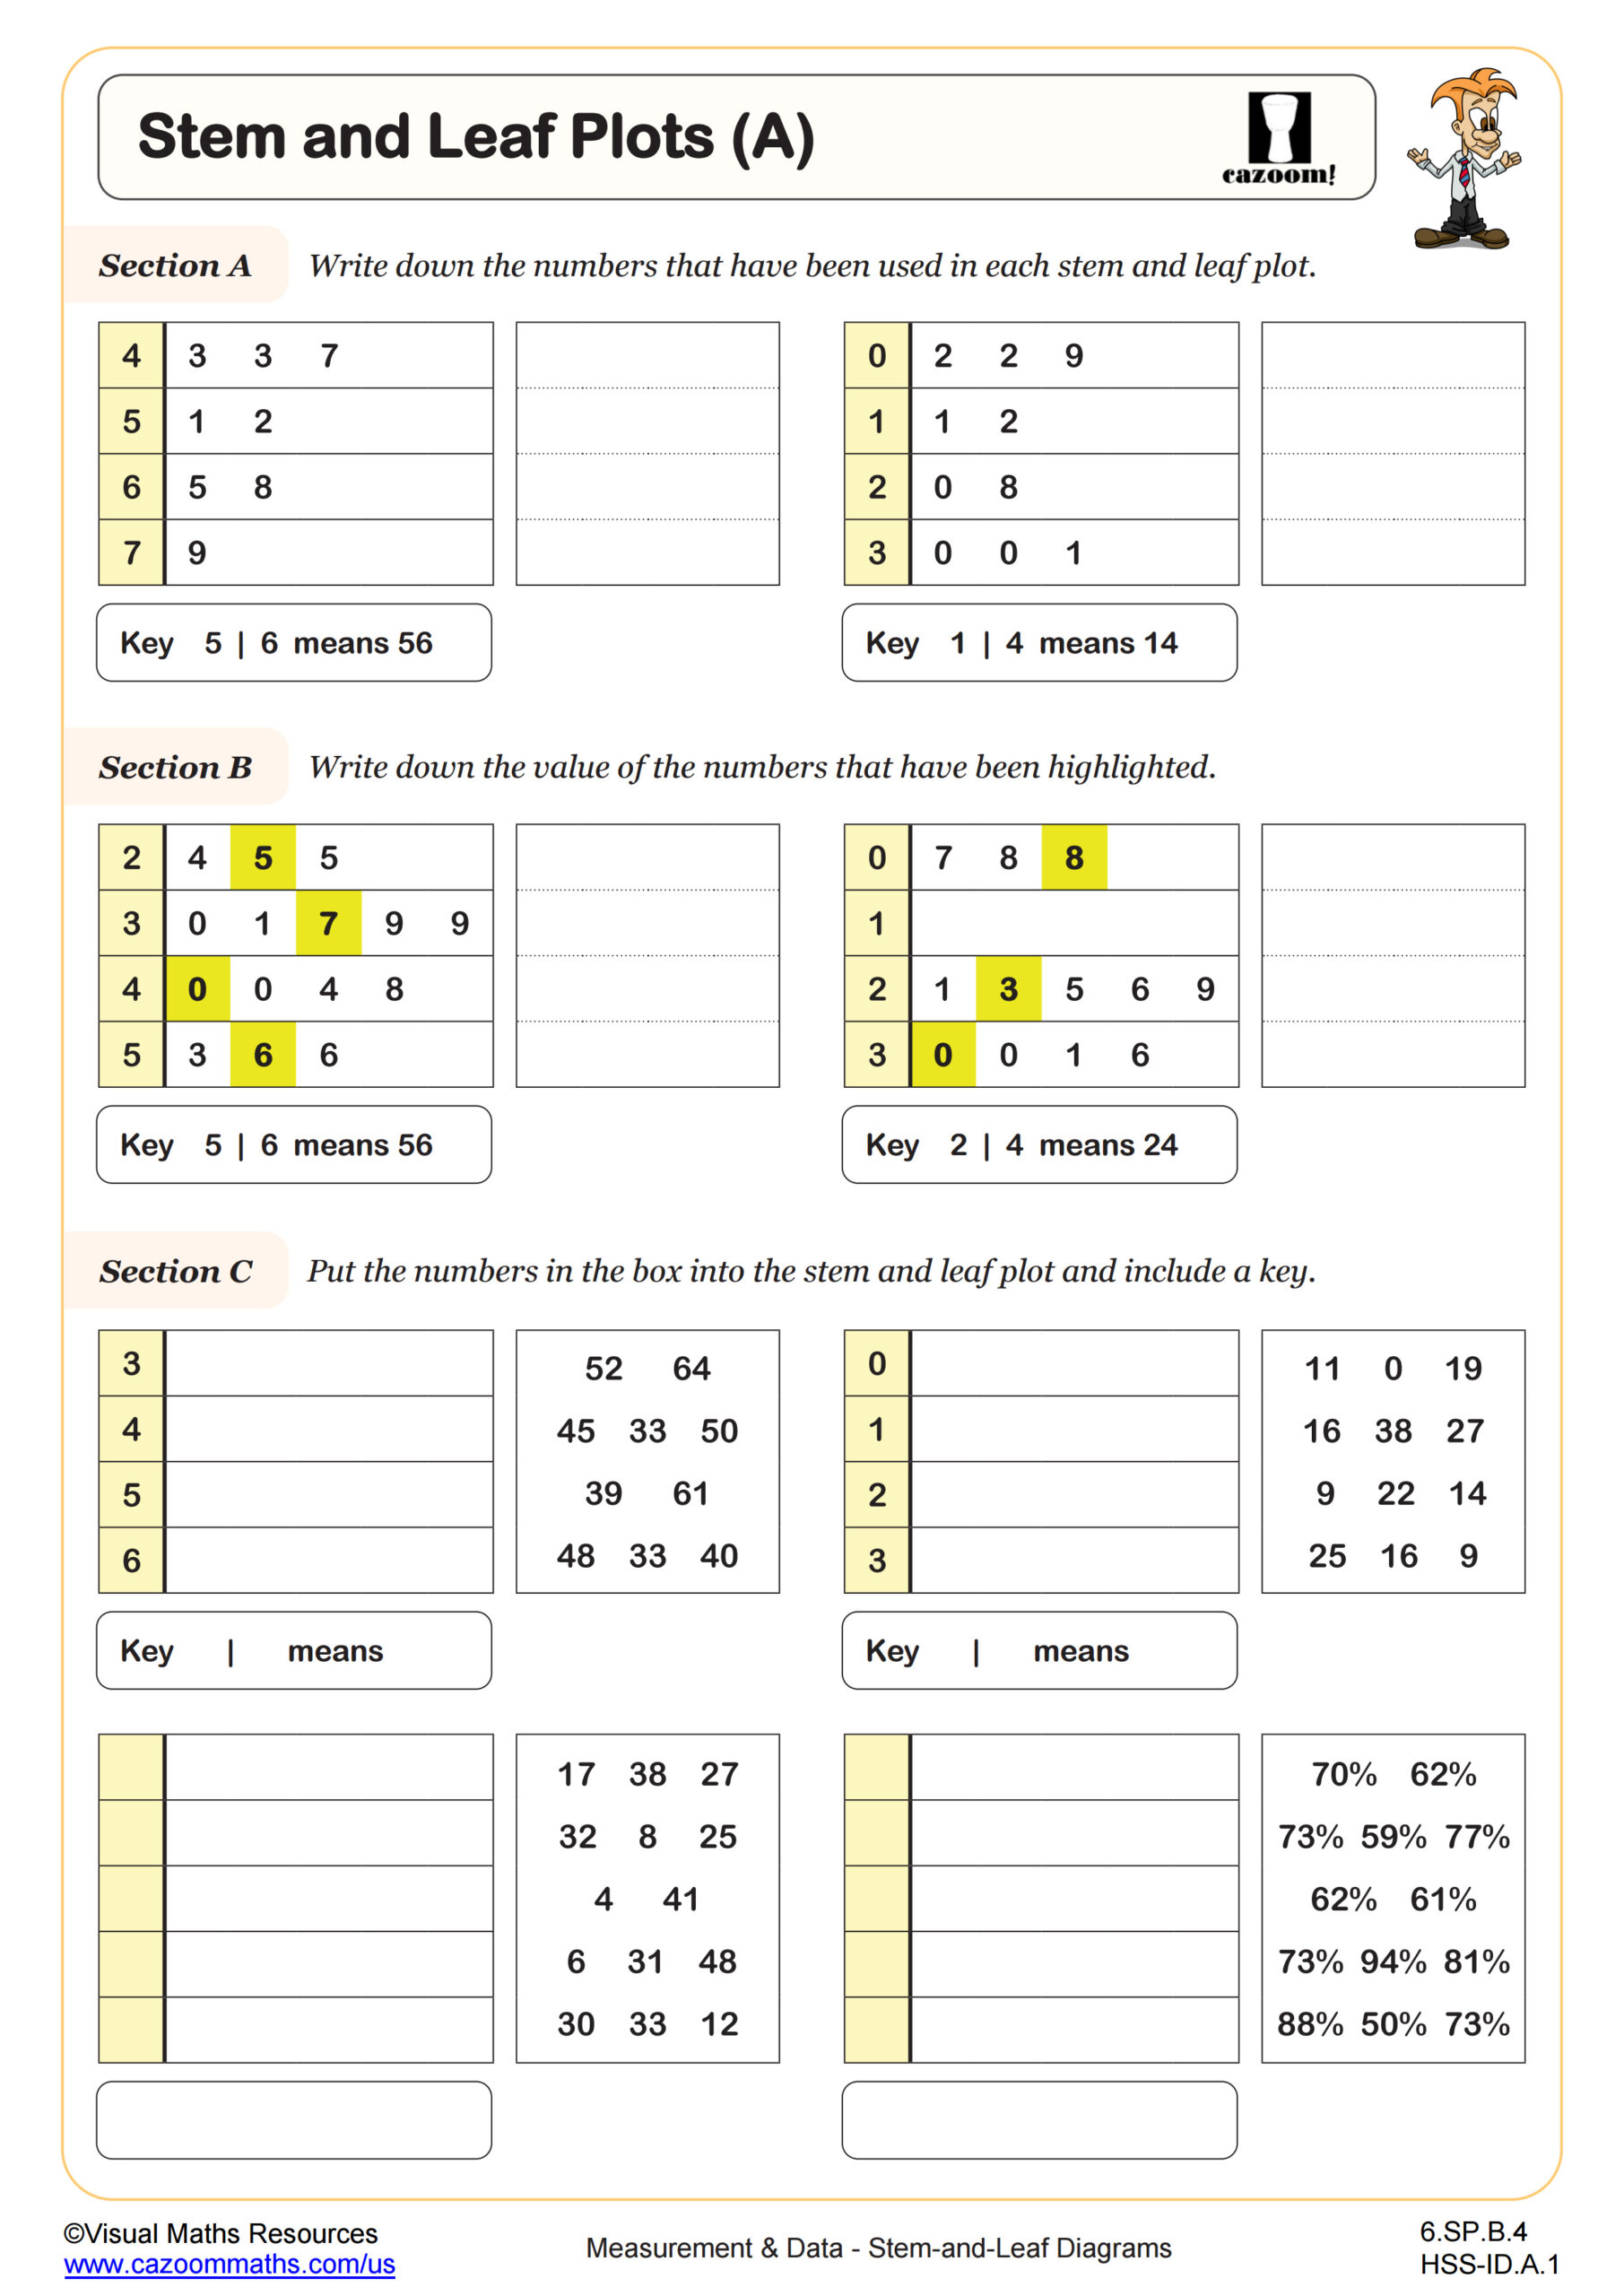
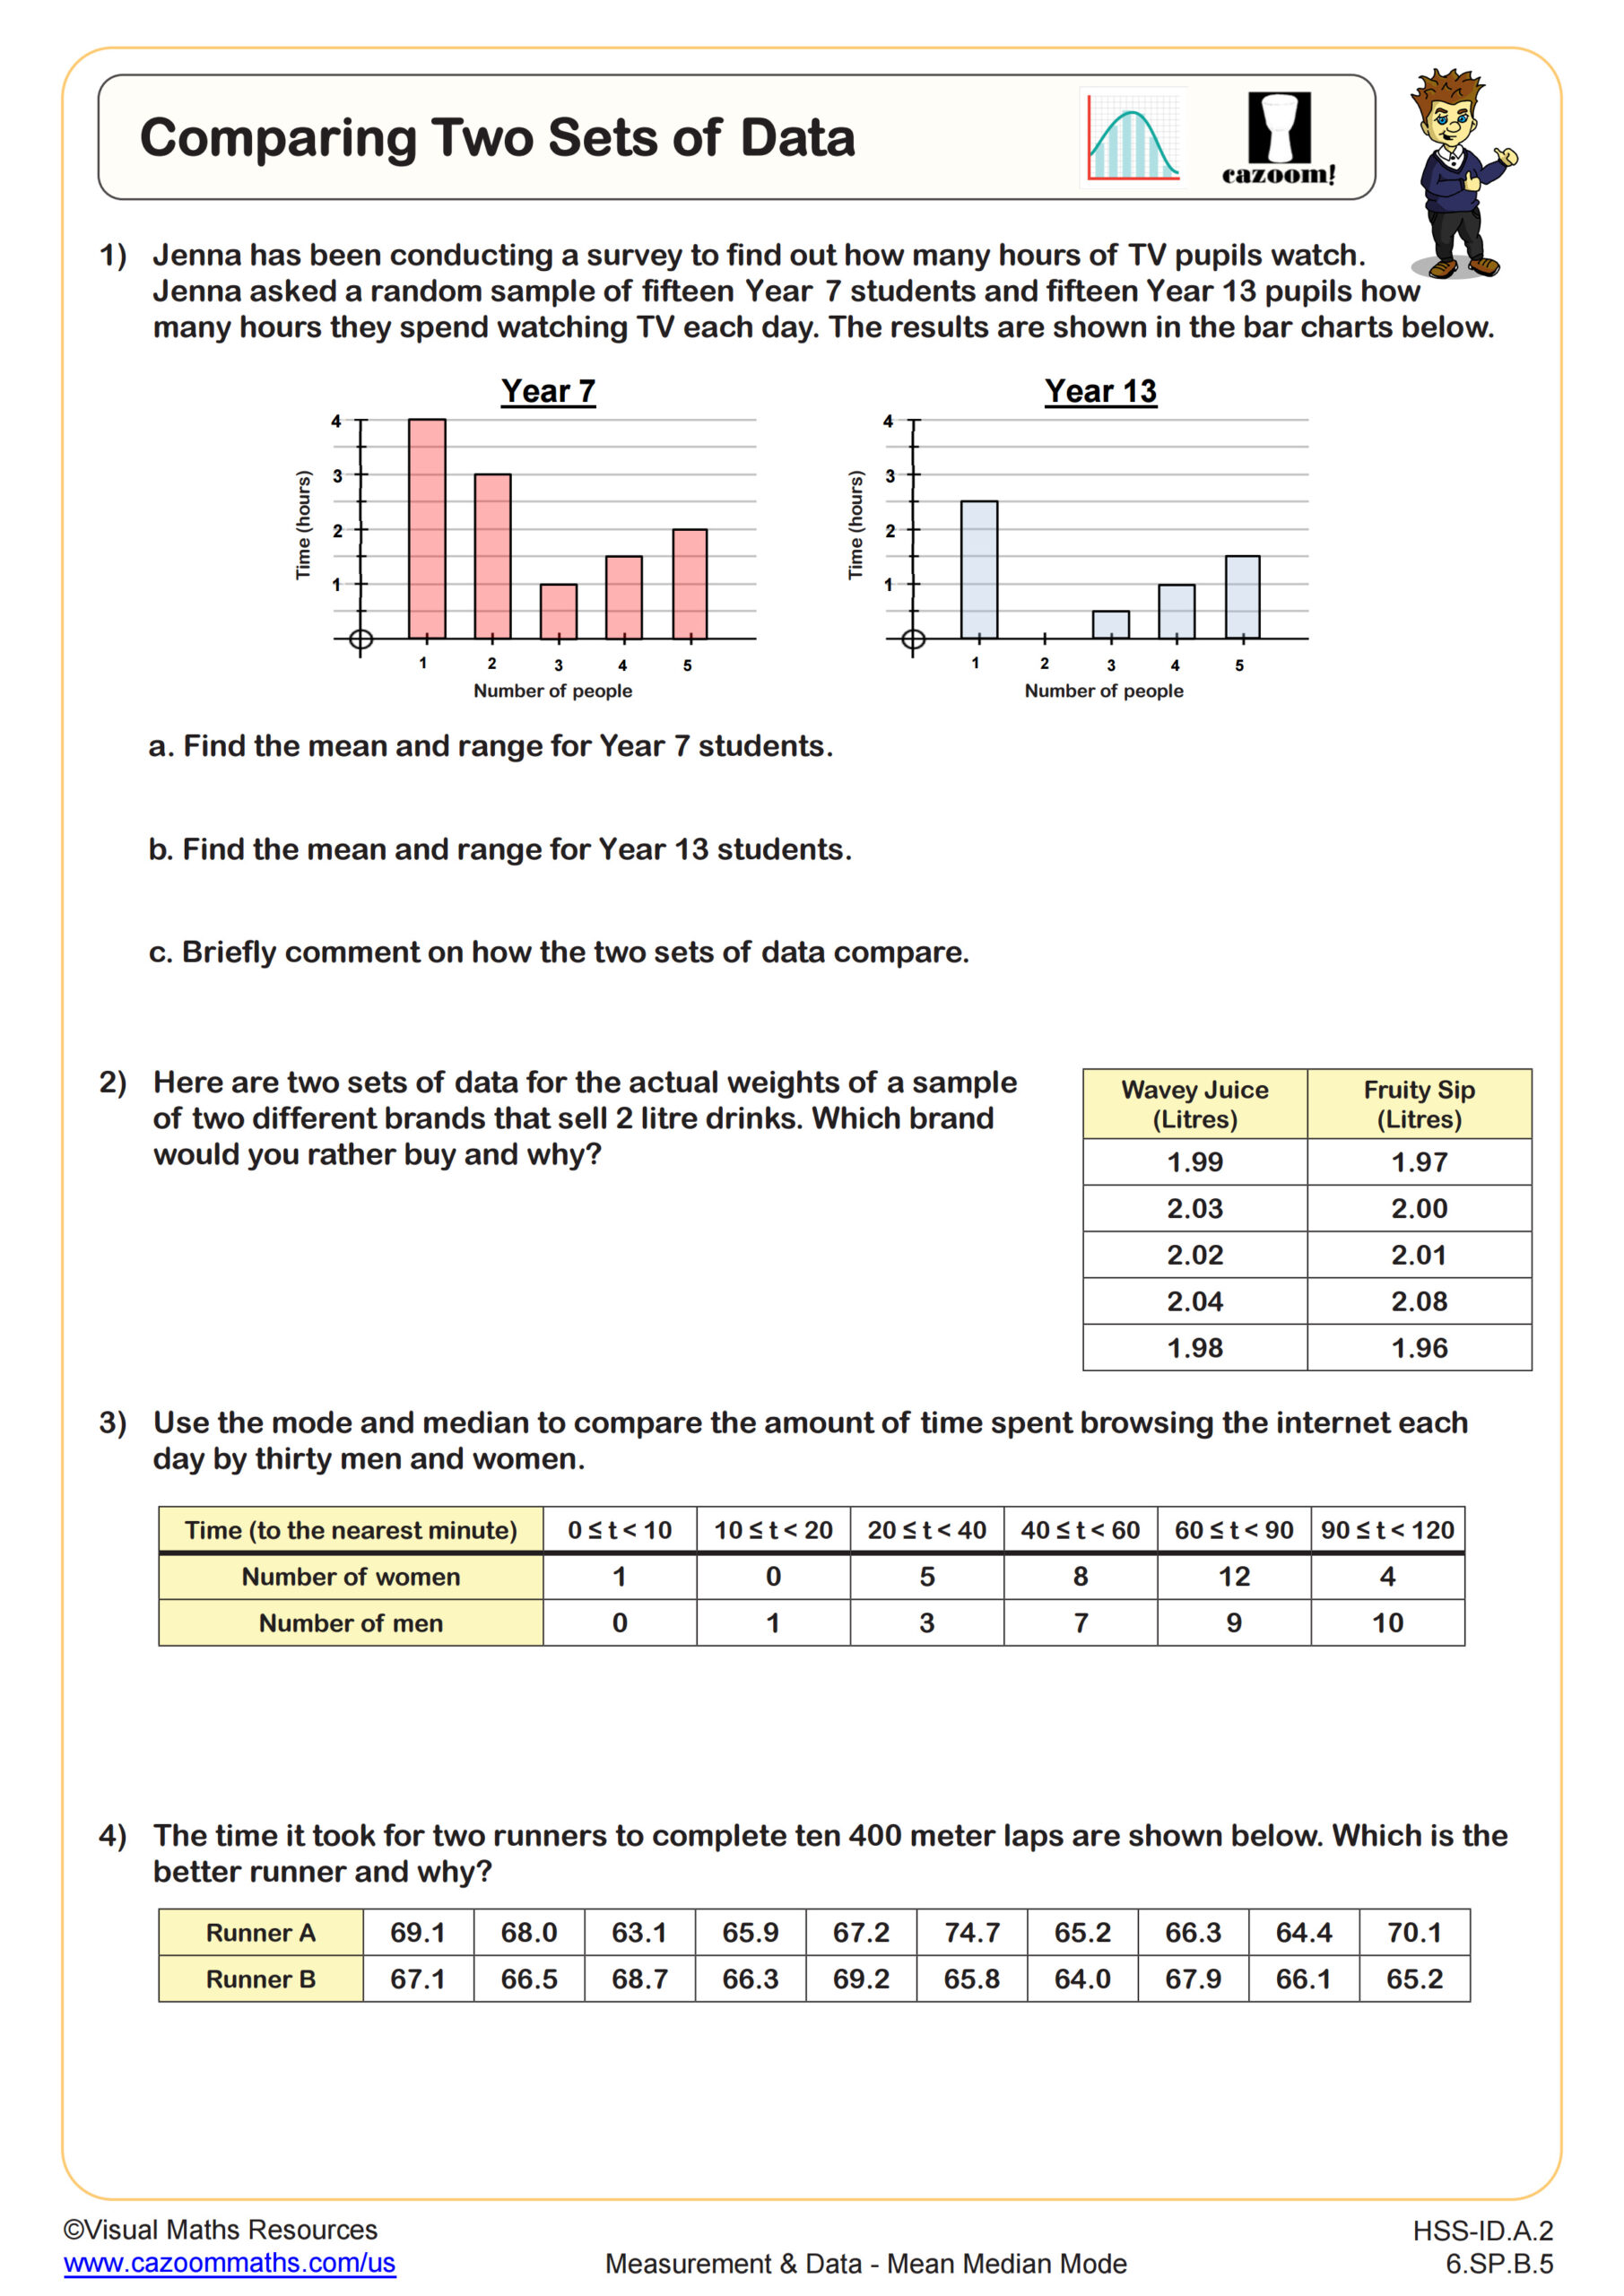
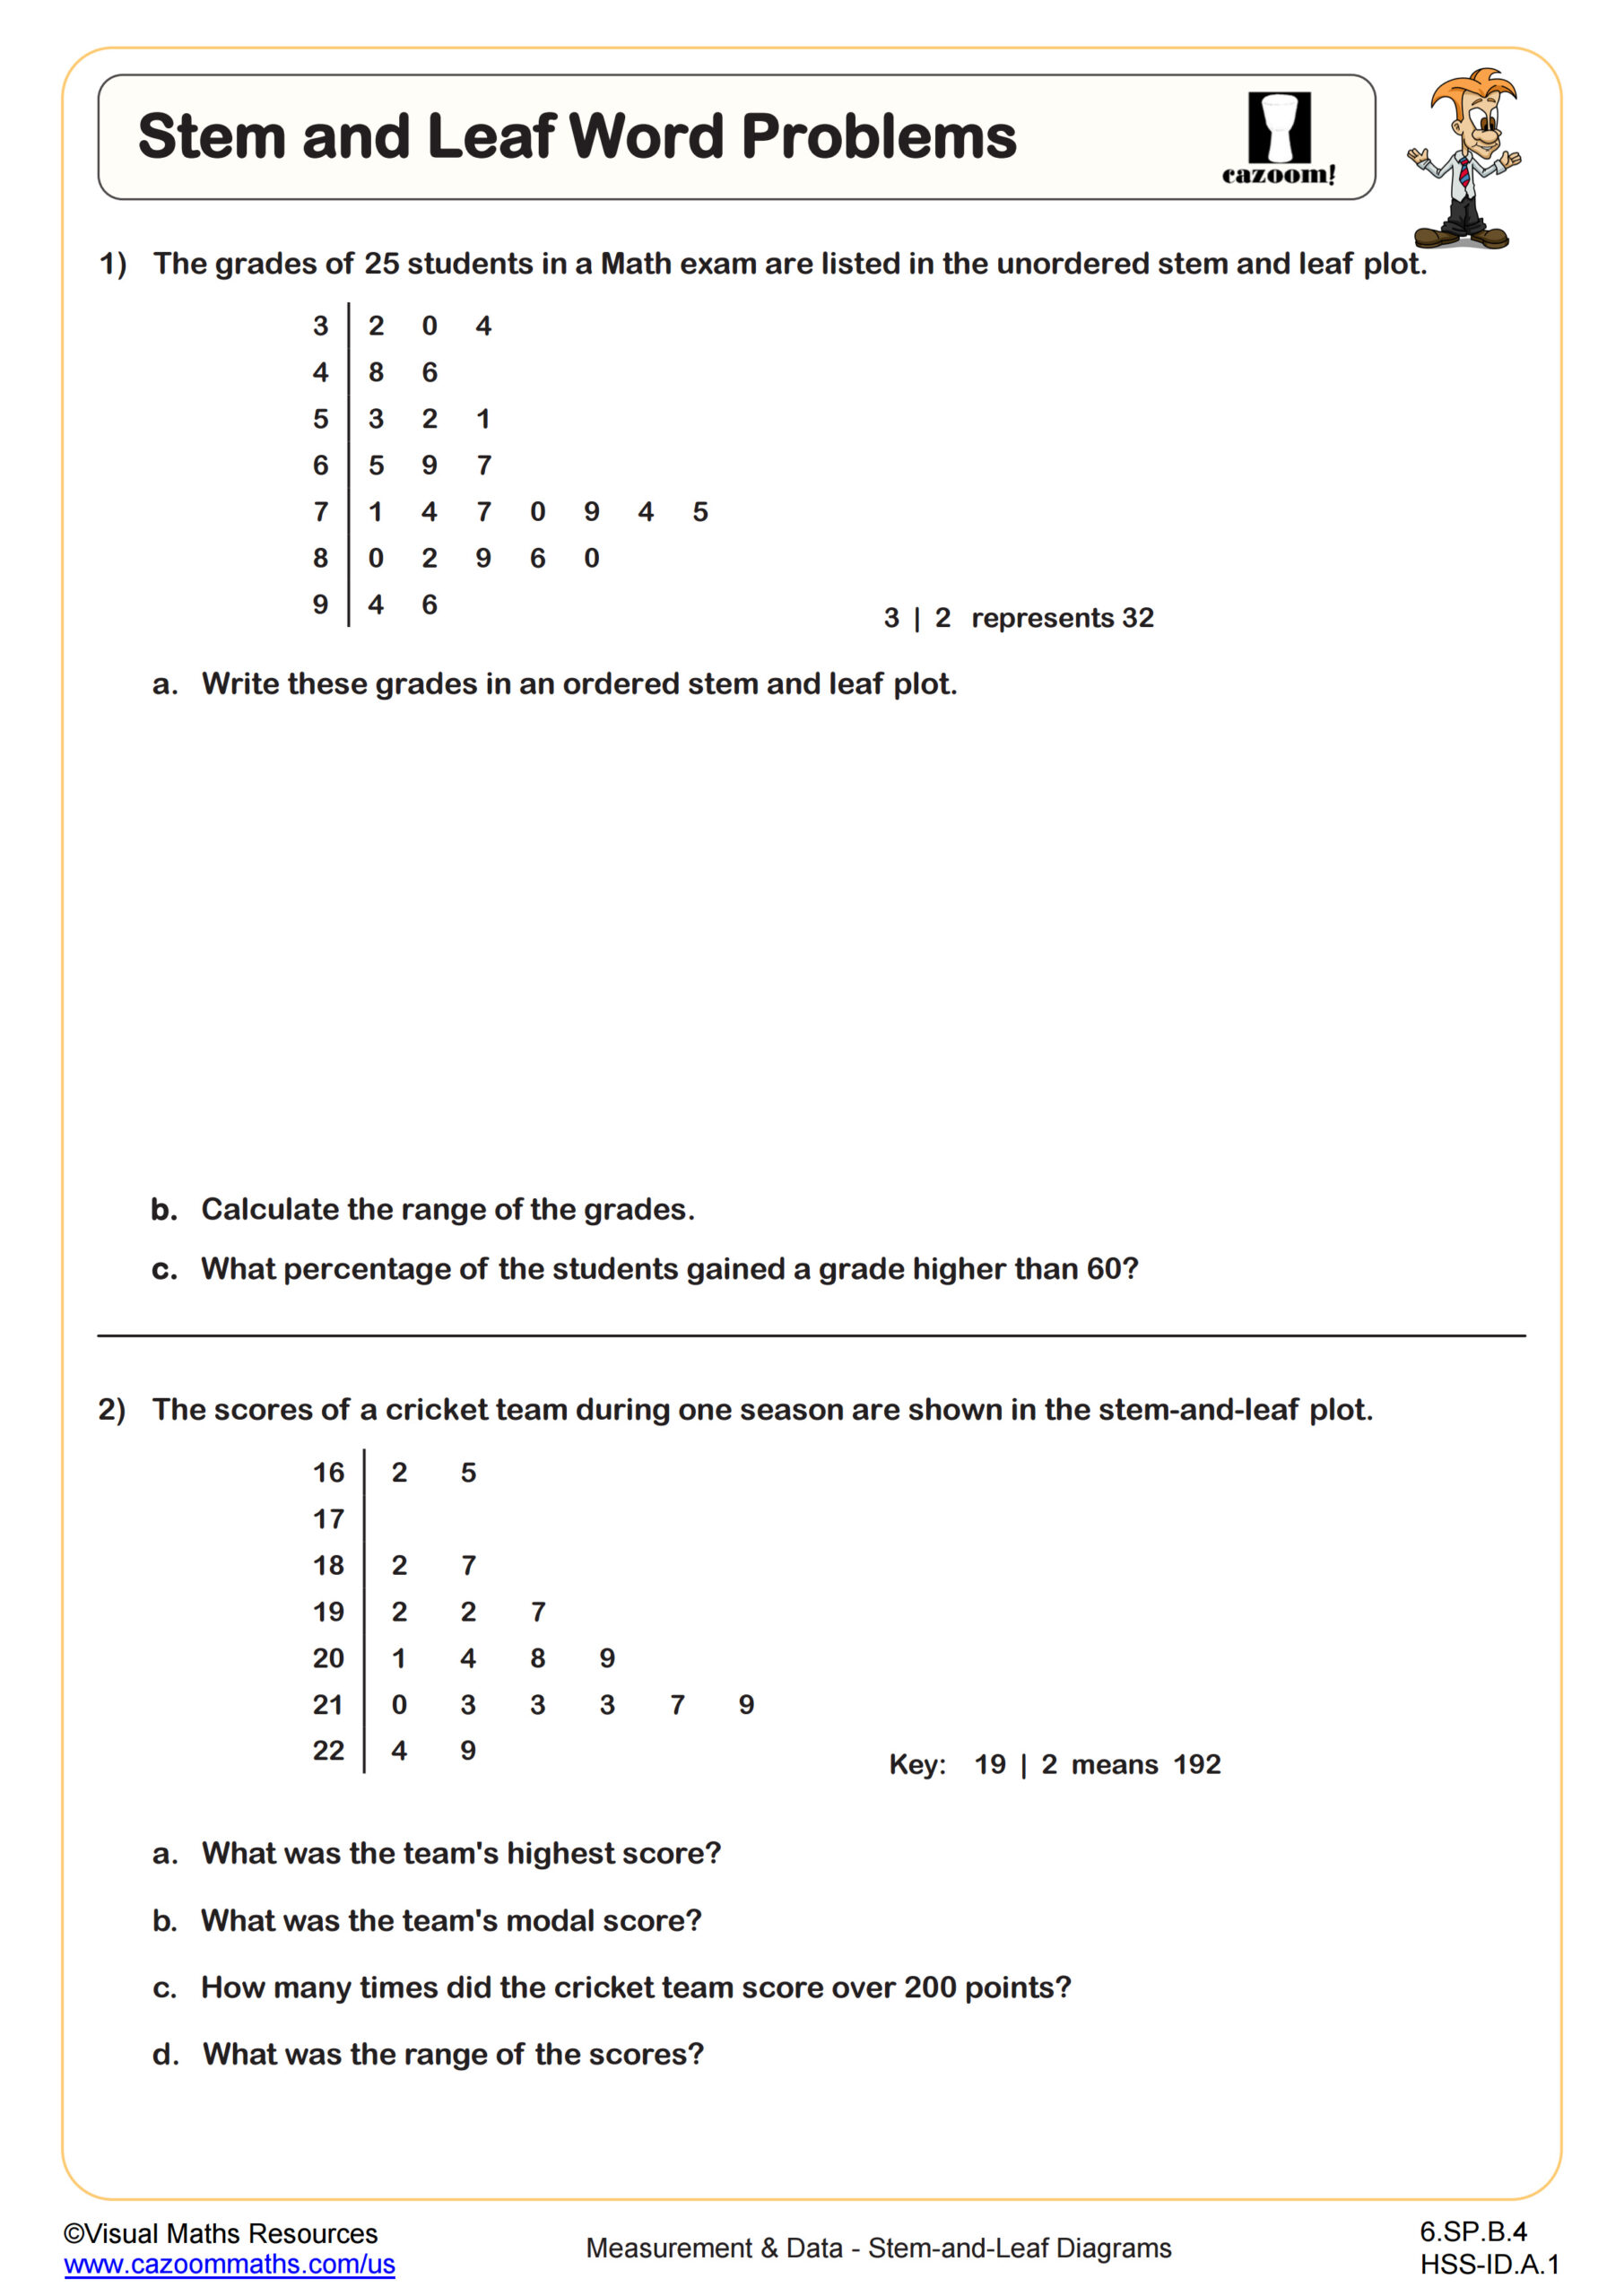
Use this worksheet after Stem and Leaf Plots (A) to provide more practice in the skill. Section A asks learners to read from two stem and leaf plots to find the range, mode, median, and mean. Section B asks learners to create stem and leaf diagrams for two sets of data. Sections C and D then require learners to create back-to-back stem and leaf plots, which can then be used to compare two sets of data.
All worksheets are created by the team of experienced teachers at Cazoom Math.
 Worksheet")
RELATED TO Stem and Leaf Plots (B) WORKSHEET
Frequently Asked Questions
This stem and leaf plots (b) worksheet is designed for students in 6th Grade and Geometry and aligns with Common Core State Standards.