2nd Grade Pie Charts and Bar Charts Worksheets
All worksheets are created by the team of experienced teachers at Cazoom Math.
What Should 2nd Graders Know About Reading Graphs?
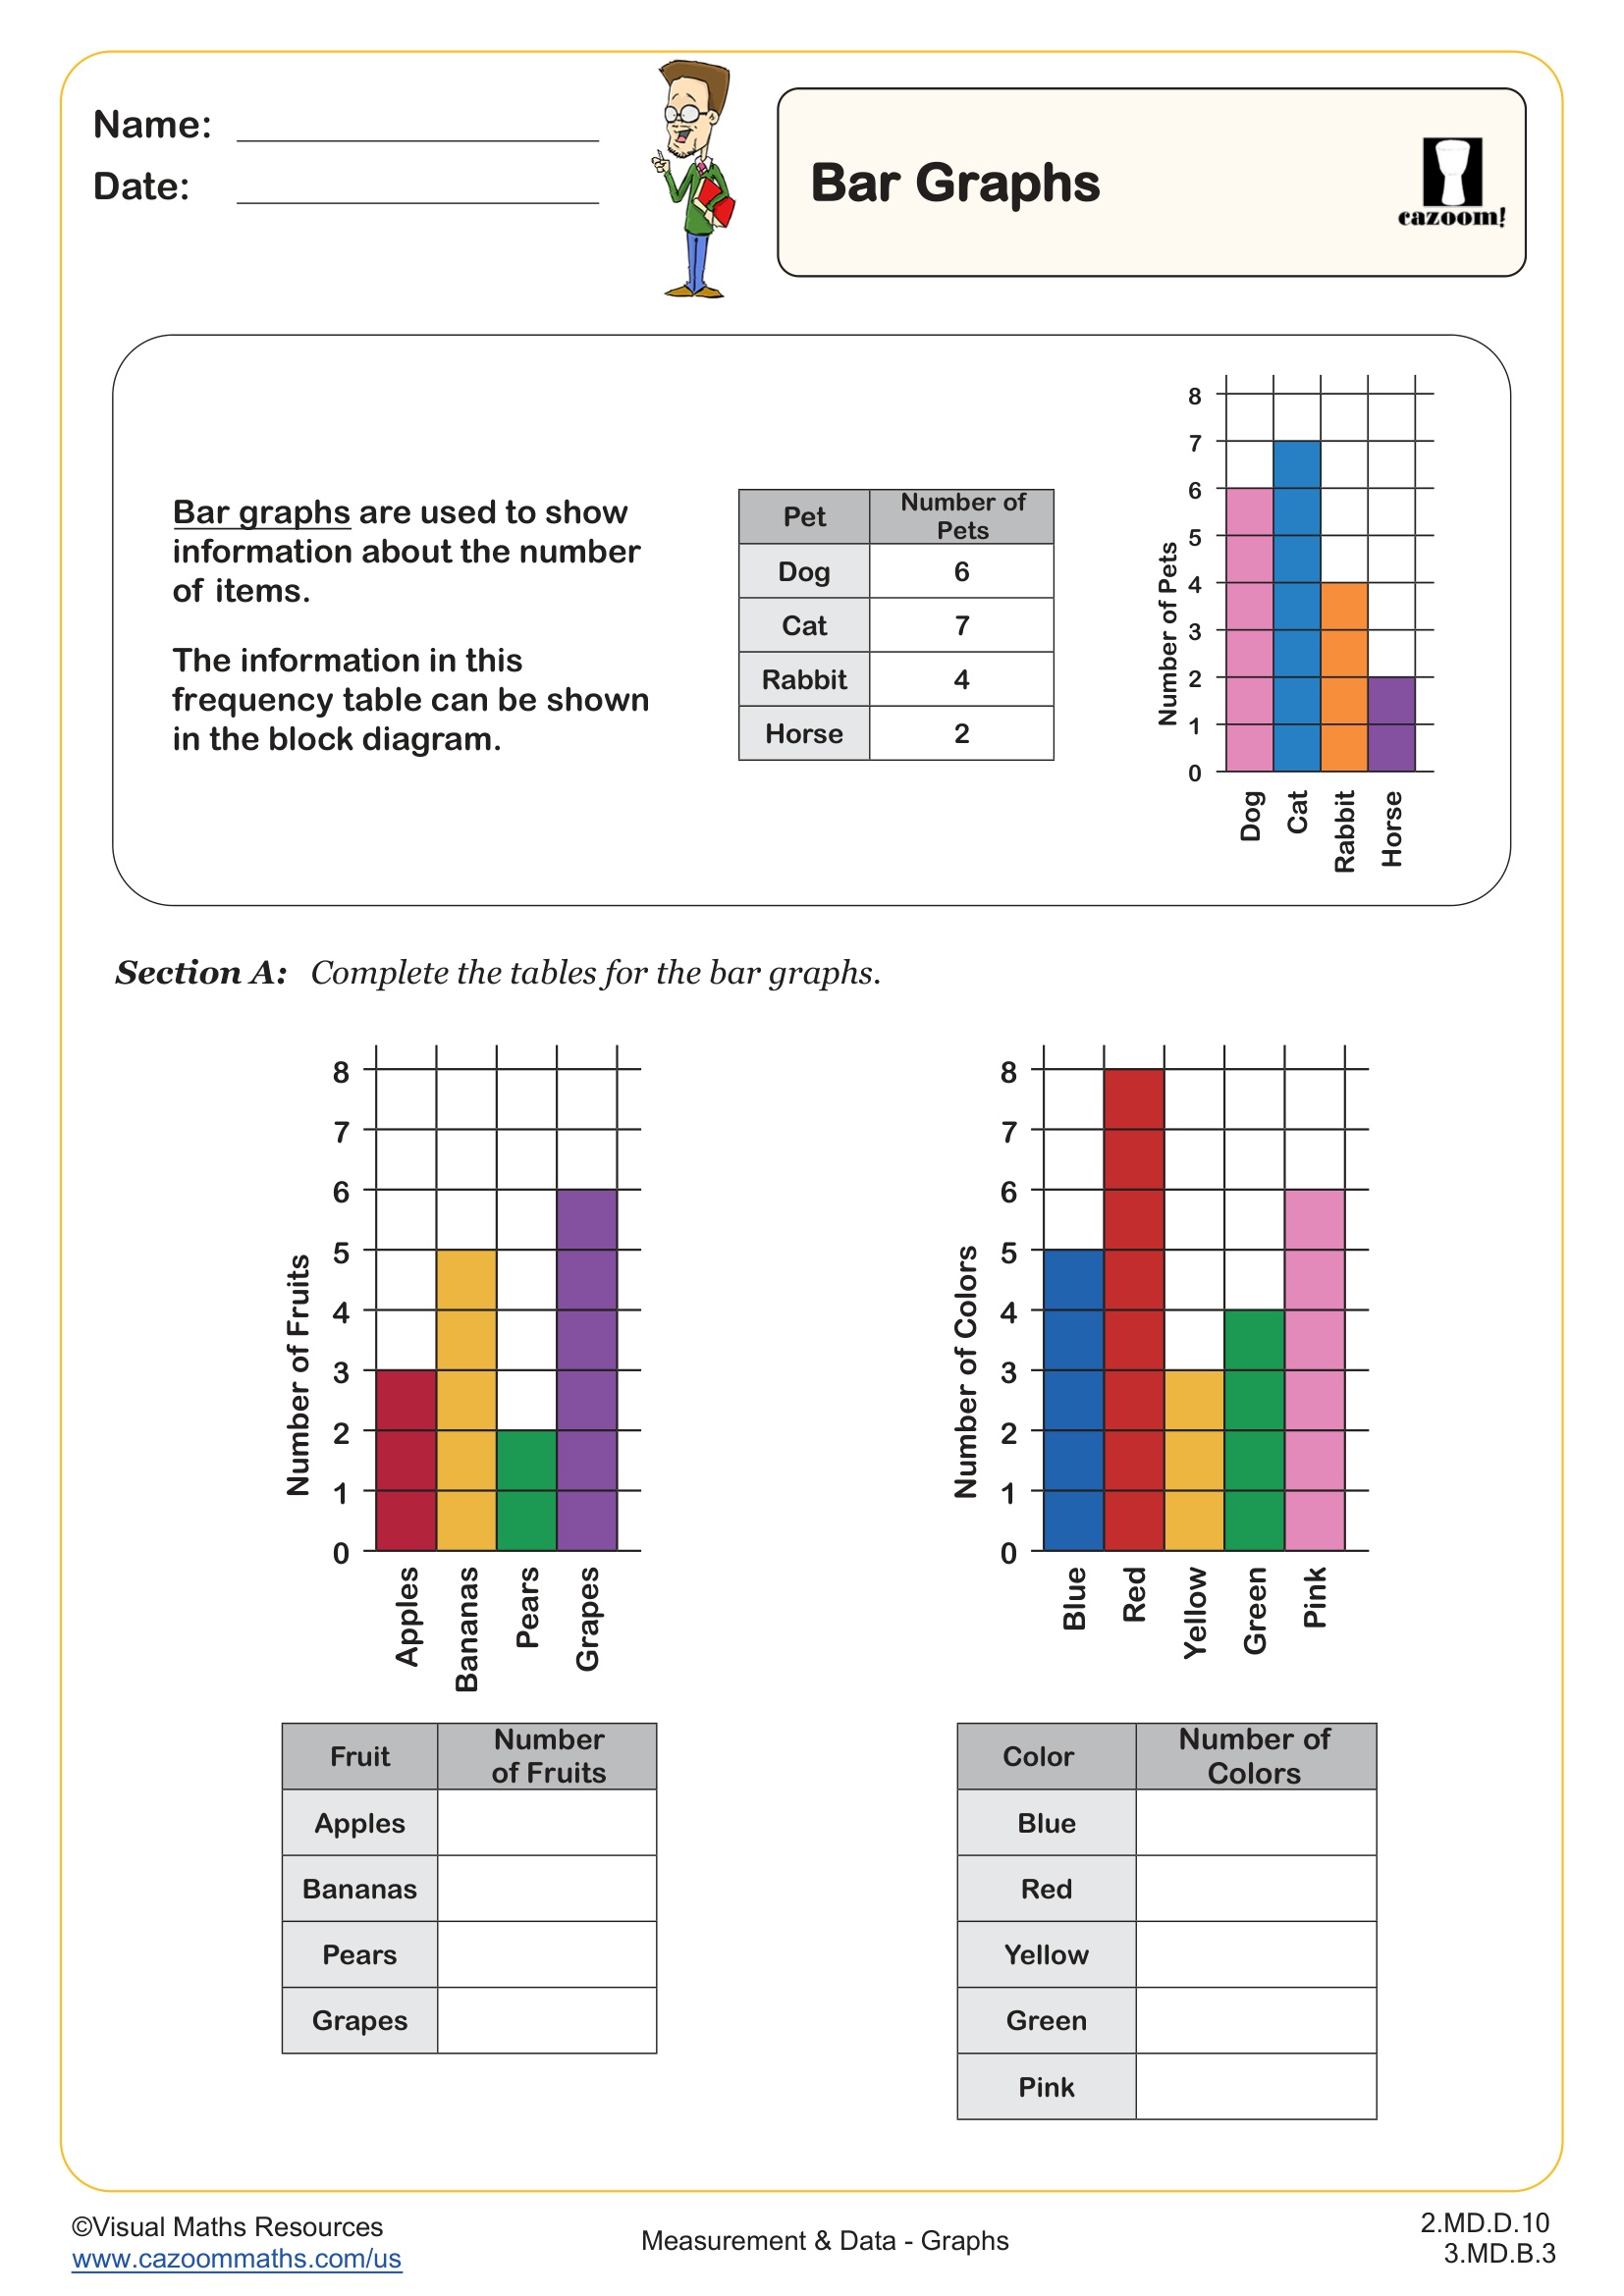
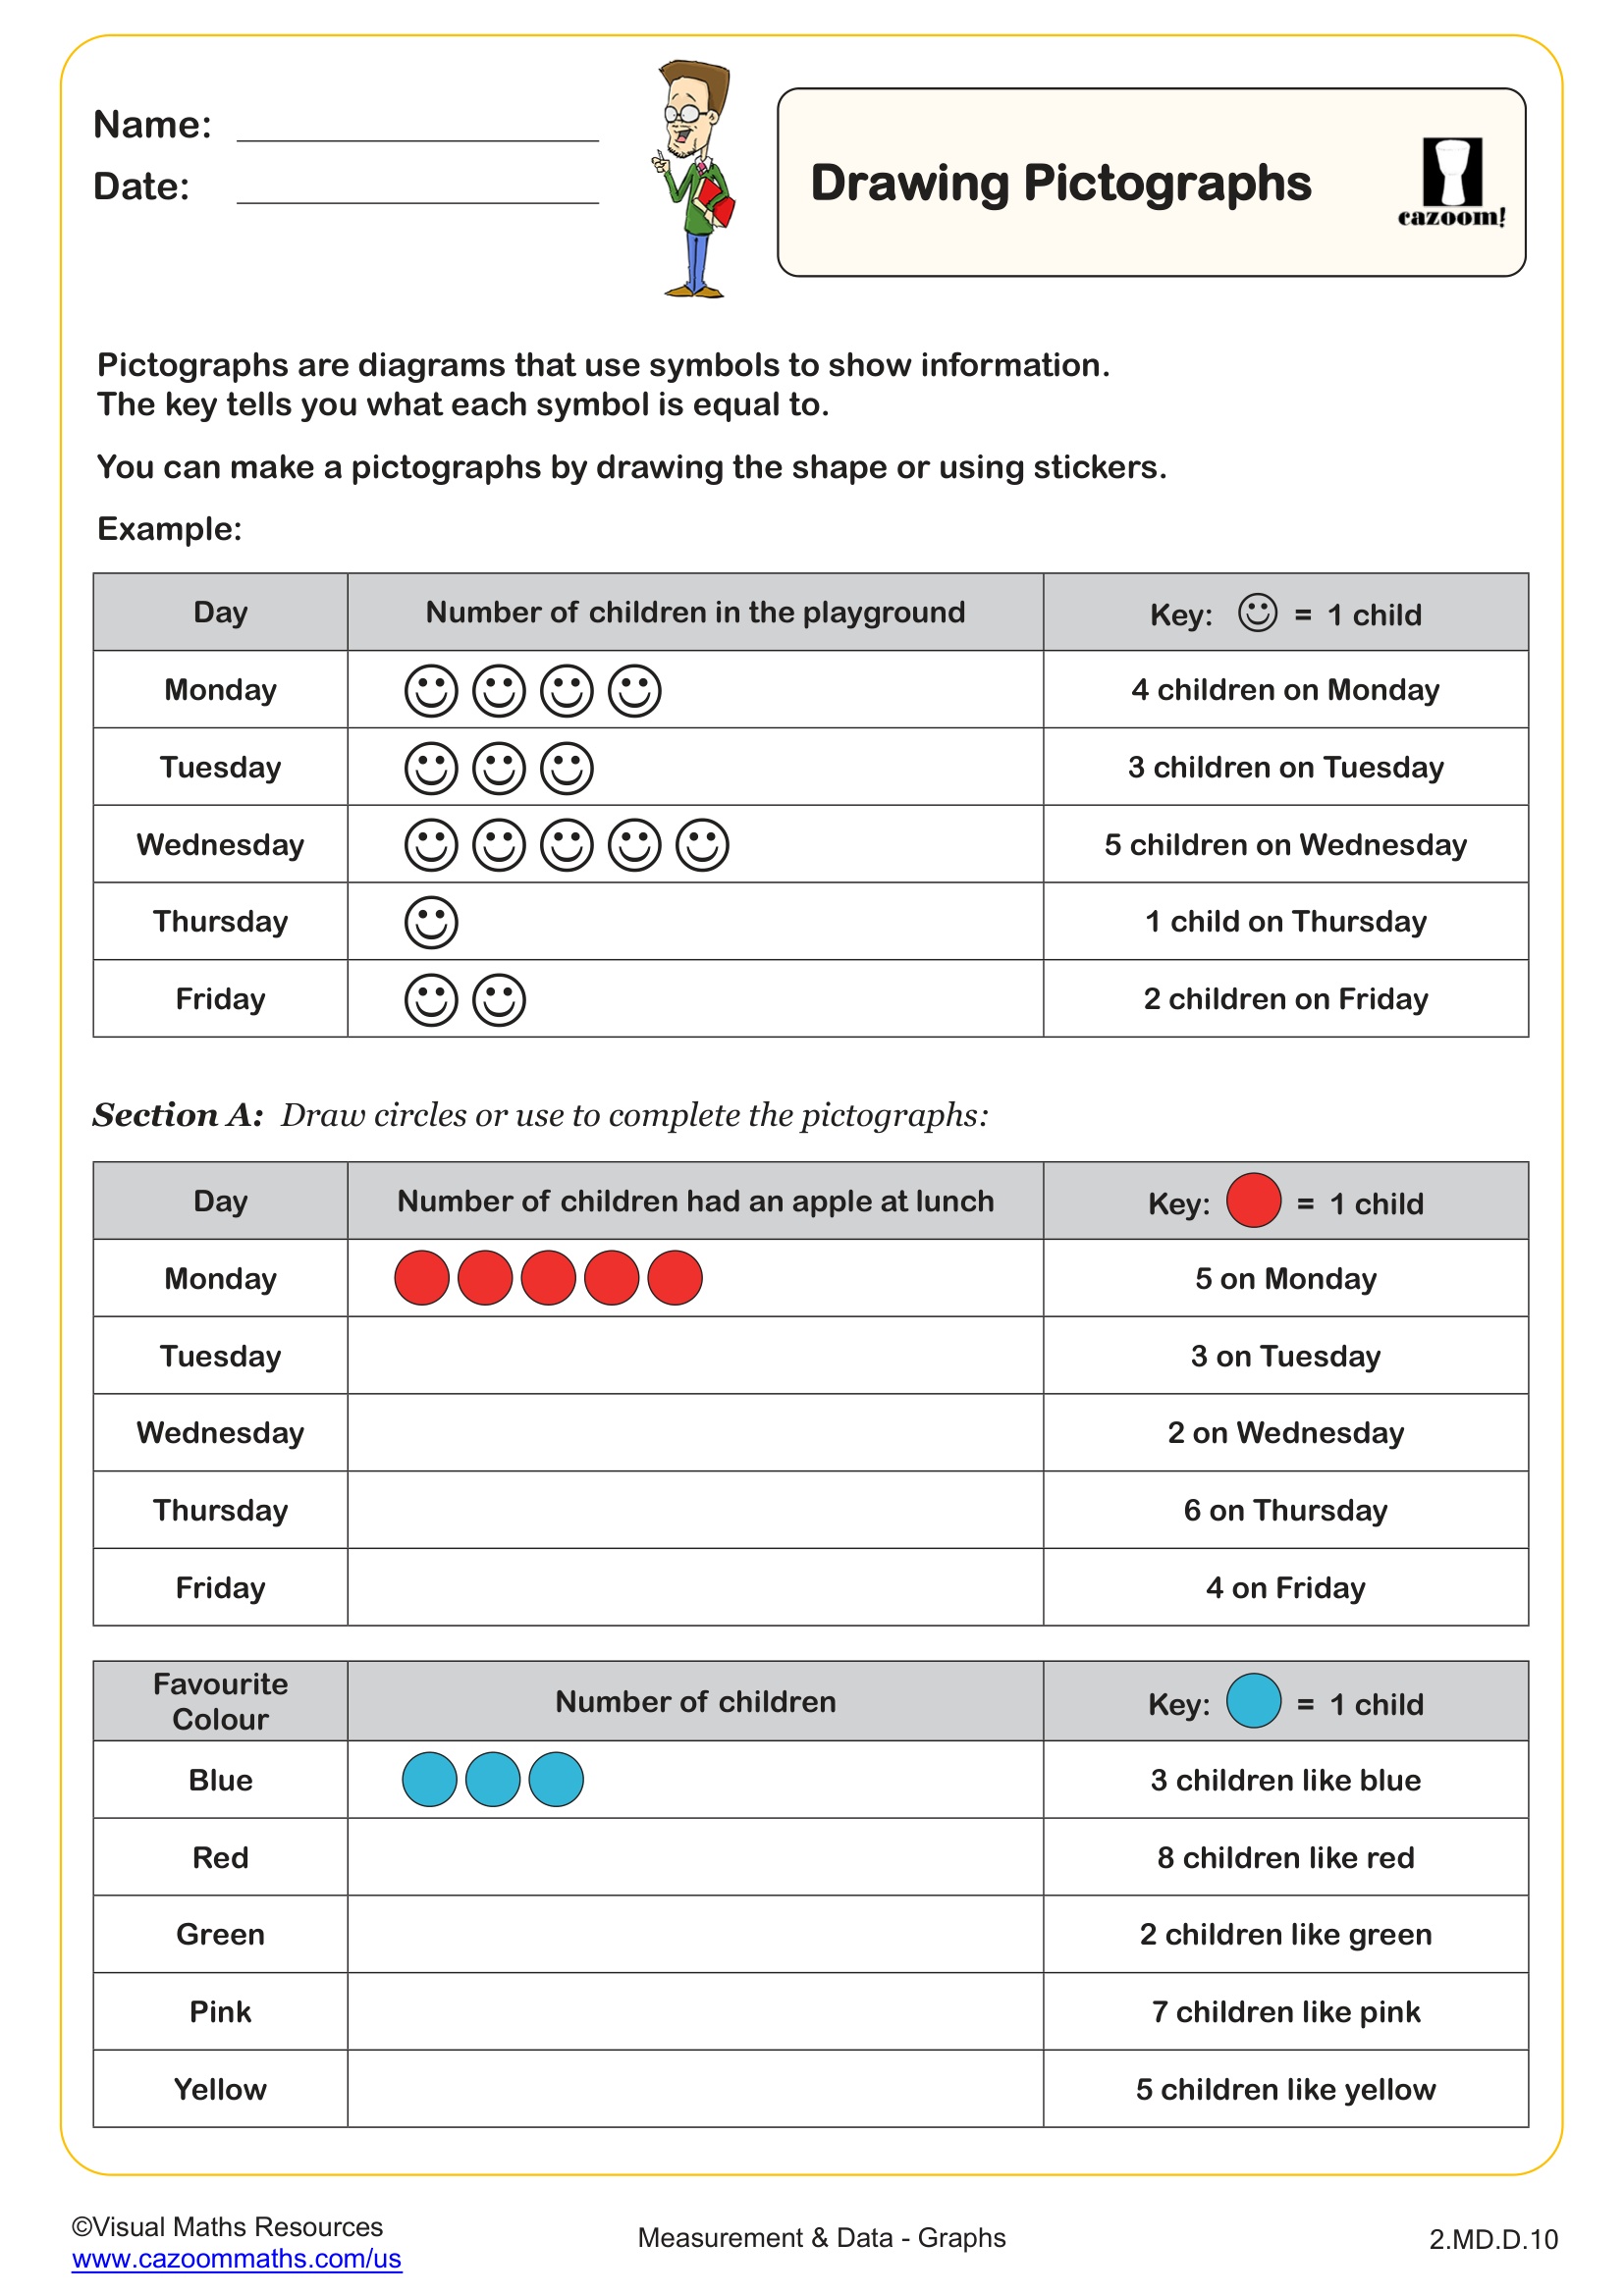
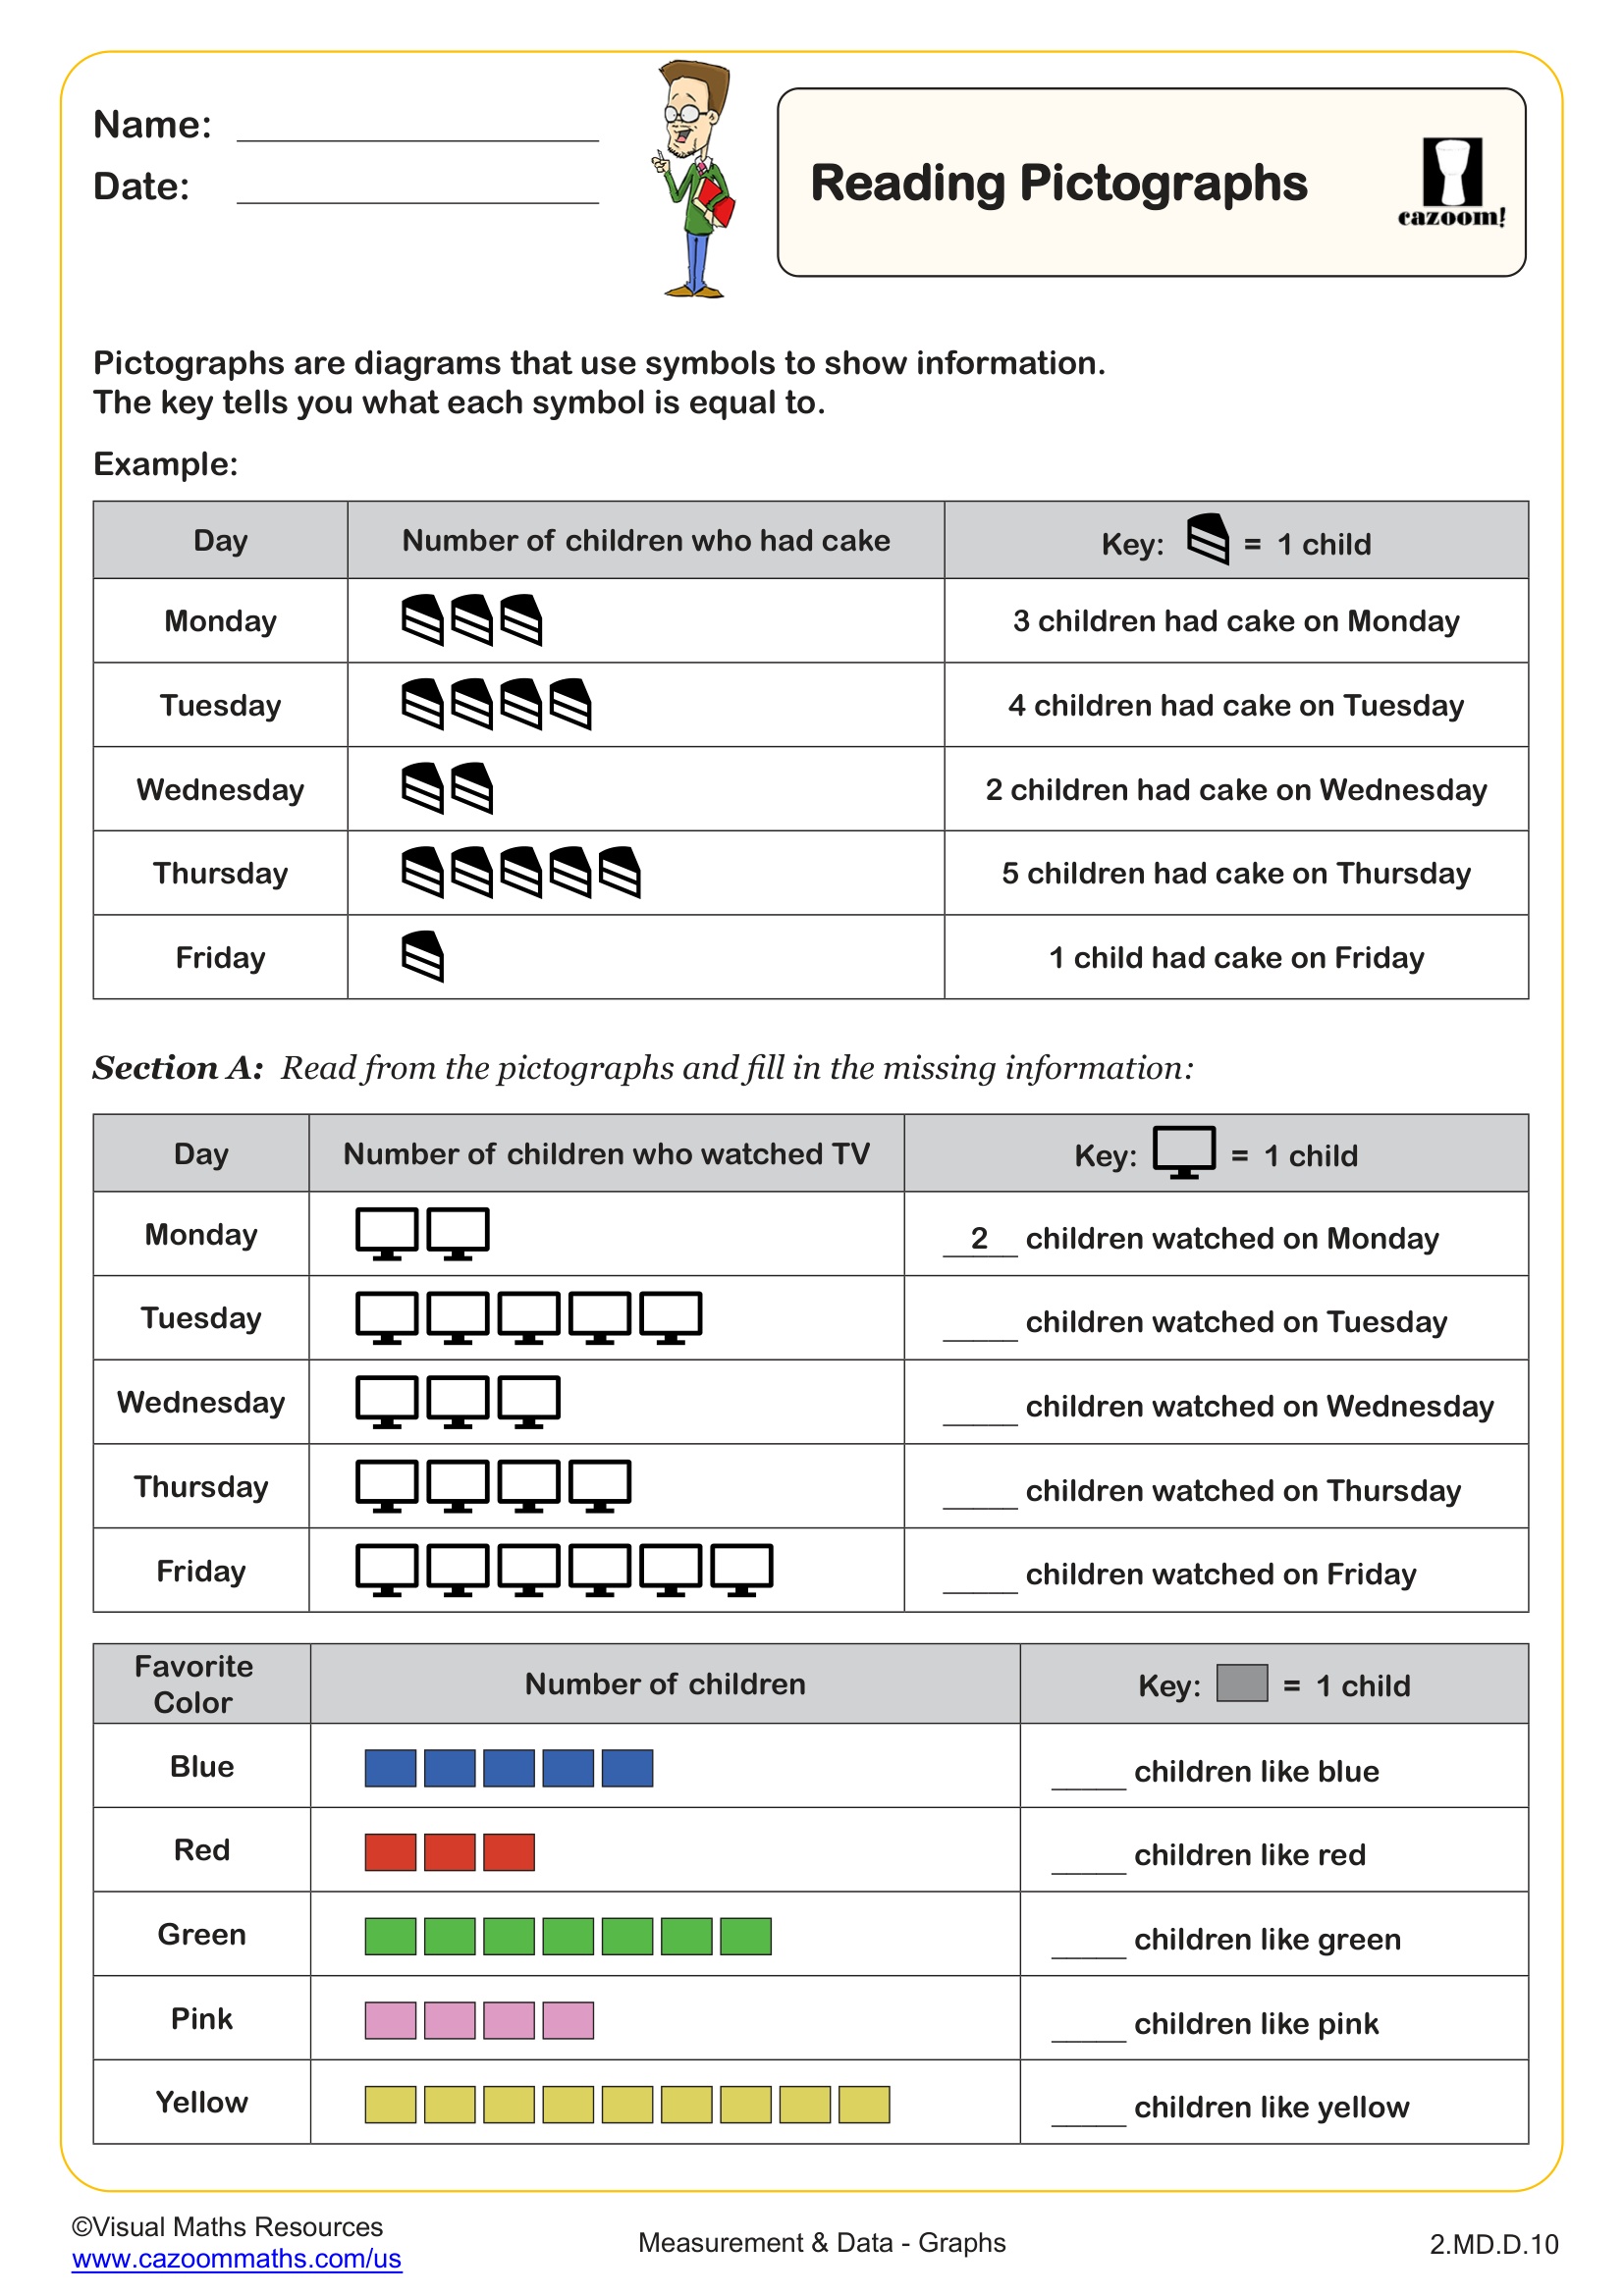
Second grade students should read simple bar graphs and pictographs with single-unit scales, interpret the data shown, and answer questions about comparisons like "which category has more" or "how many total." The Common Core State Standards introduce data representation at this level, focusing on measurement data and categorical information students can relate to their daily experiences.
Students frequently make errors when the graph's title or labels use unfamiliar vocabulary, causing them to misread what the data actually shows. For example, a graph about "favorite seasons" confuses students who focus only on bar heights without understanding what "season" means in context. Teachers find that discussing real graphs from school situations—lunch counts, weather tracking, or class surveys—builds the contextual understanding second graders need before tackling worksheet problems independently.
Which Grade Levels Use These Pie Charts and Bar Charts Worksheets?
This collection addresses 2nd grade content standards within elementary school. At this stage, students work with straightforward data displays where each visual unit represents one item, and categories remain simple enough for young learners to understand and compare without complex calculations or fractional interpretations.
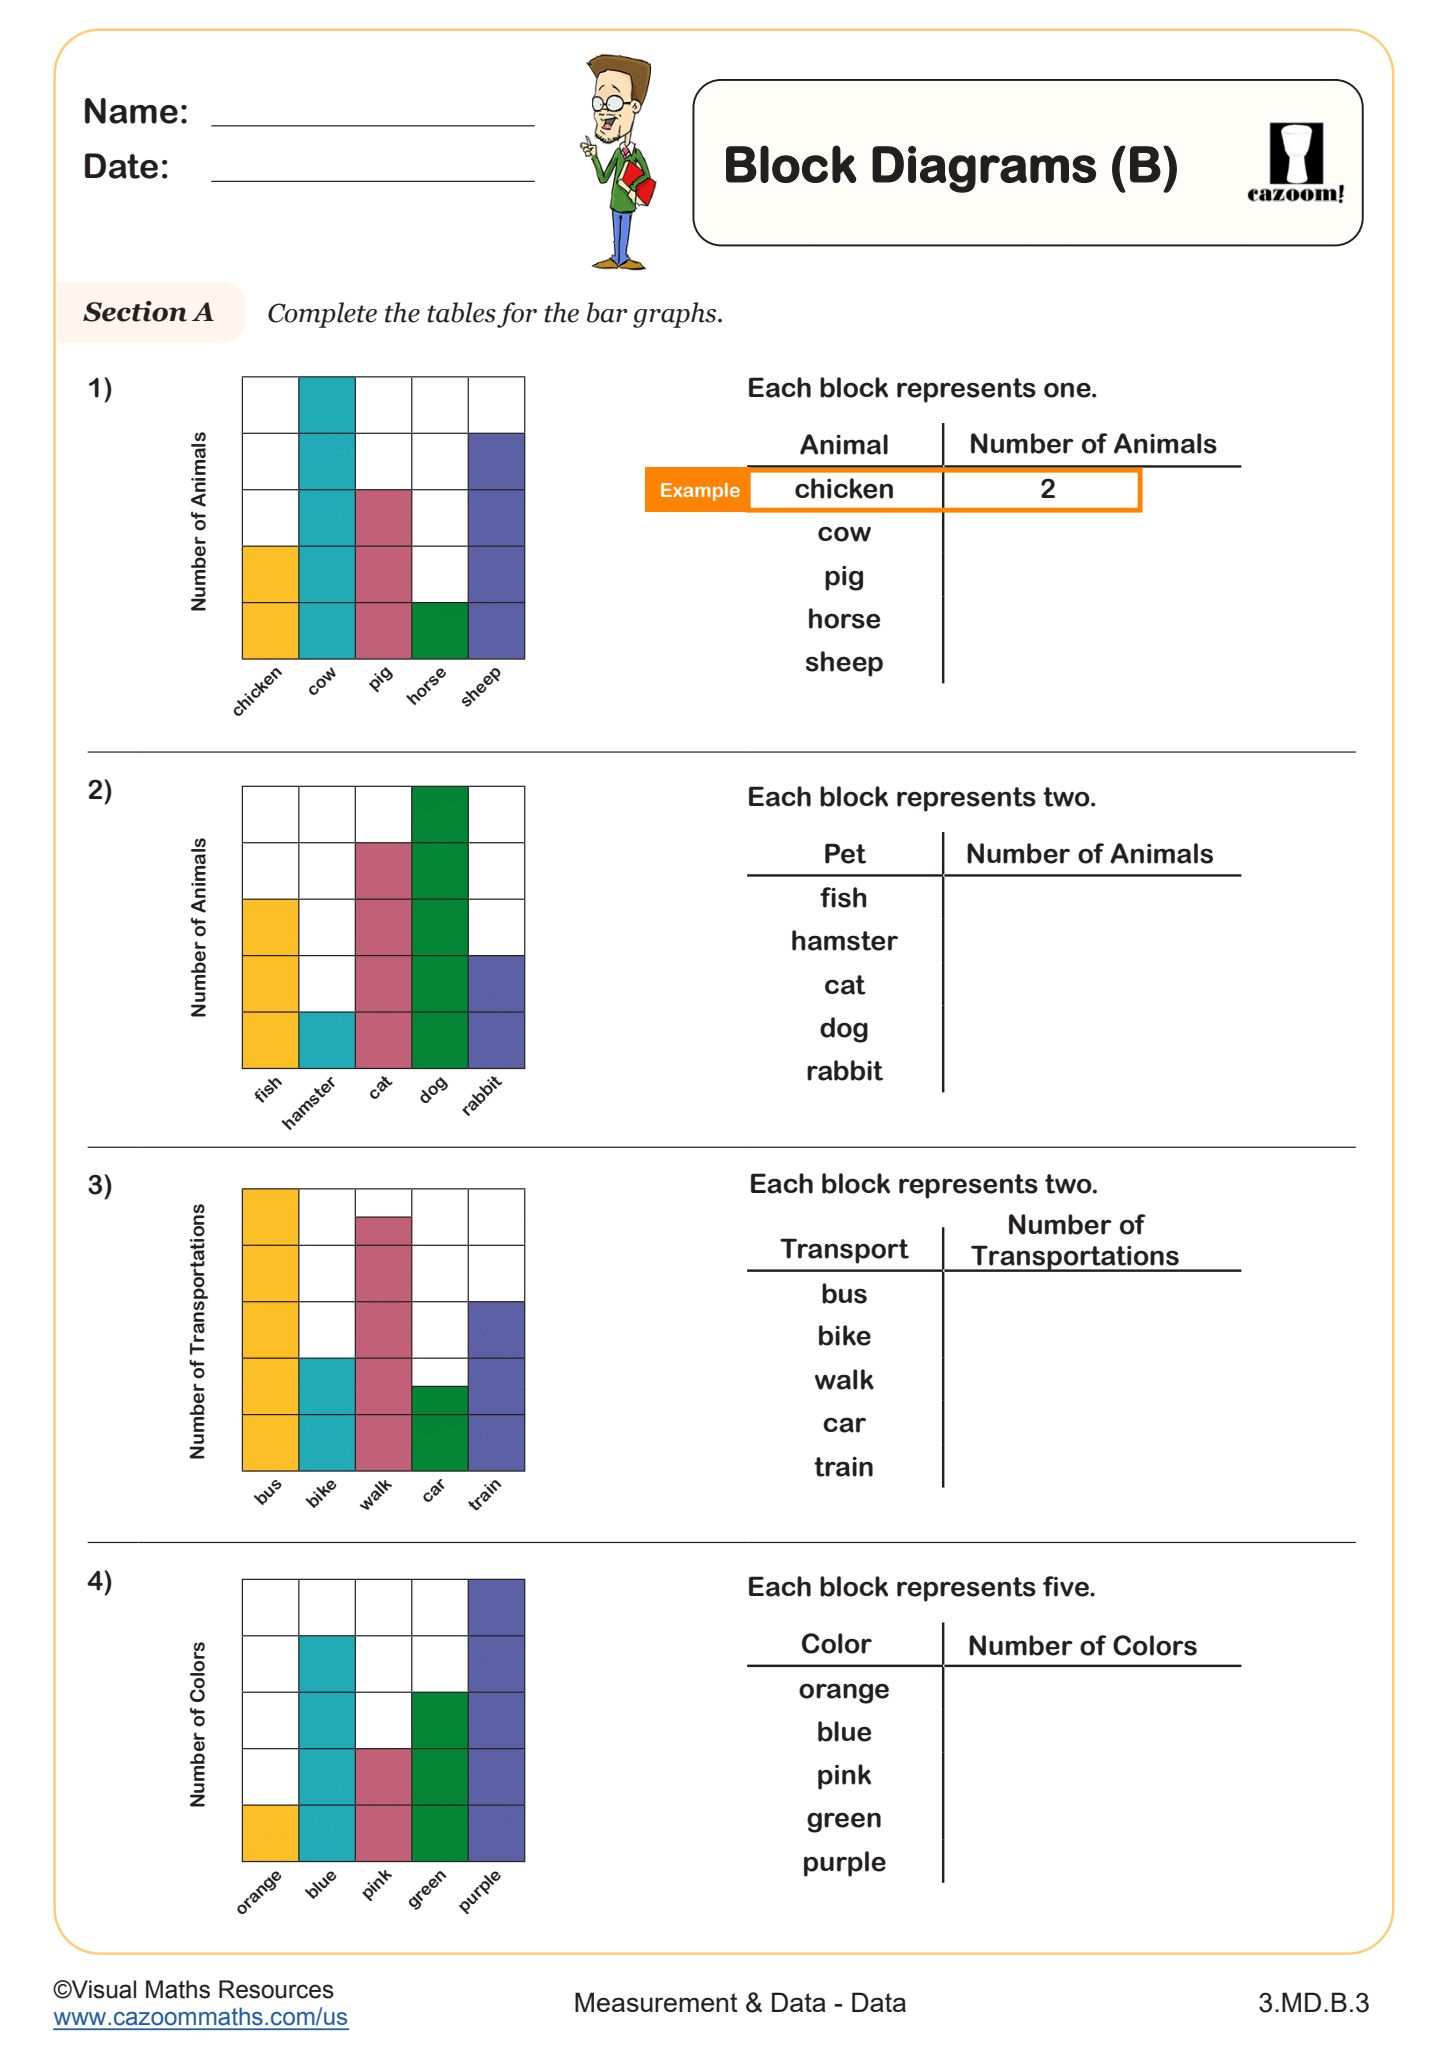
Second grade marks students' first formal introduction to data analysis beyond basic tallying. The worksheets progress from reading pre-made graphs with clear labels to more challenging tasks like choosing appropriate graph types for specific data situations. By the end of 2nd grade, students should confidently interpret bar graphs with scales up to 20 or 30 and recognize when block diagrams communicate information more clearly than other formats, preparing them for scaled graphs and more sophisticated data work in 3rd grade.
How Do Students Learn to Choose the Best Graph Type?
Choosing the best graphical representation requires students to analyze what type of information needs communication and which format displays it most clearly. Second graders start recognizing that bar graphs work well for comparing categories (like favorite colors or pets), while simple pie charts show parts of a whole, and two-way tables organize information with two different attributes (such as boys versus girls and their activity preferences).
This decision-making skill connects directly to how scientists and engineers communicate research findings. When environmental scientists track which animals visit a nature preserve, they use bar graphs to compare species counts so viewers immediately see which animals appear most frequently. Students who practice matching data to appropriate graph types develop critical thinking skills that extend beyond math class, helping them evaluate charts in news articles, science reports, and even on product packaging throughout their lives.
How Can Teachers Use These Worksheets in the Classroom?
The worksheets provide structured practice with varied question types that build from simple graph reading to more complex tasks like producing two-way tables and evaluating which graph best fits specific data. Each problem set includes visual examples alongside questions, helping students connect abstract concepts to concrete representations. The included answer keys allow teachers to quickly check student work and identify patterns in misunderstandings across the class.
Many teachers use these worksheets during math centers, pairing students to discuss their graph interpretations before writing answers—this conversation often reveals misconceptions that silent independent work masks. The materials work equally well for homework assignments when families want structured practice, for intervention sessions with students who need additional support beyond whole-class instruction, or as quick formative assessments to gauge whether students are ready to move from reading graphs to creating their own data displays.