6th Grade Cumulative Frequency and Box Plots Worksheets
All worksheets are created by the team of experienced teachers at Cazoom Math.
Struggling With Measurement and Data Skills? 6th Grade Cazoom Math Printable Worksheets Offer the Fix
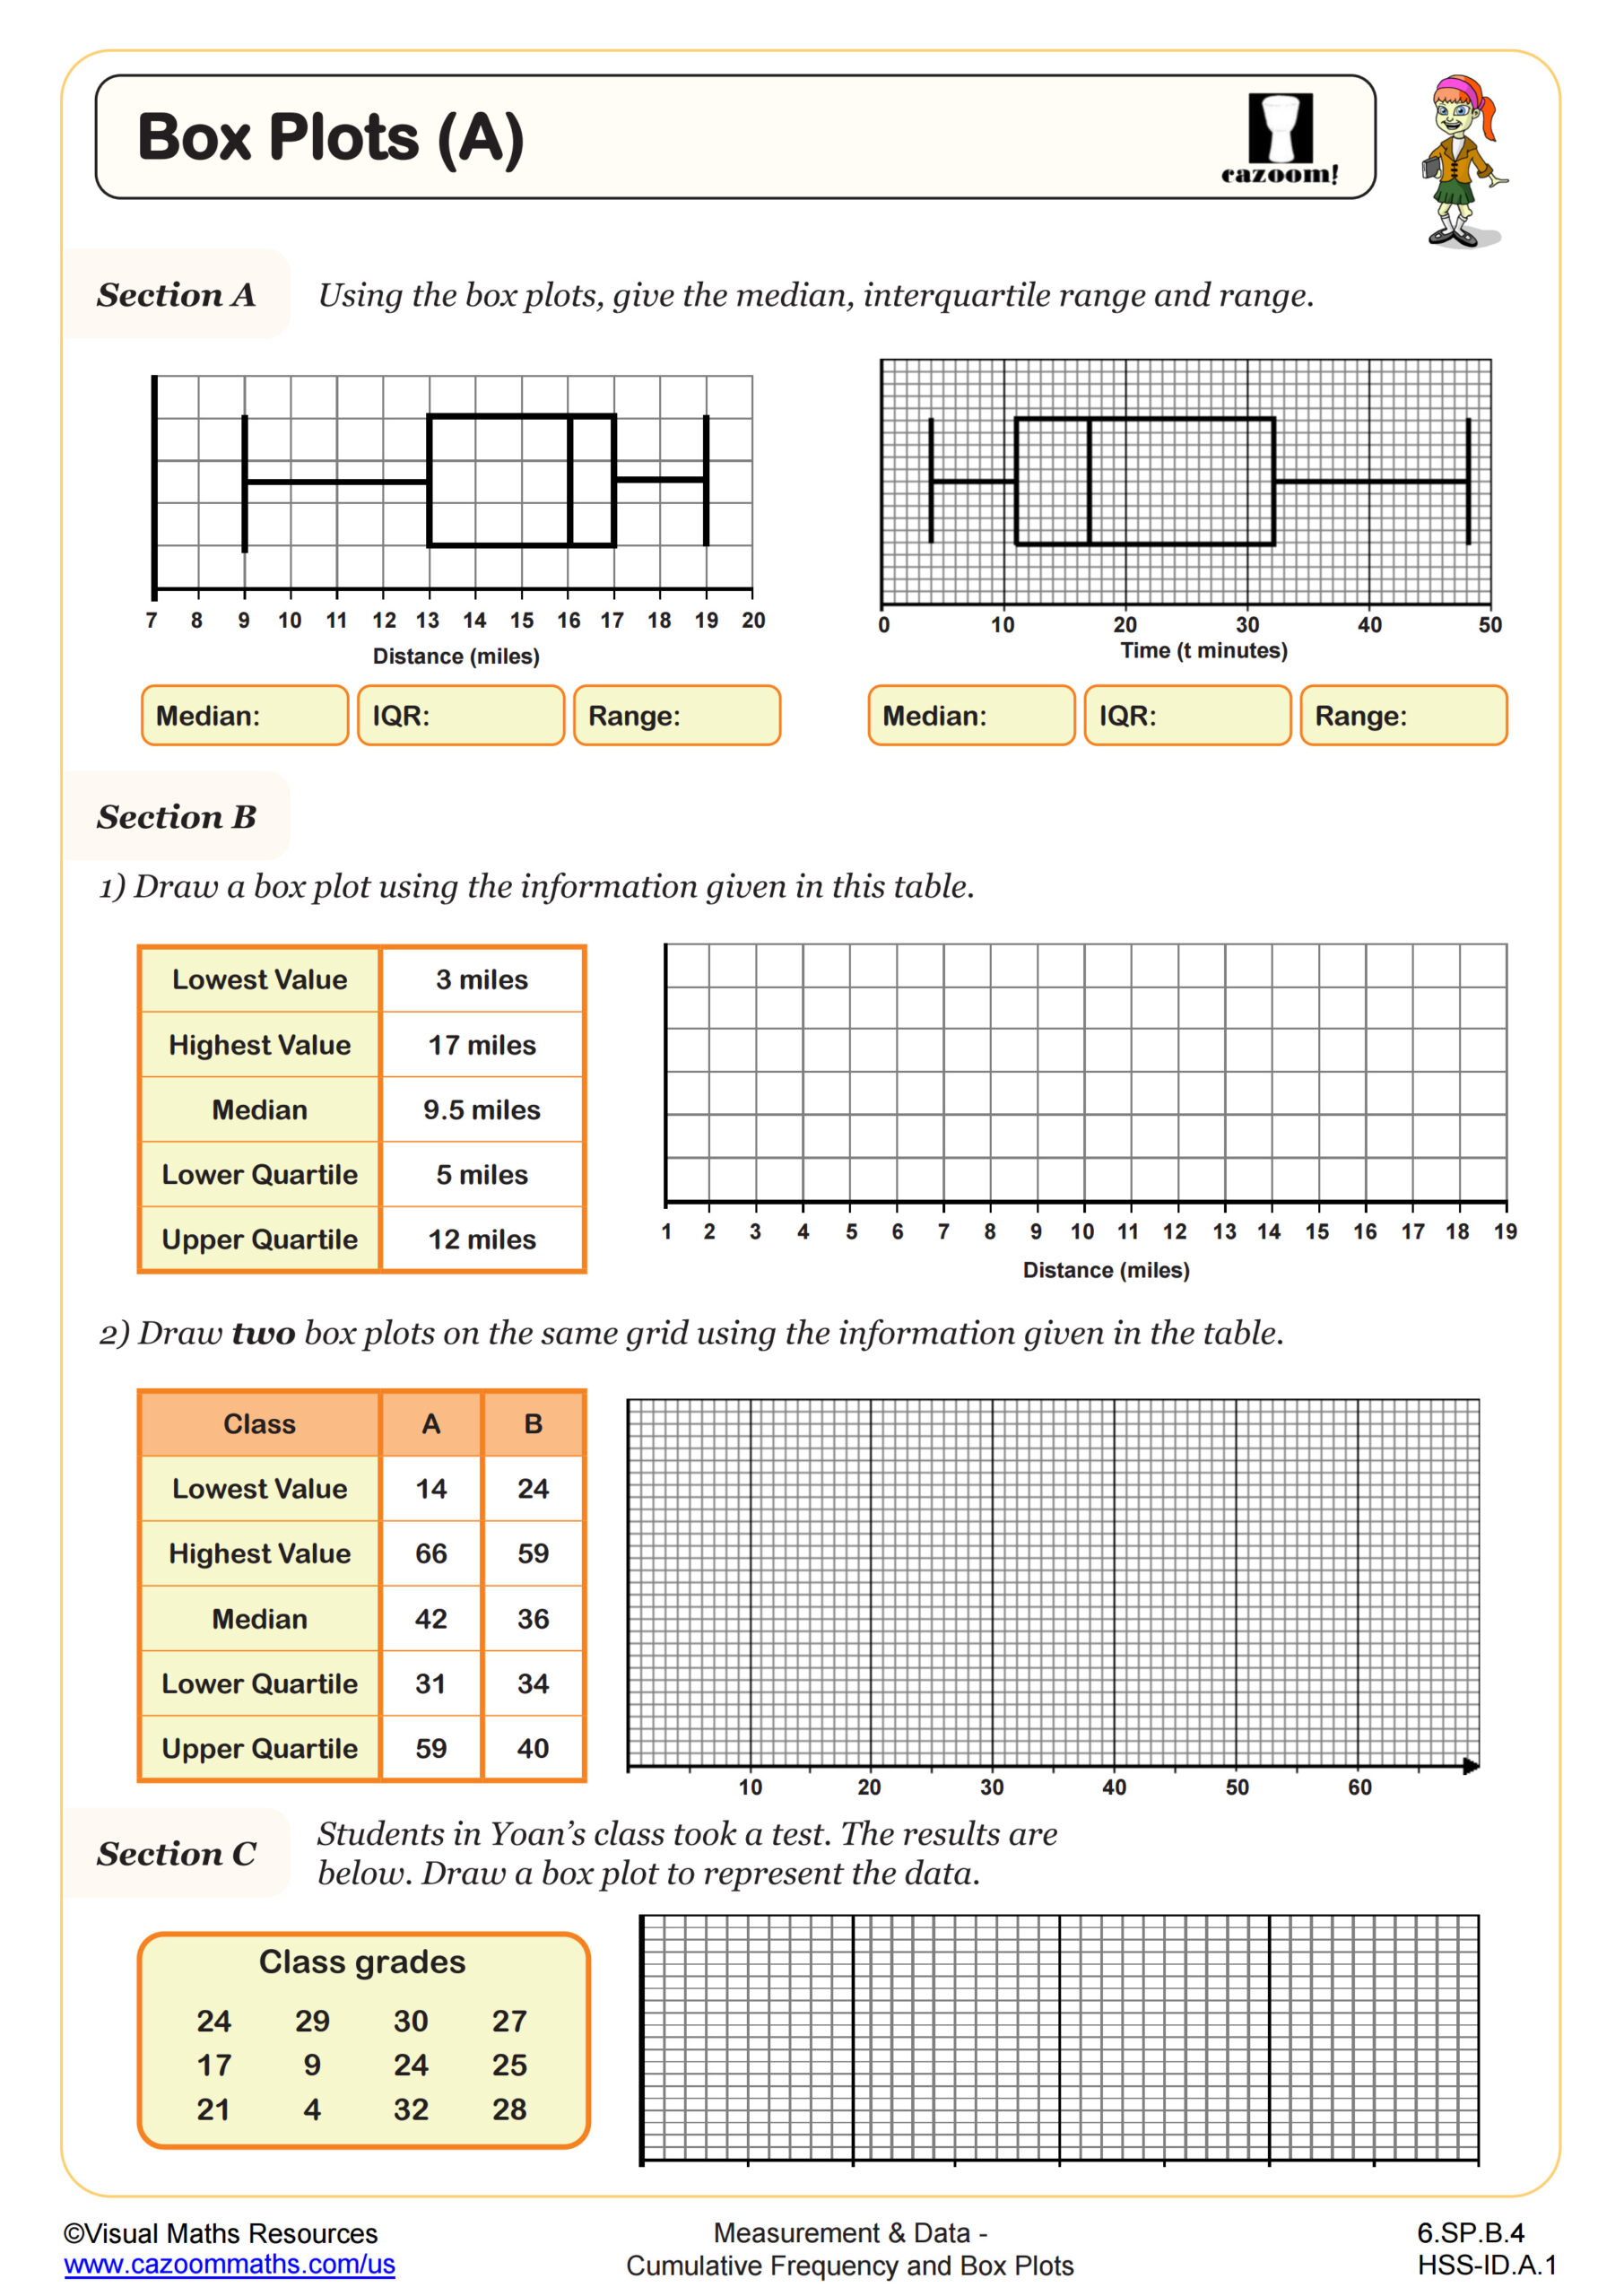
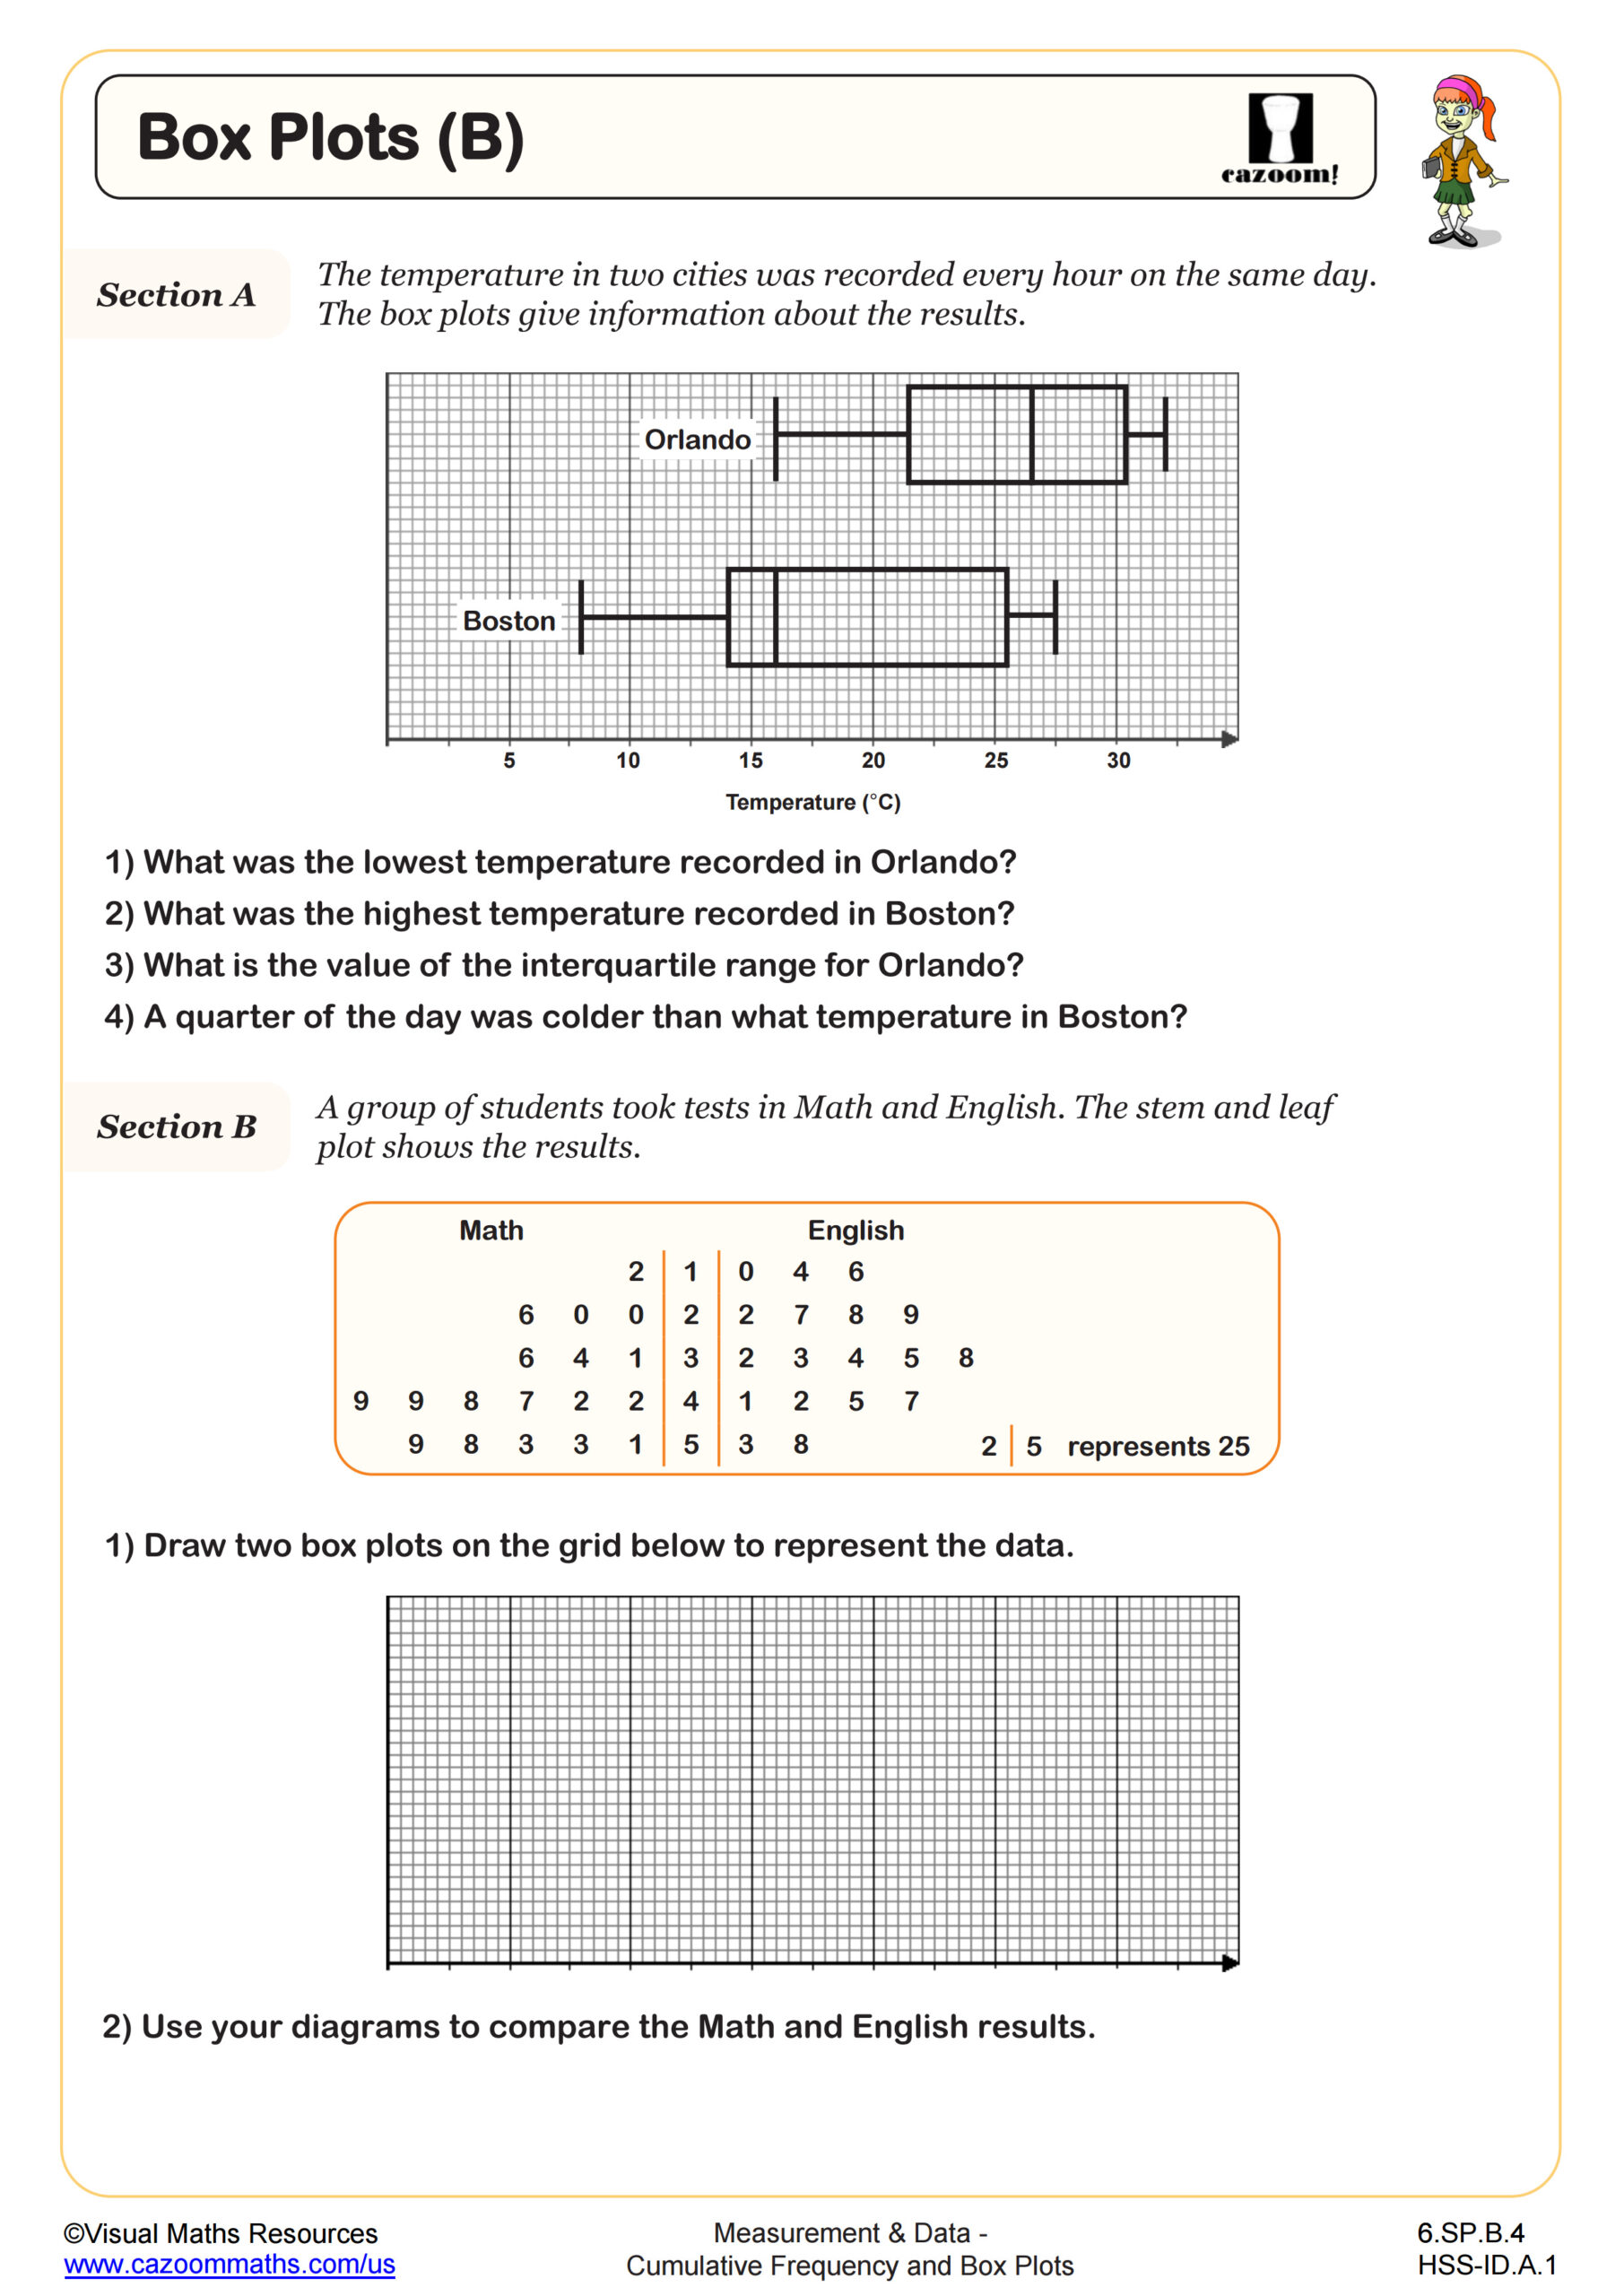
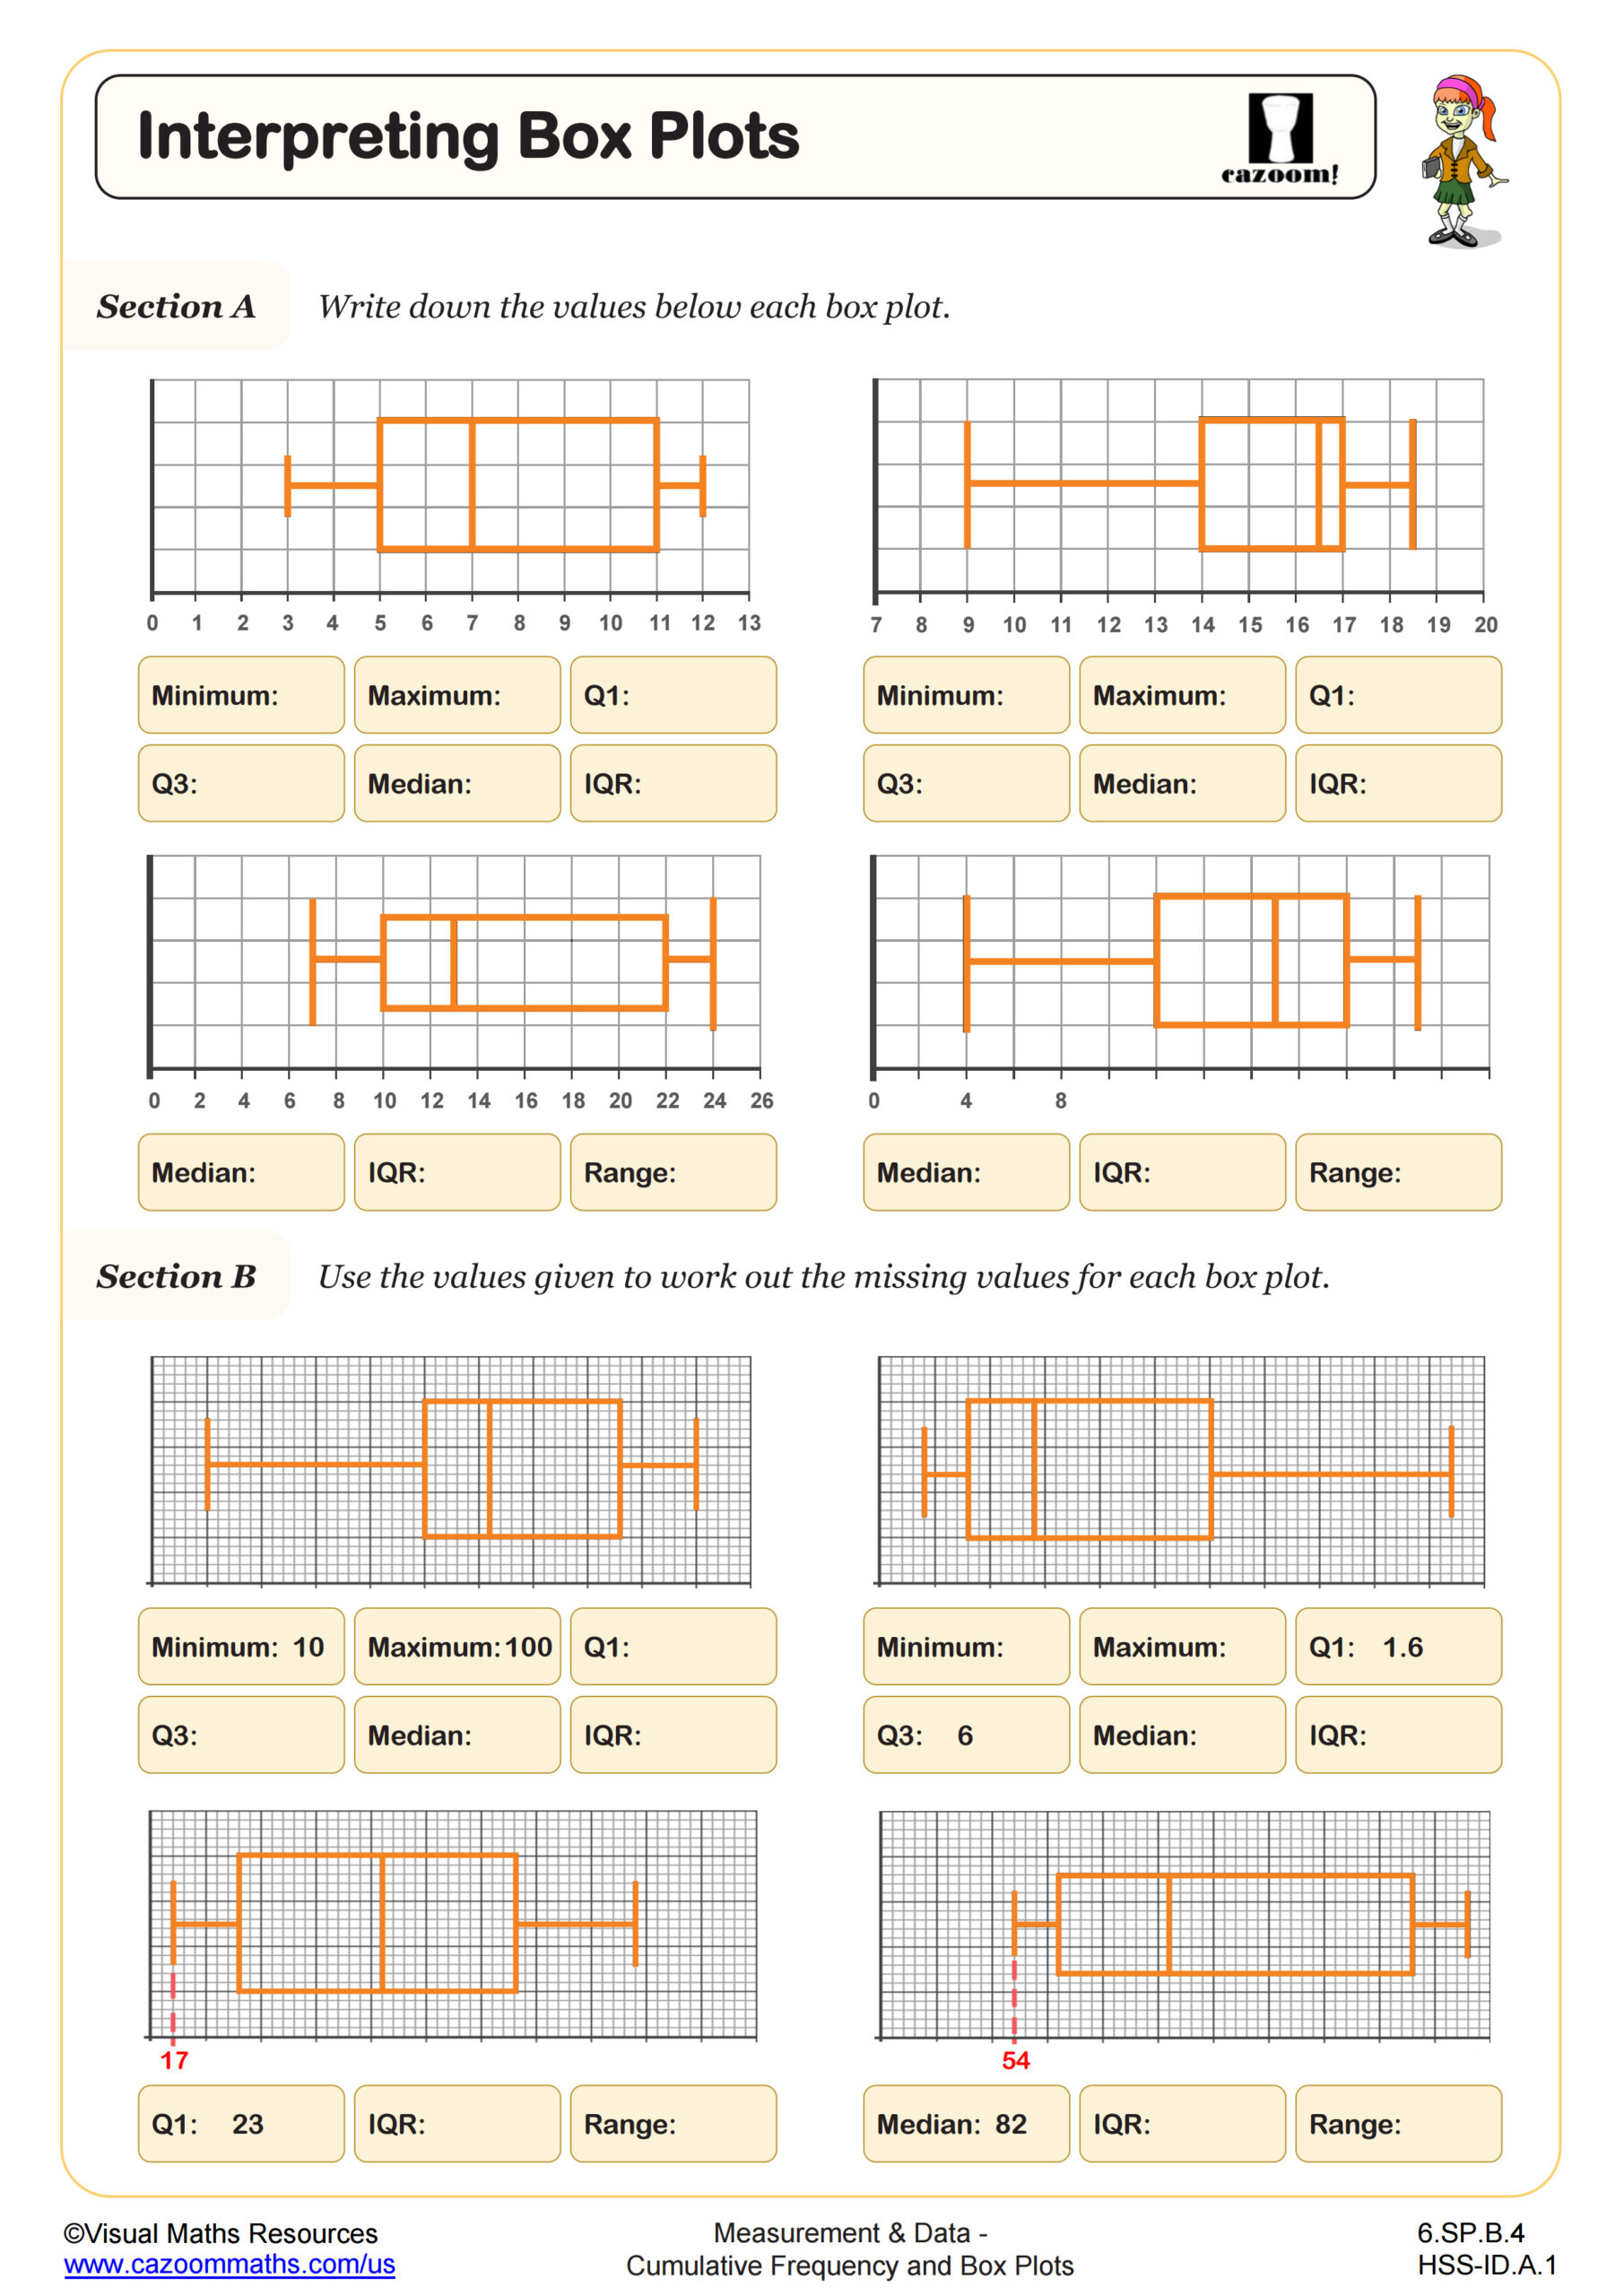
Box plots enable students to identify data patterns that standard numerical data cannot show. When students encounter a list of thirty test scores, the box plot instantly shows the middle 50% of results. The visual tool shows outliers and indicates if the data distribution leans towards higher or lower values.
The practice of these diagrams enables students to develop statistical thinking abilities, which will serve them well in their upcoming advanced courses. Learning about quartiles and interquartile range in school will help students grasp standard deviation when they encounter it in their future studies. High school lab students require training in reading box plots to properly understand scientific data.
Curriculum Alignment: What 6th Grade Statistics Worksheets Include for Complete Learning
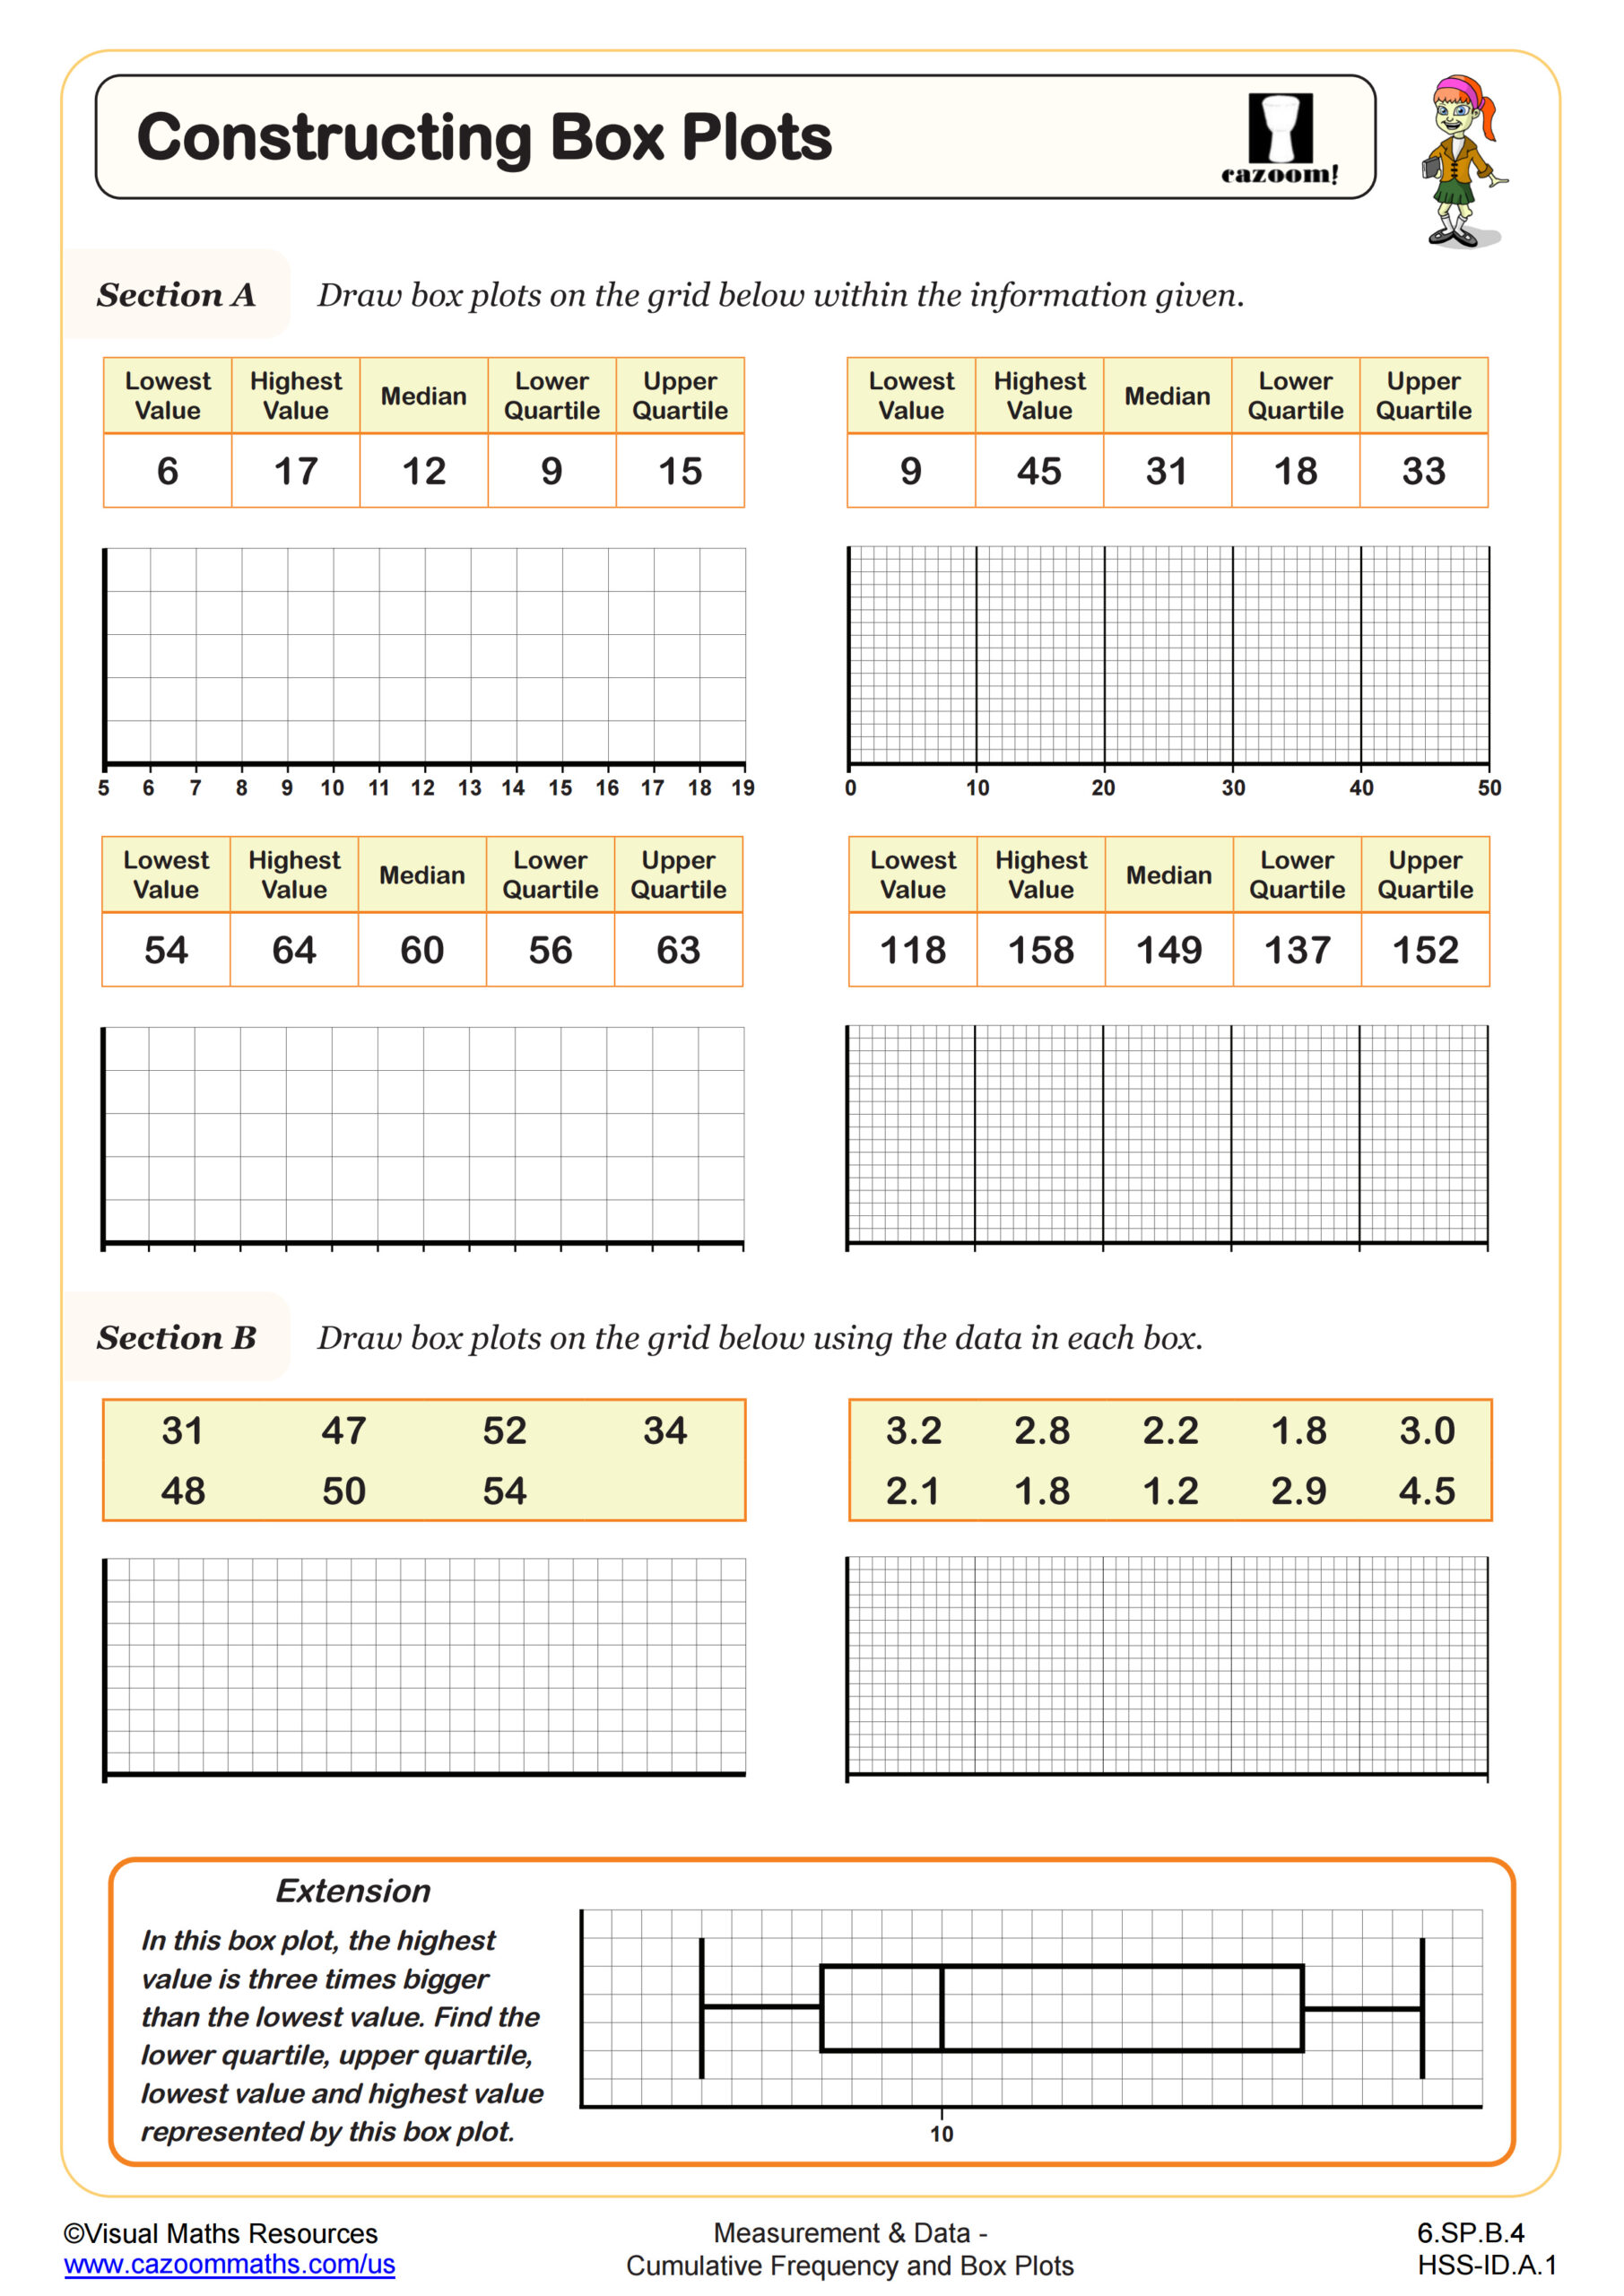
These worksheets guide students from real-world examples to confident interpretation of statistical diagrams. Learners begin by exploring familiar data contexts and visual representations before advancing to abstract ideas such as quartiles and interquartile range. Each worksheet provides detailed, step-by-step answer keys that demonstrate how to calculate key values and construct accurate box plots. Through progressive tasks, students develop strong data analysis, comparison, and interpretation skills essential for understanding variability and spread in statistics.
What Role Do Cumulative Frequency and Box Plots Activities Play in Developing Math Skills?
Teachers value the speed at which they can distribute suitable practice materials because it saves them from spending long hours on preparation. The worksheets offer natural differentiation with varying difficulty levels across the collection. Students either work on reading existing plots or create their own from the beginning. The extension questions present difficulties to advanced learners, but students who need more practice find help through the foundational problems.
The detailed solutions show the complete mathematical framework that leads to the solution of each step. Teachers save grading time since students can self-check using the comprehensive answer keys. The format works effectively for both classroom warm-up exercises and homework assignments, as well as for short formative assessment purposes. Many educators use these sheets for spiral review throughout the semester. The text maintains an organized structure, allowing students to focus on mathematical content rather than navigating various presentation methods.
Where Box Plot Skills Apply Beyond the Classroom
Students encounter box plots in science labs when comparing experimental results. Weather services display temperature variations using these five-number summaries. Medical researchers present patient data through box-and-whisker diagrams. Understanding these visual tools helps students interpret real data in news articles and research reports.
• Compare prices across stores and brands
• Analyze test scores for performance
• Track fitness or running data
• Examine sports statistics for teams