6th Grade Pie Charts and Bar Charts Worksheets
All worksheets are created by the team of experienced teachers at Cazoom Math.
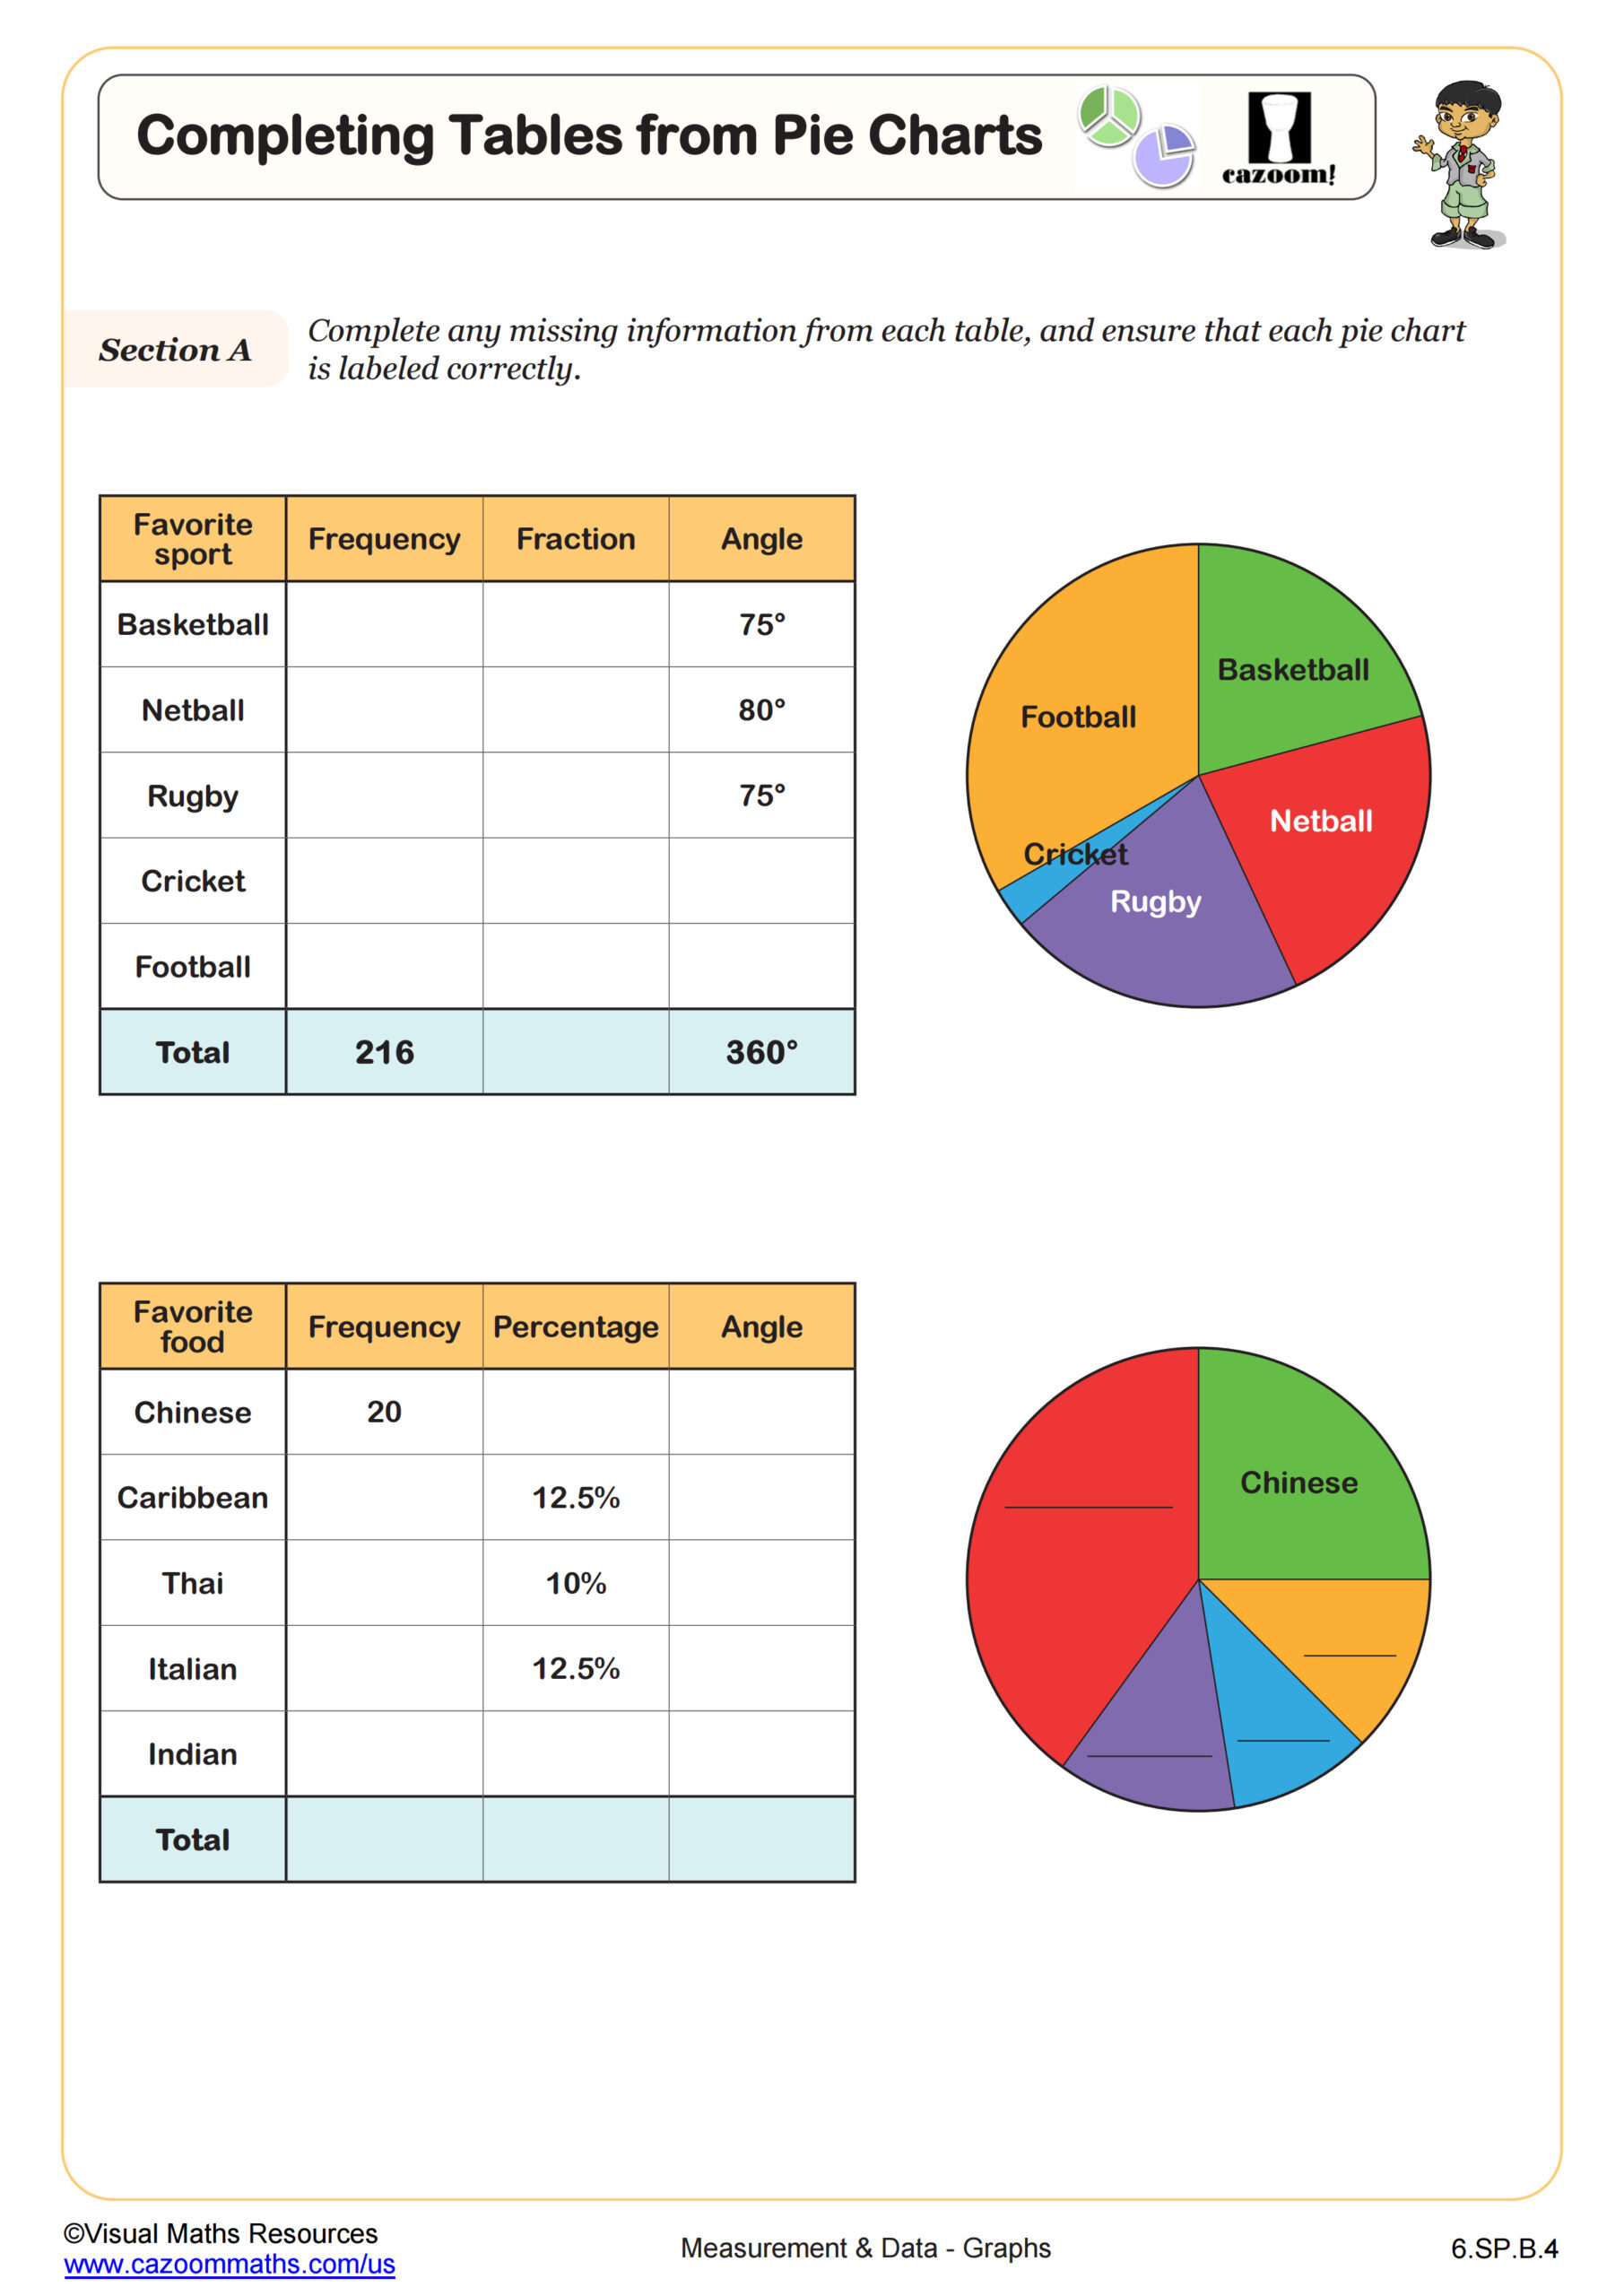
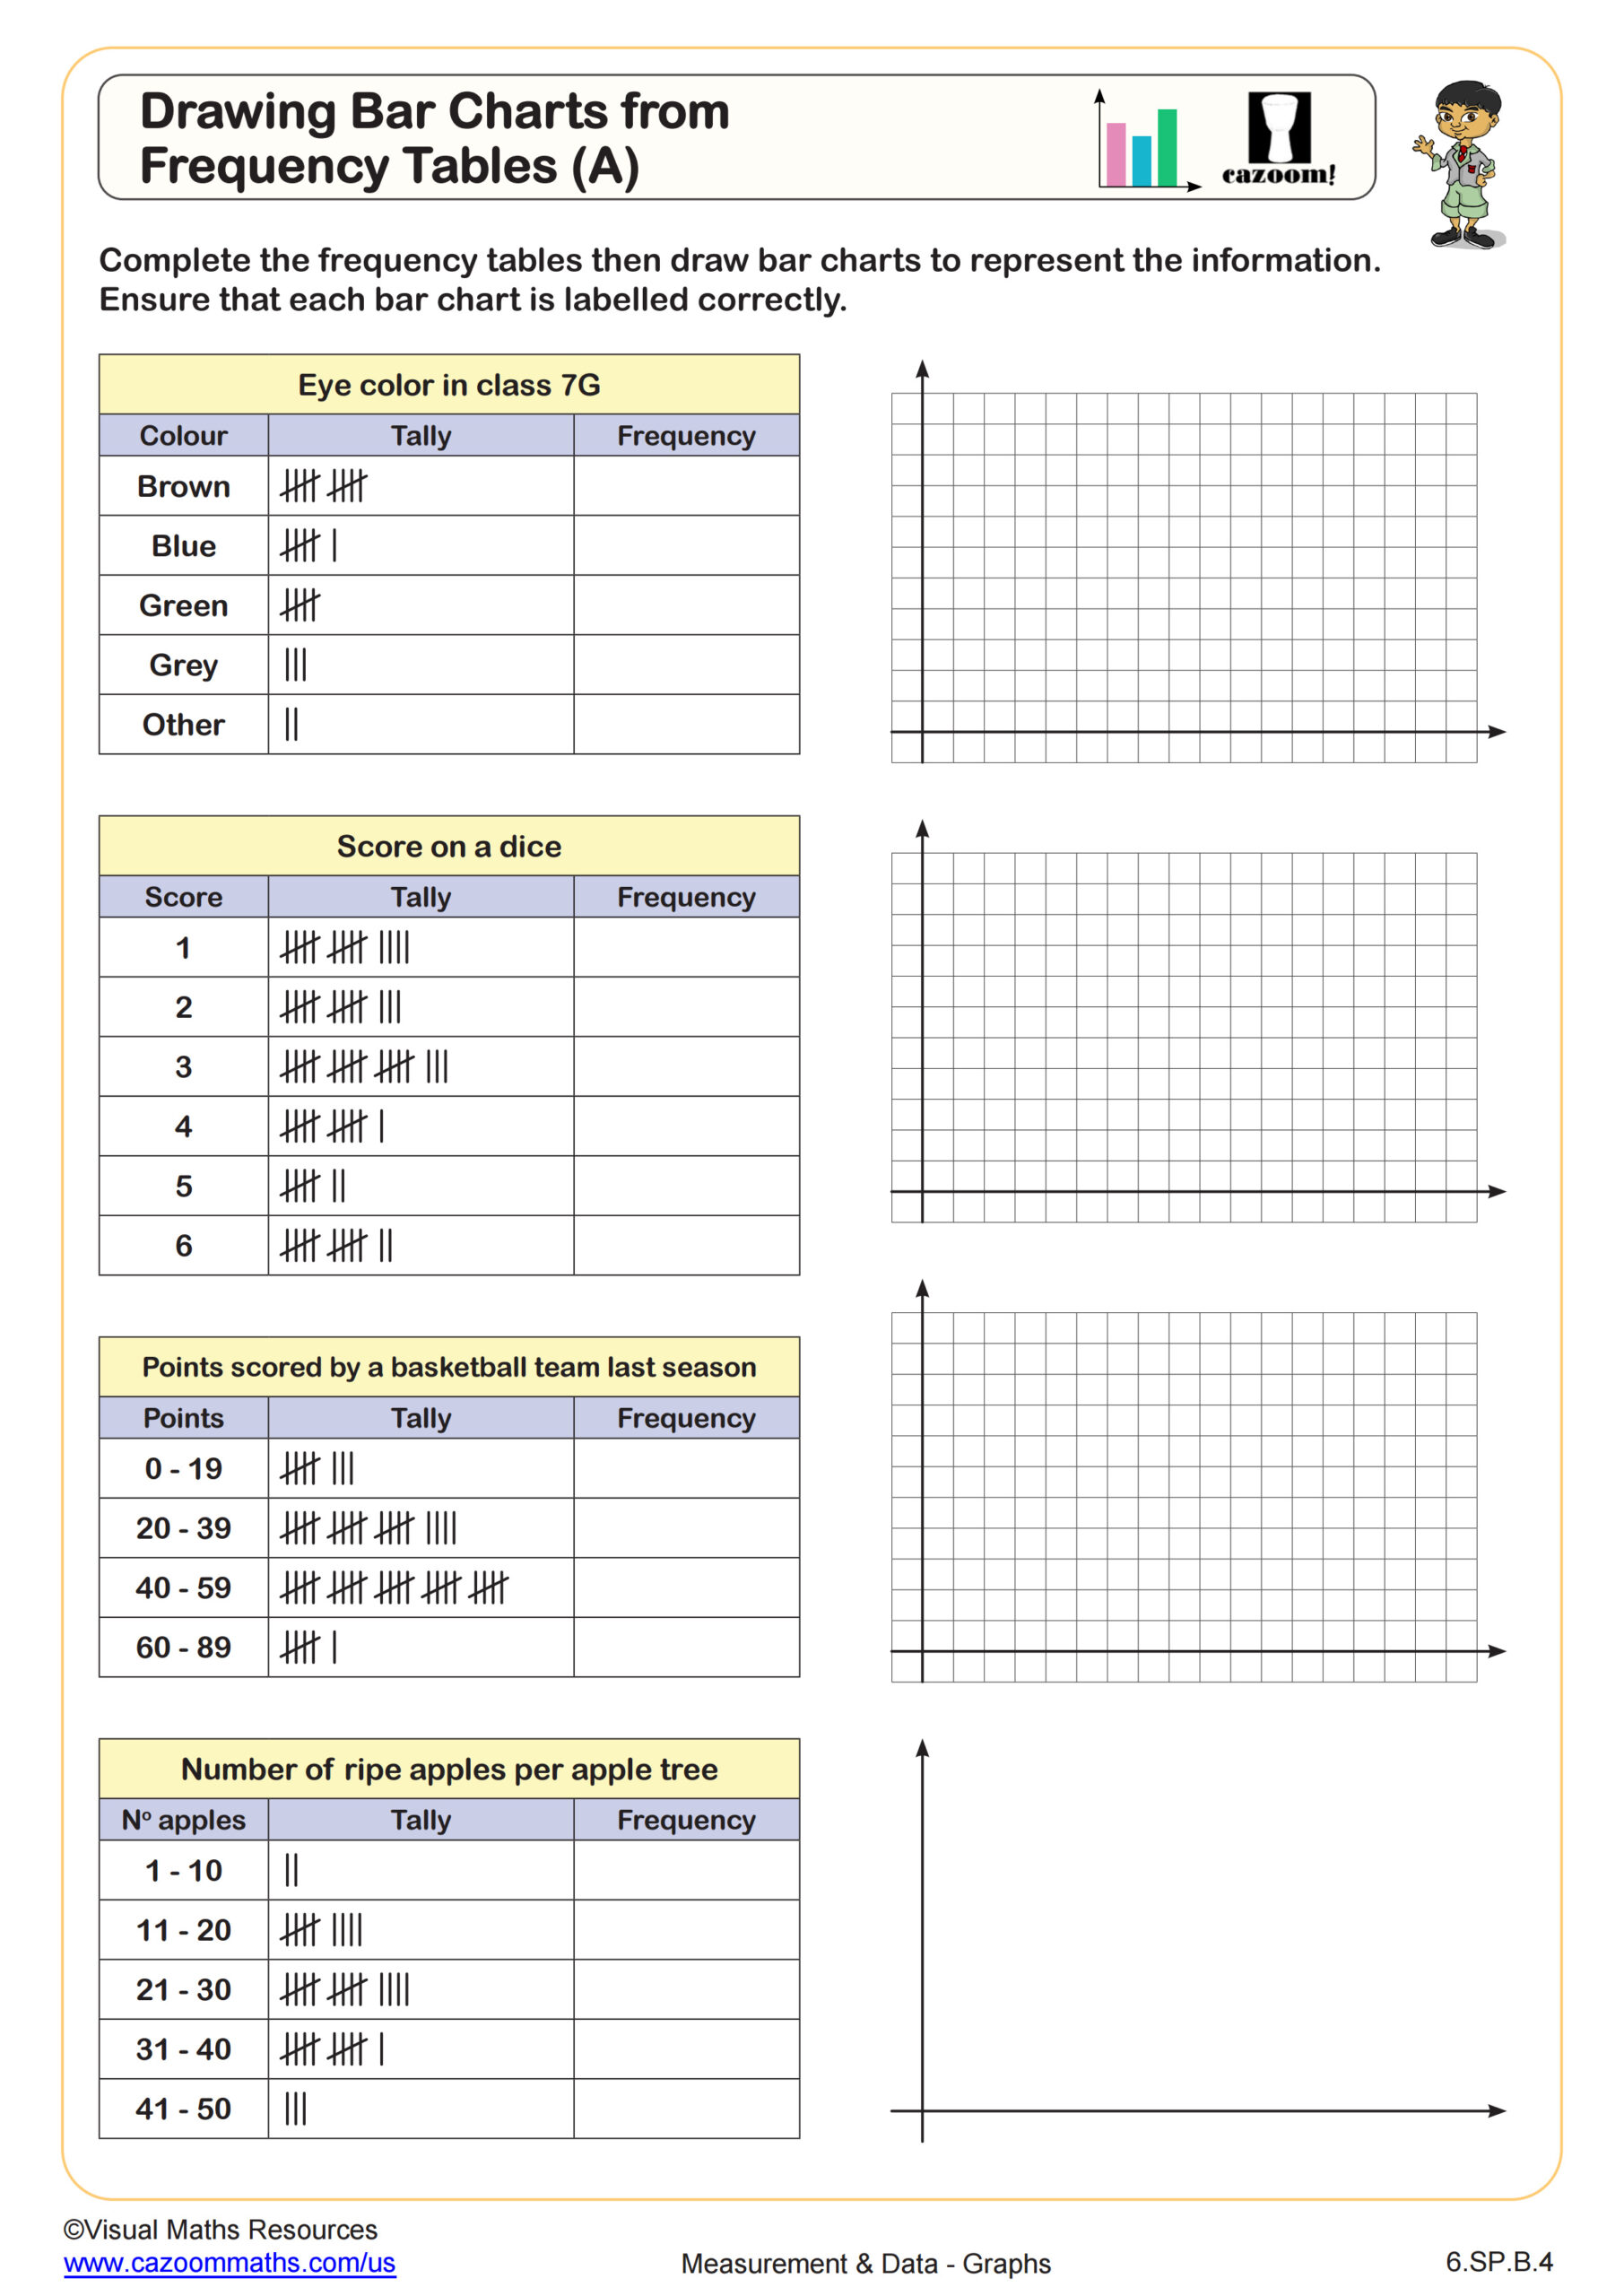
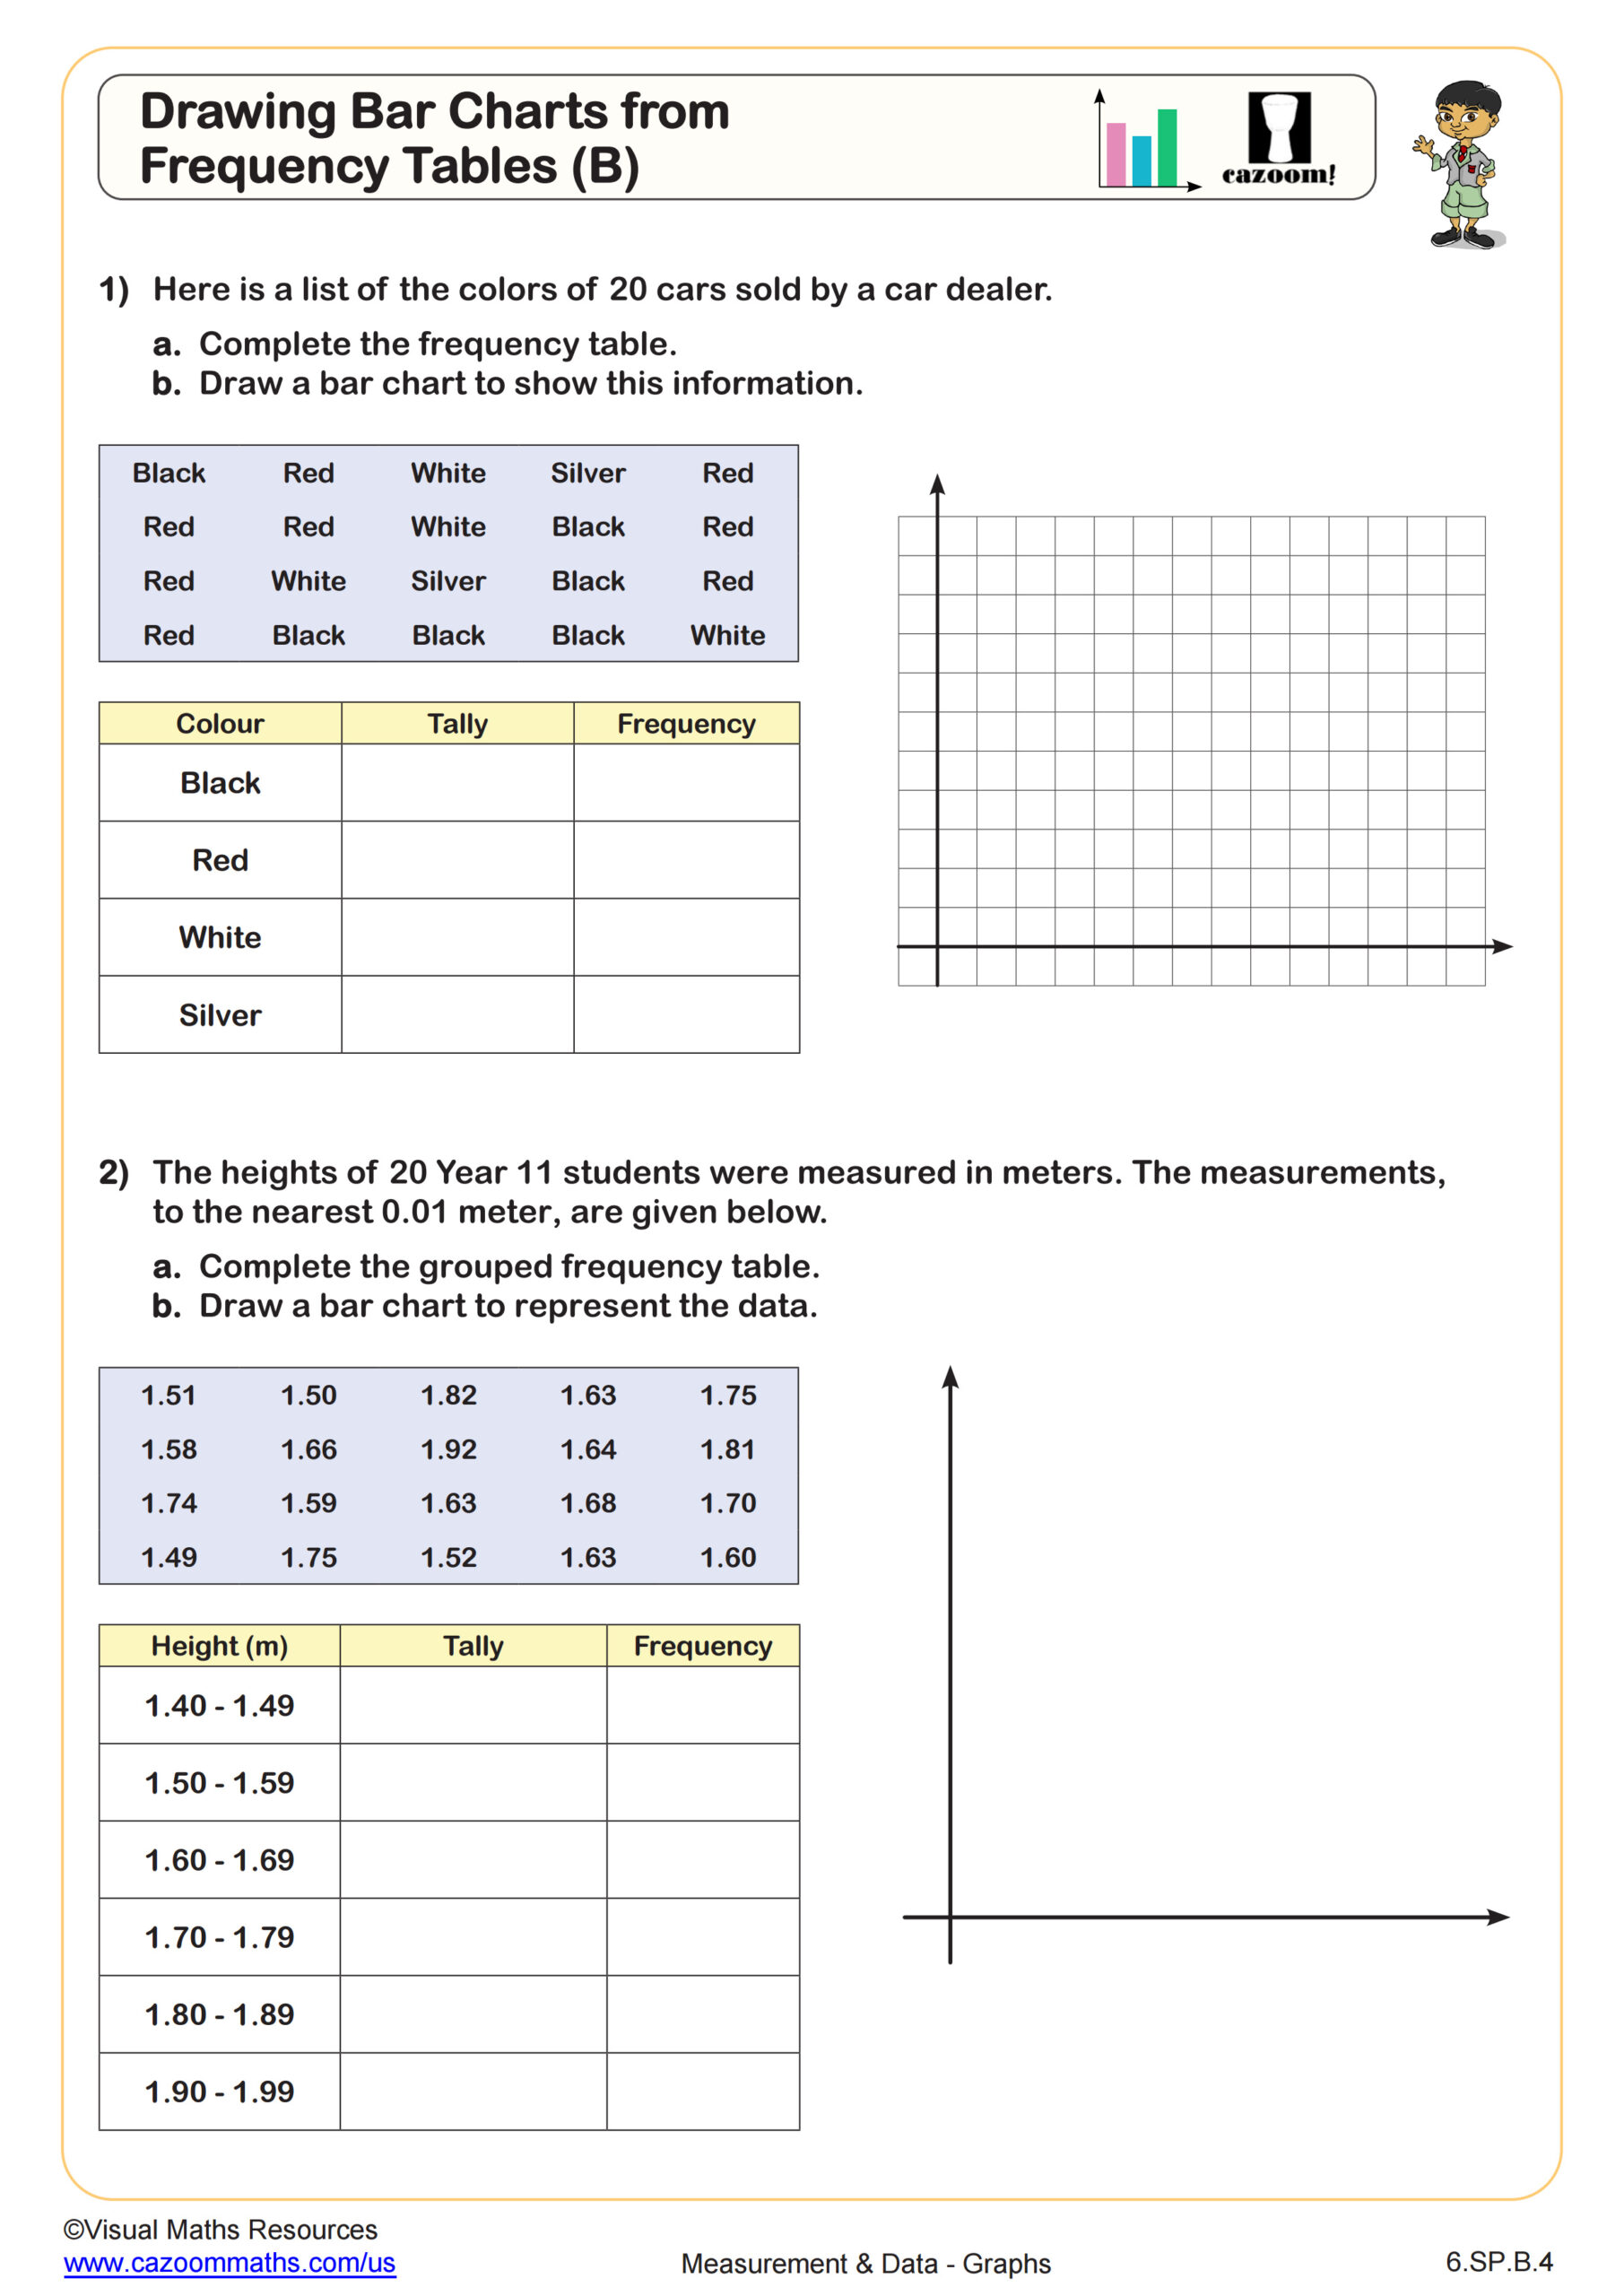
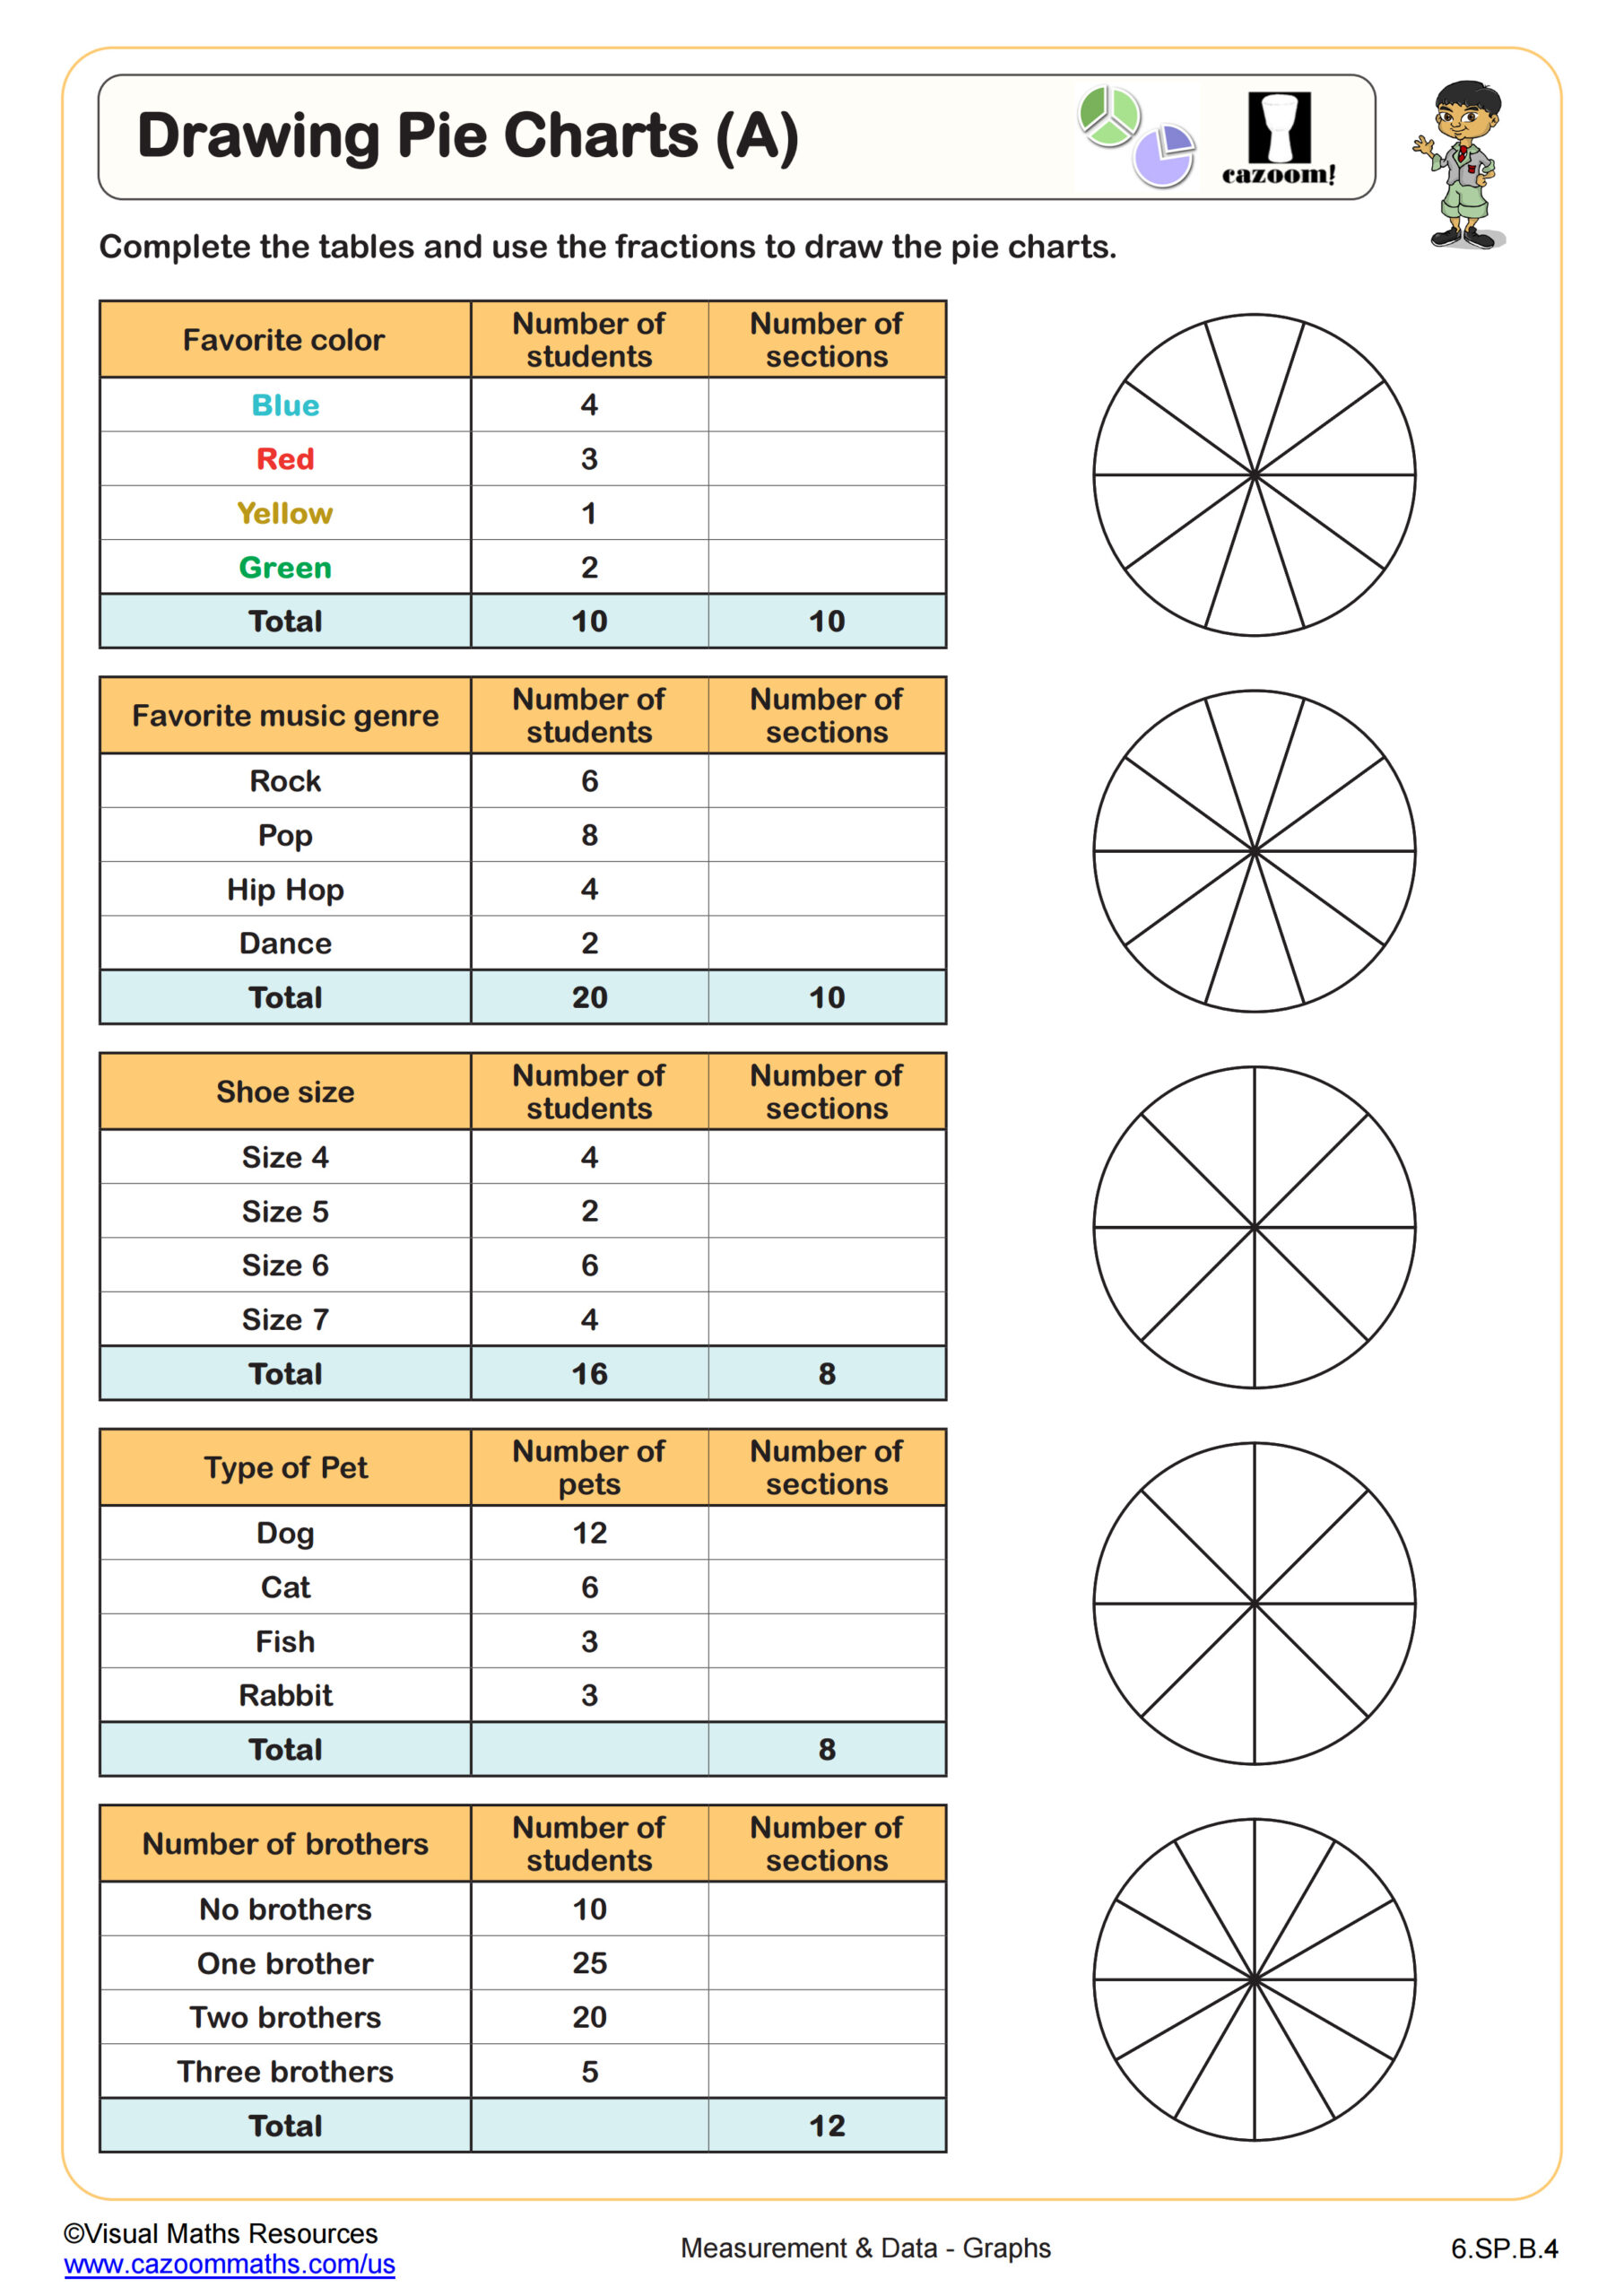
What's the difference between pie charts and bar charts?
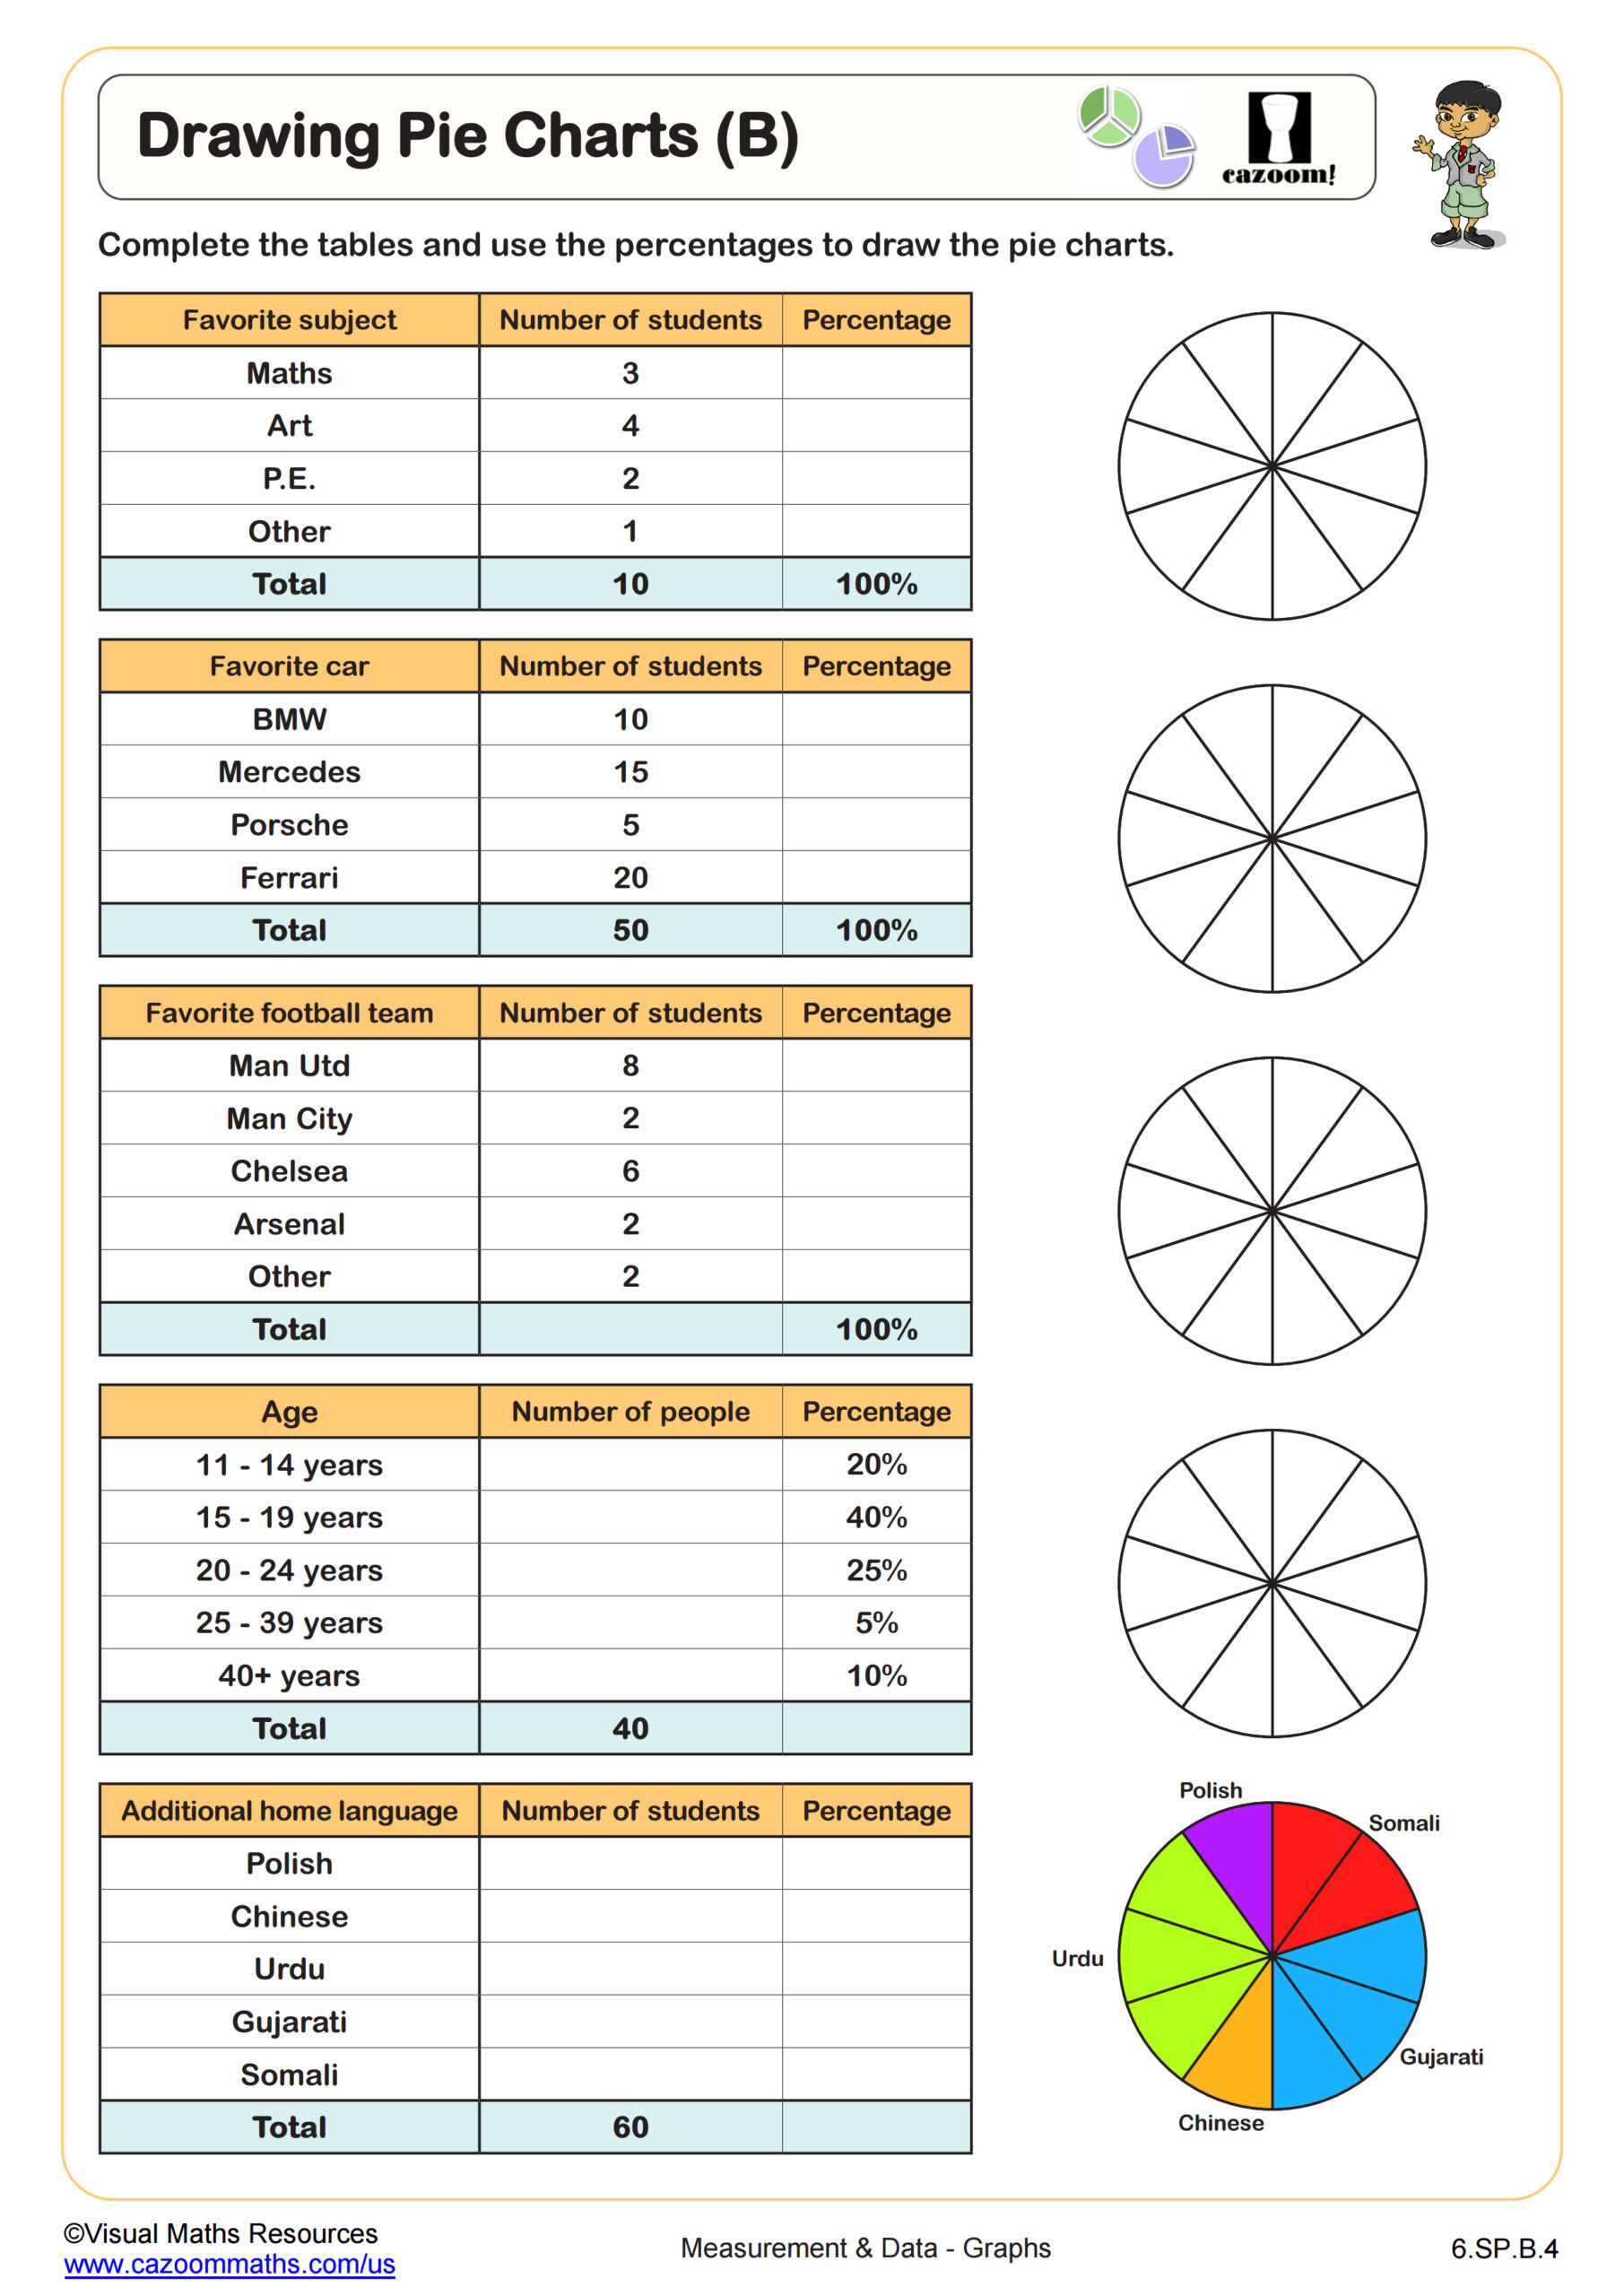
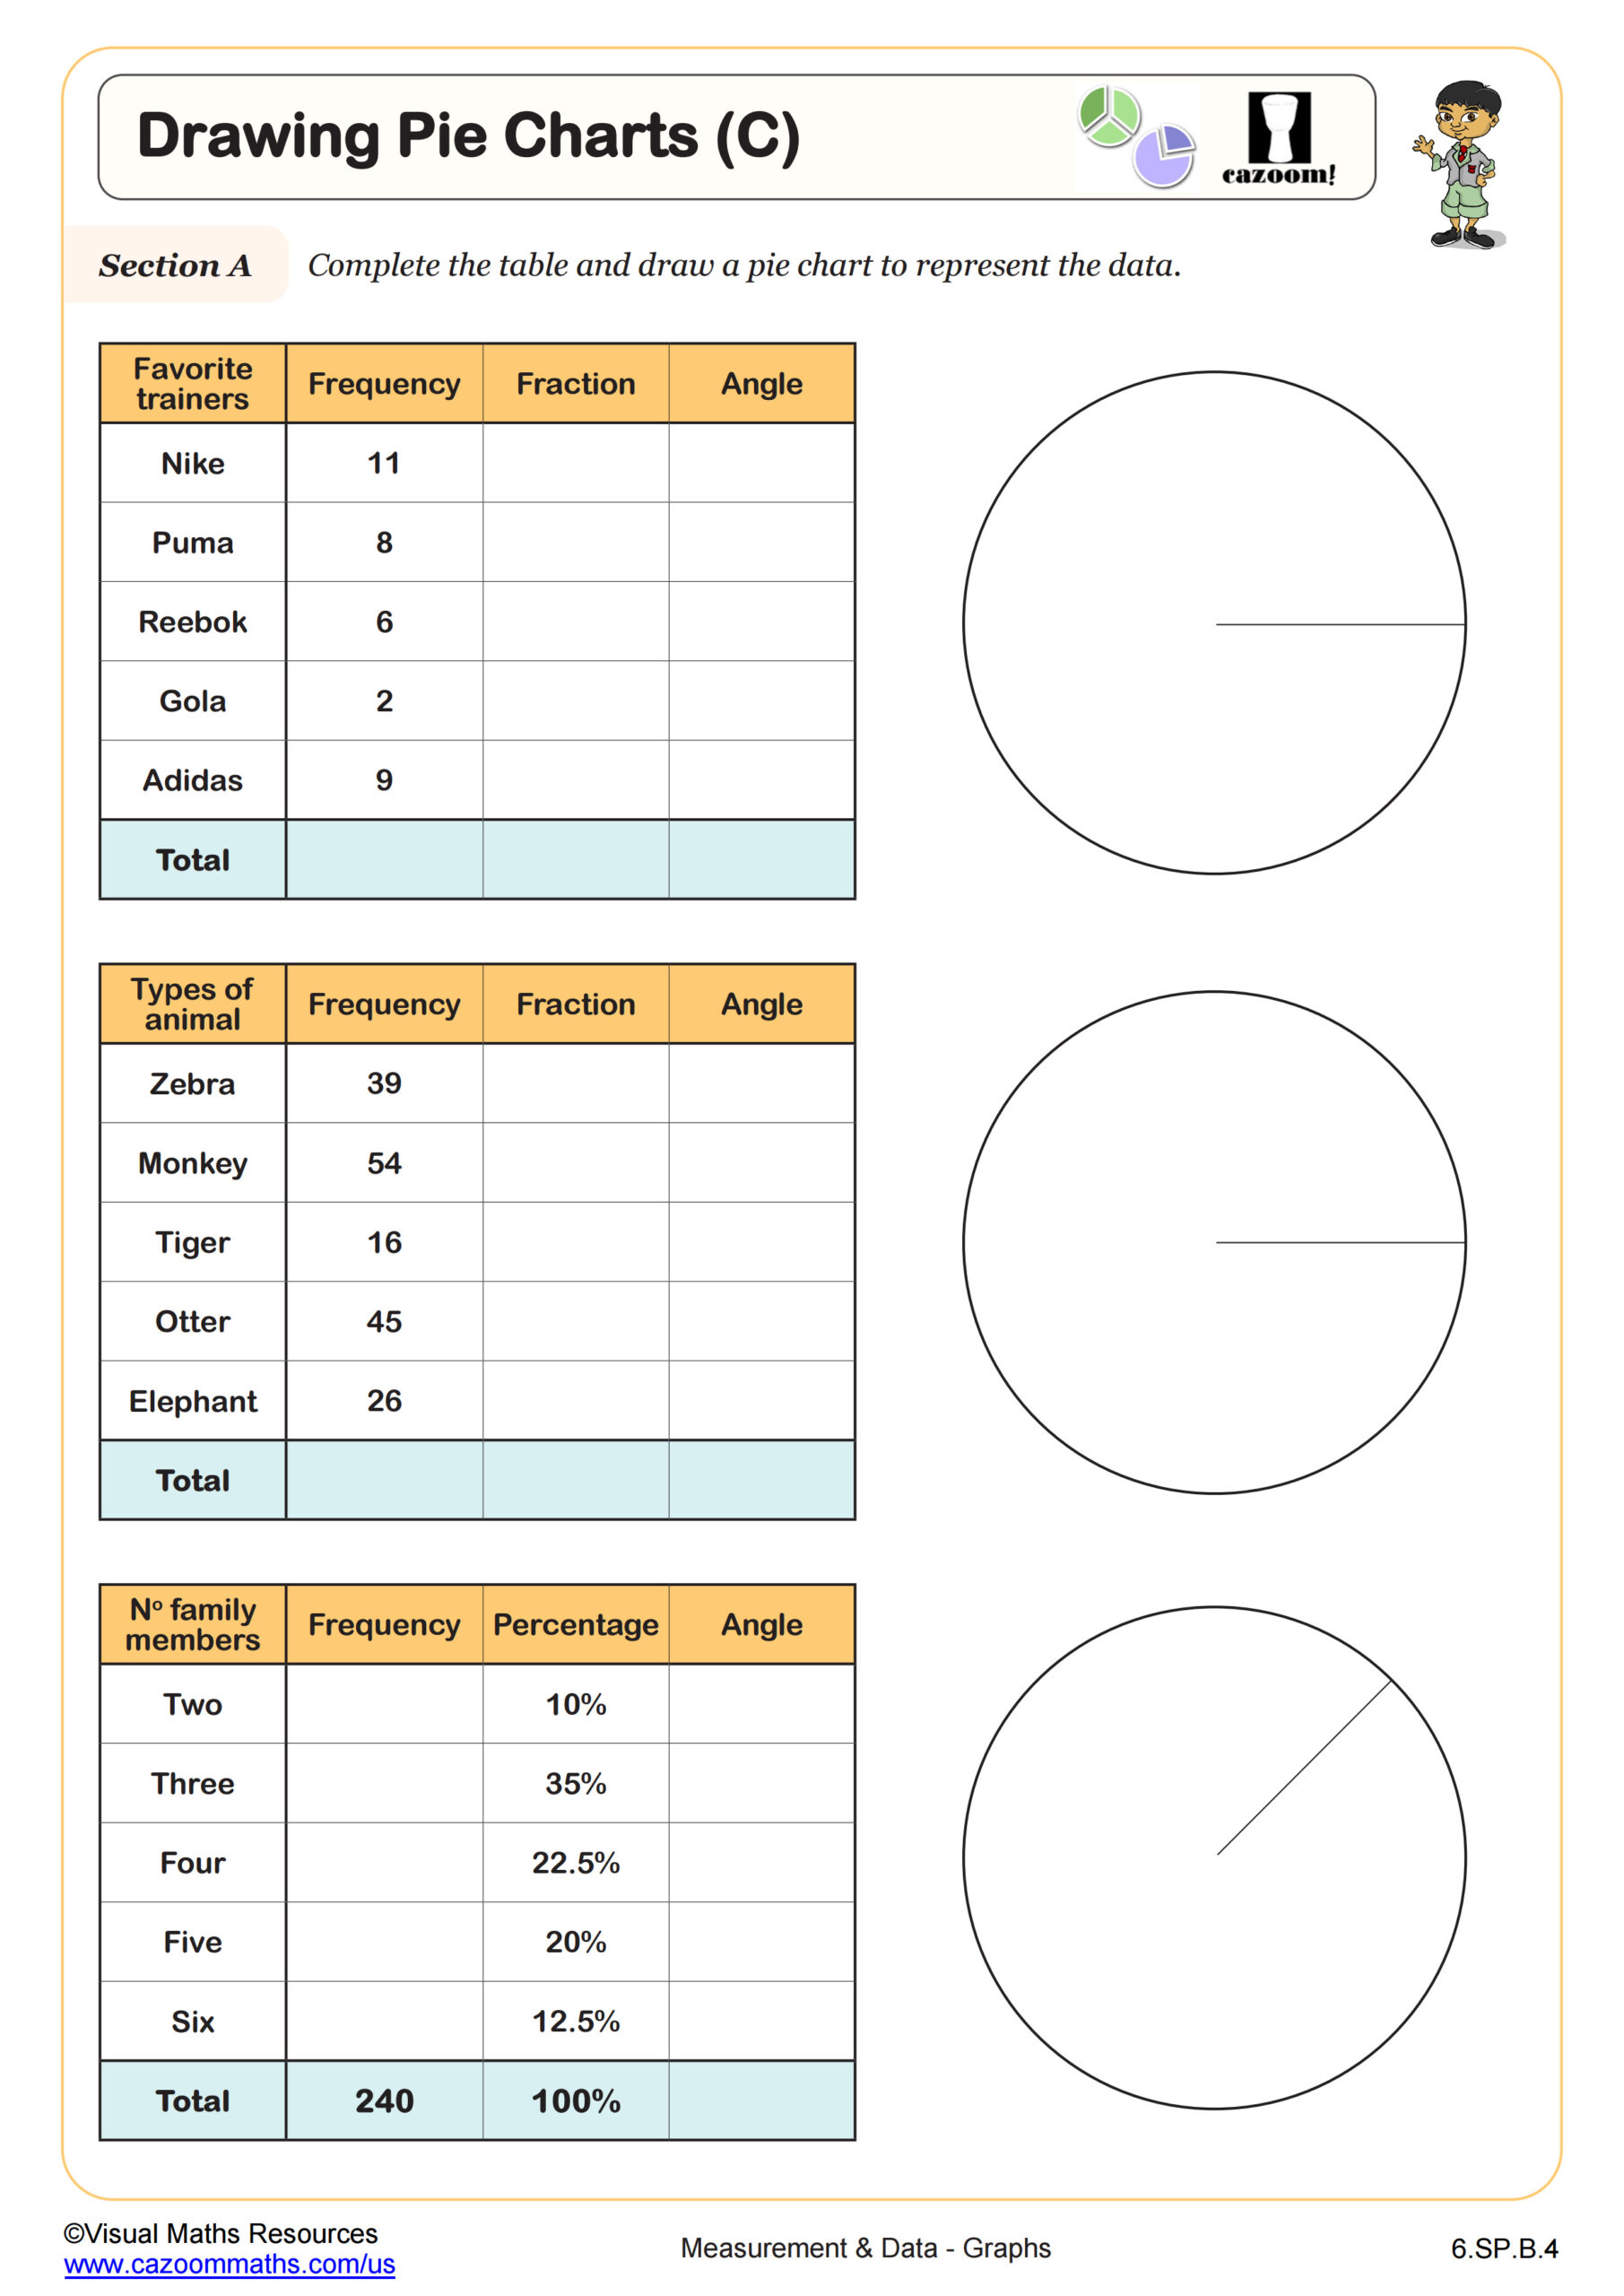
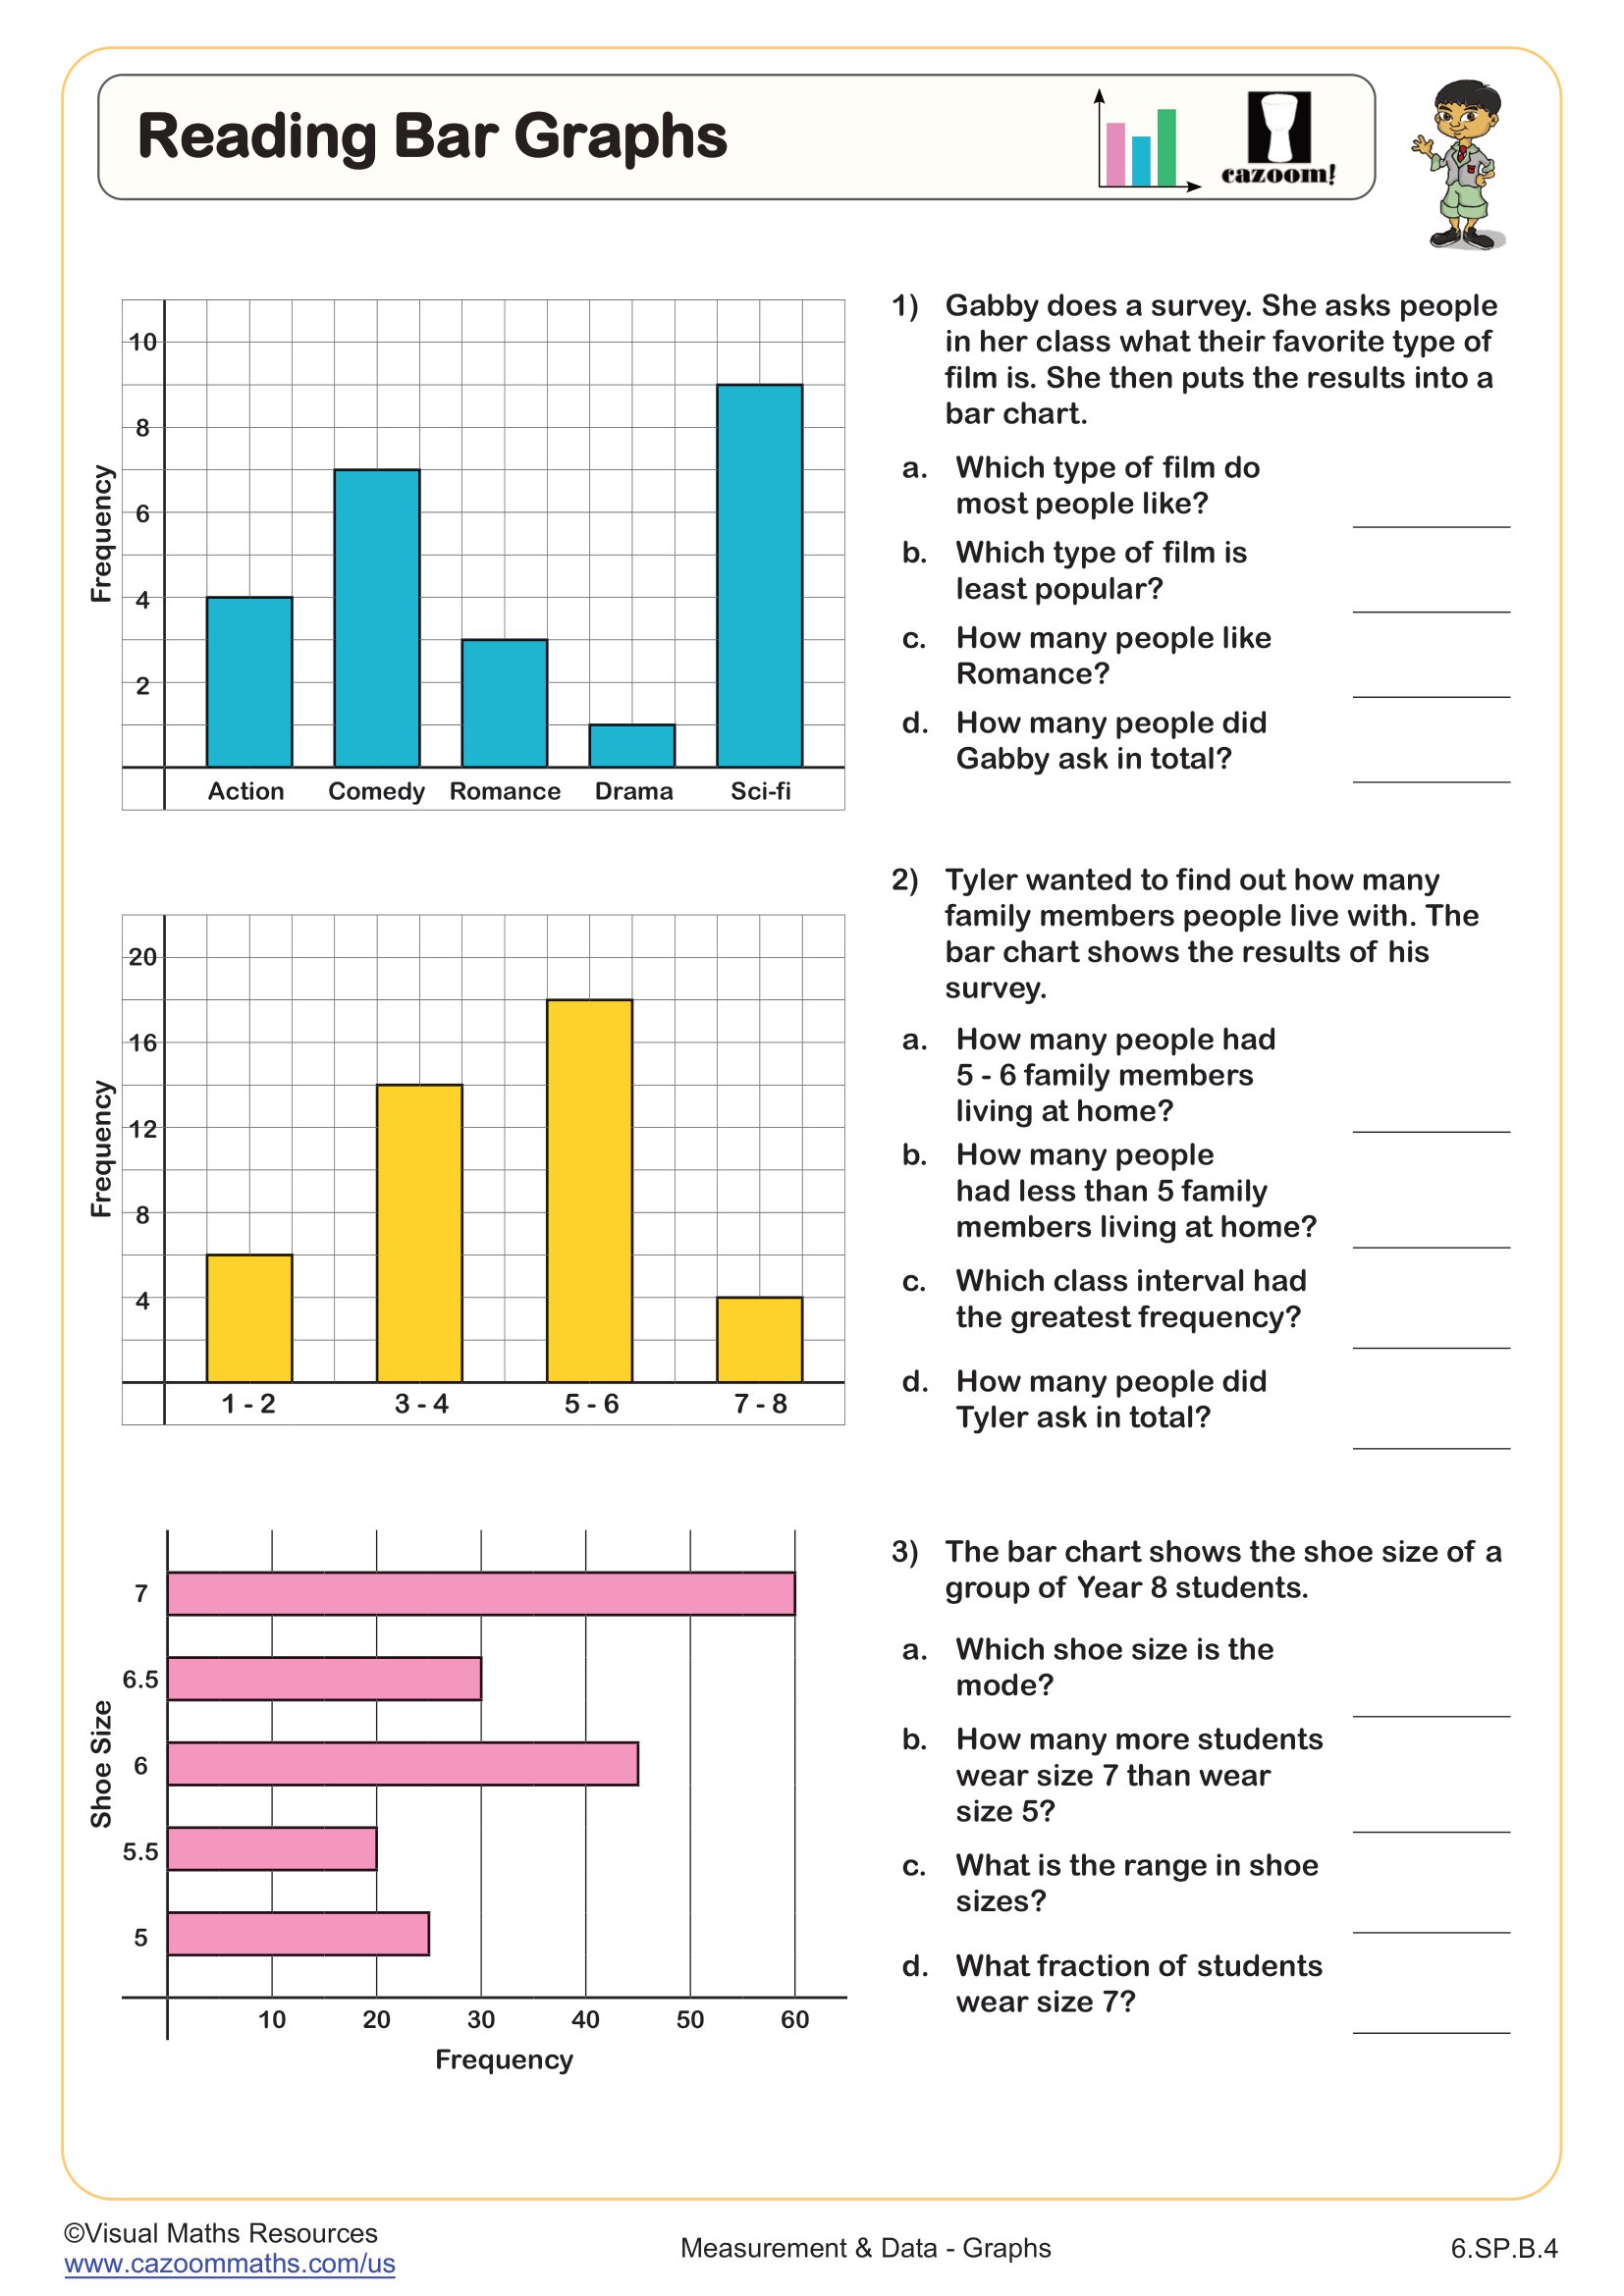
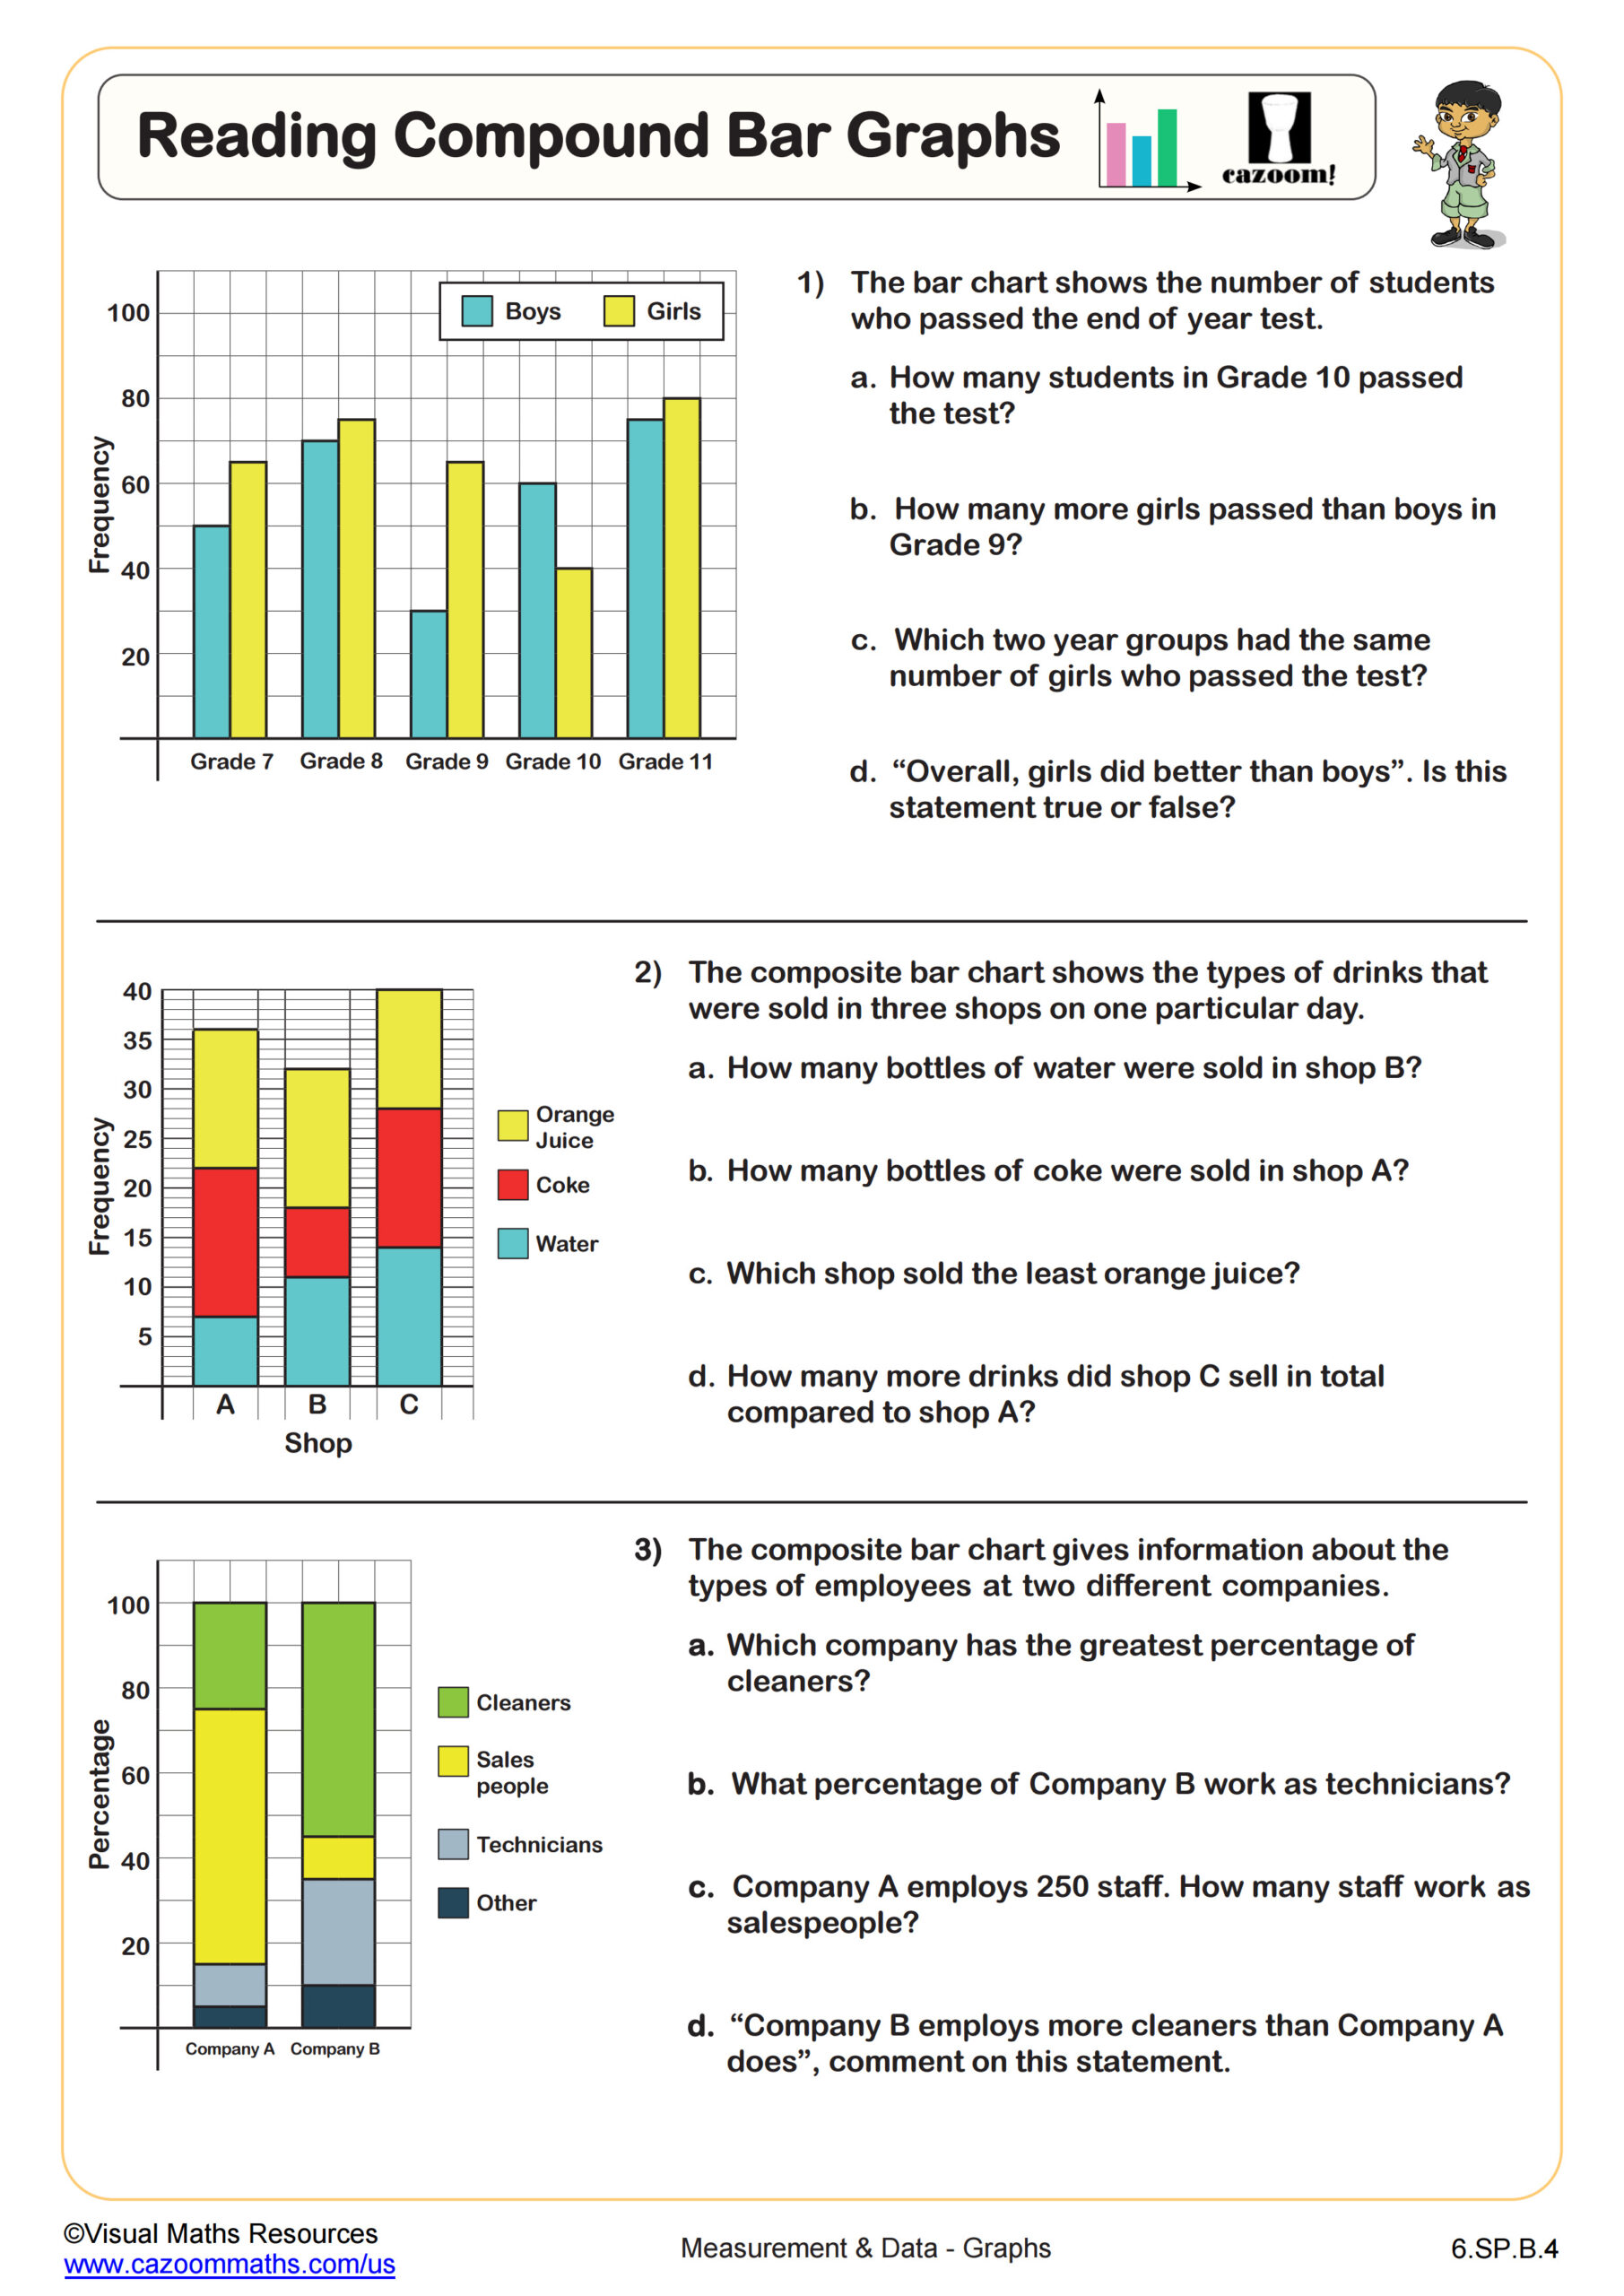
Pie charts display parts of a whole using sectors of a circle, showing proportions or percentages that must total 100%. Bar charts use rectangular bars to compare quantities across categories, where values don't need to sum to any particular amount. Students typically encounter bar charts first because they're more straightforward for comparing discrete values.
A common error occurs when students try to use pie charts for data that doesn't represent parts of a whole. For example, comparing test scores across different classes works better as a bar chart, while showing how a student spent 24 hours works perfectly as a pie chart. Standardized tests frequently assess whether students can identify which graph type matches the question being asked about a data set.
What grade level are these pie charts and bar charts worksheets for?
This collection targets 6th grade students in middle school, aligning with standards that emphasize data analysis and statistical thinking. At this level, students move beyond simple graph reading to constructing graphs from raw data and analyzing which representation best communicates specific information.
The worksheets progress from reading existing graphs to producing two-way tables and selecting appropriate graphical representations independently. Early worksheets focus on interpreting bar graphs and block diagrams, while later problems require students to evaluate multiple graph types and justify their choices. This progression builds the analytical skills needed for 7th and 8th grade statistics units involving probability and sampling.
How do two-way tables connect to pie charts and bar charts?
Two-way tables organize data into rows and columns to show relationships between two categorical variables, such as favorite sport by grade level or study time by test performance. Students learn to construct these tables from surveys or observations, then use them as the foundation for creating bar graphs that compare categories side by side.
This skill appears constantly in STEM fields where professionals analyze relationships between variables. Epidemiologists use two-way tables to track disease patterns across populations, while market researchers examine consumer preferences by demographic groups. Students who master organizing data into two-way tables find it much easier to select appropriate graph types because the table structure reveals whether they're comparing categories, showing parts of a whole, or tracking changes over time.
How can teachers use these worksheets effectively in the classroom?
The worksheets scaffold learning by starting with graph interpretation before moving to graph construction and evaluation. This sequence helps students develop the visual literacy needed to extract information from graphs before creating their own. Answer keys allow students to check their work independently, making the worksheets valuable for self-paced learning or differentiated instruction.
Teachers find these worksheets useful for targeted intervention with students who struggle on state assessment data questions. They work well as warm-up activities to review graph reading skills, homework that reinforces lessons on data representation, or paired work where students explain their reasoning for choosing specific graph types. The variety of subtopics covered means teachers can assign specific worksheets that address gaps identified through formative assessment rather than reviewing all graphing concepts equally.