6th Grade Samples and Surveys Worksheets
All worksheets are created by the team of experienced teachers at Cazoom Math.
What makes 6th grade homeschool worksheets effective for teaching statistics?
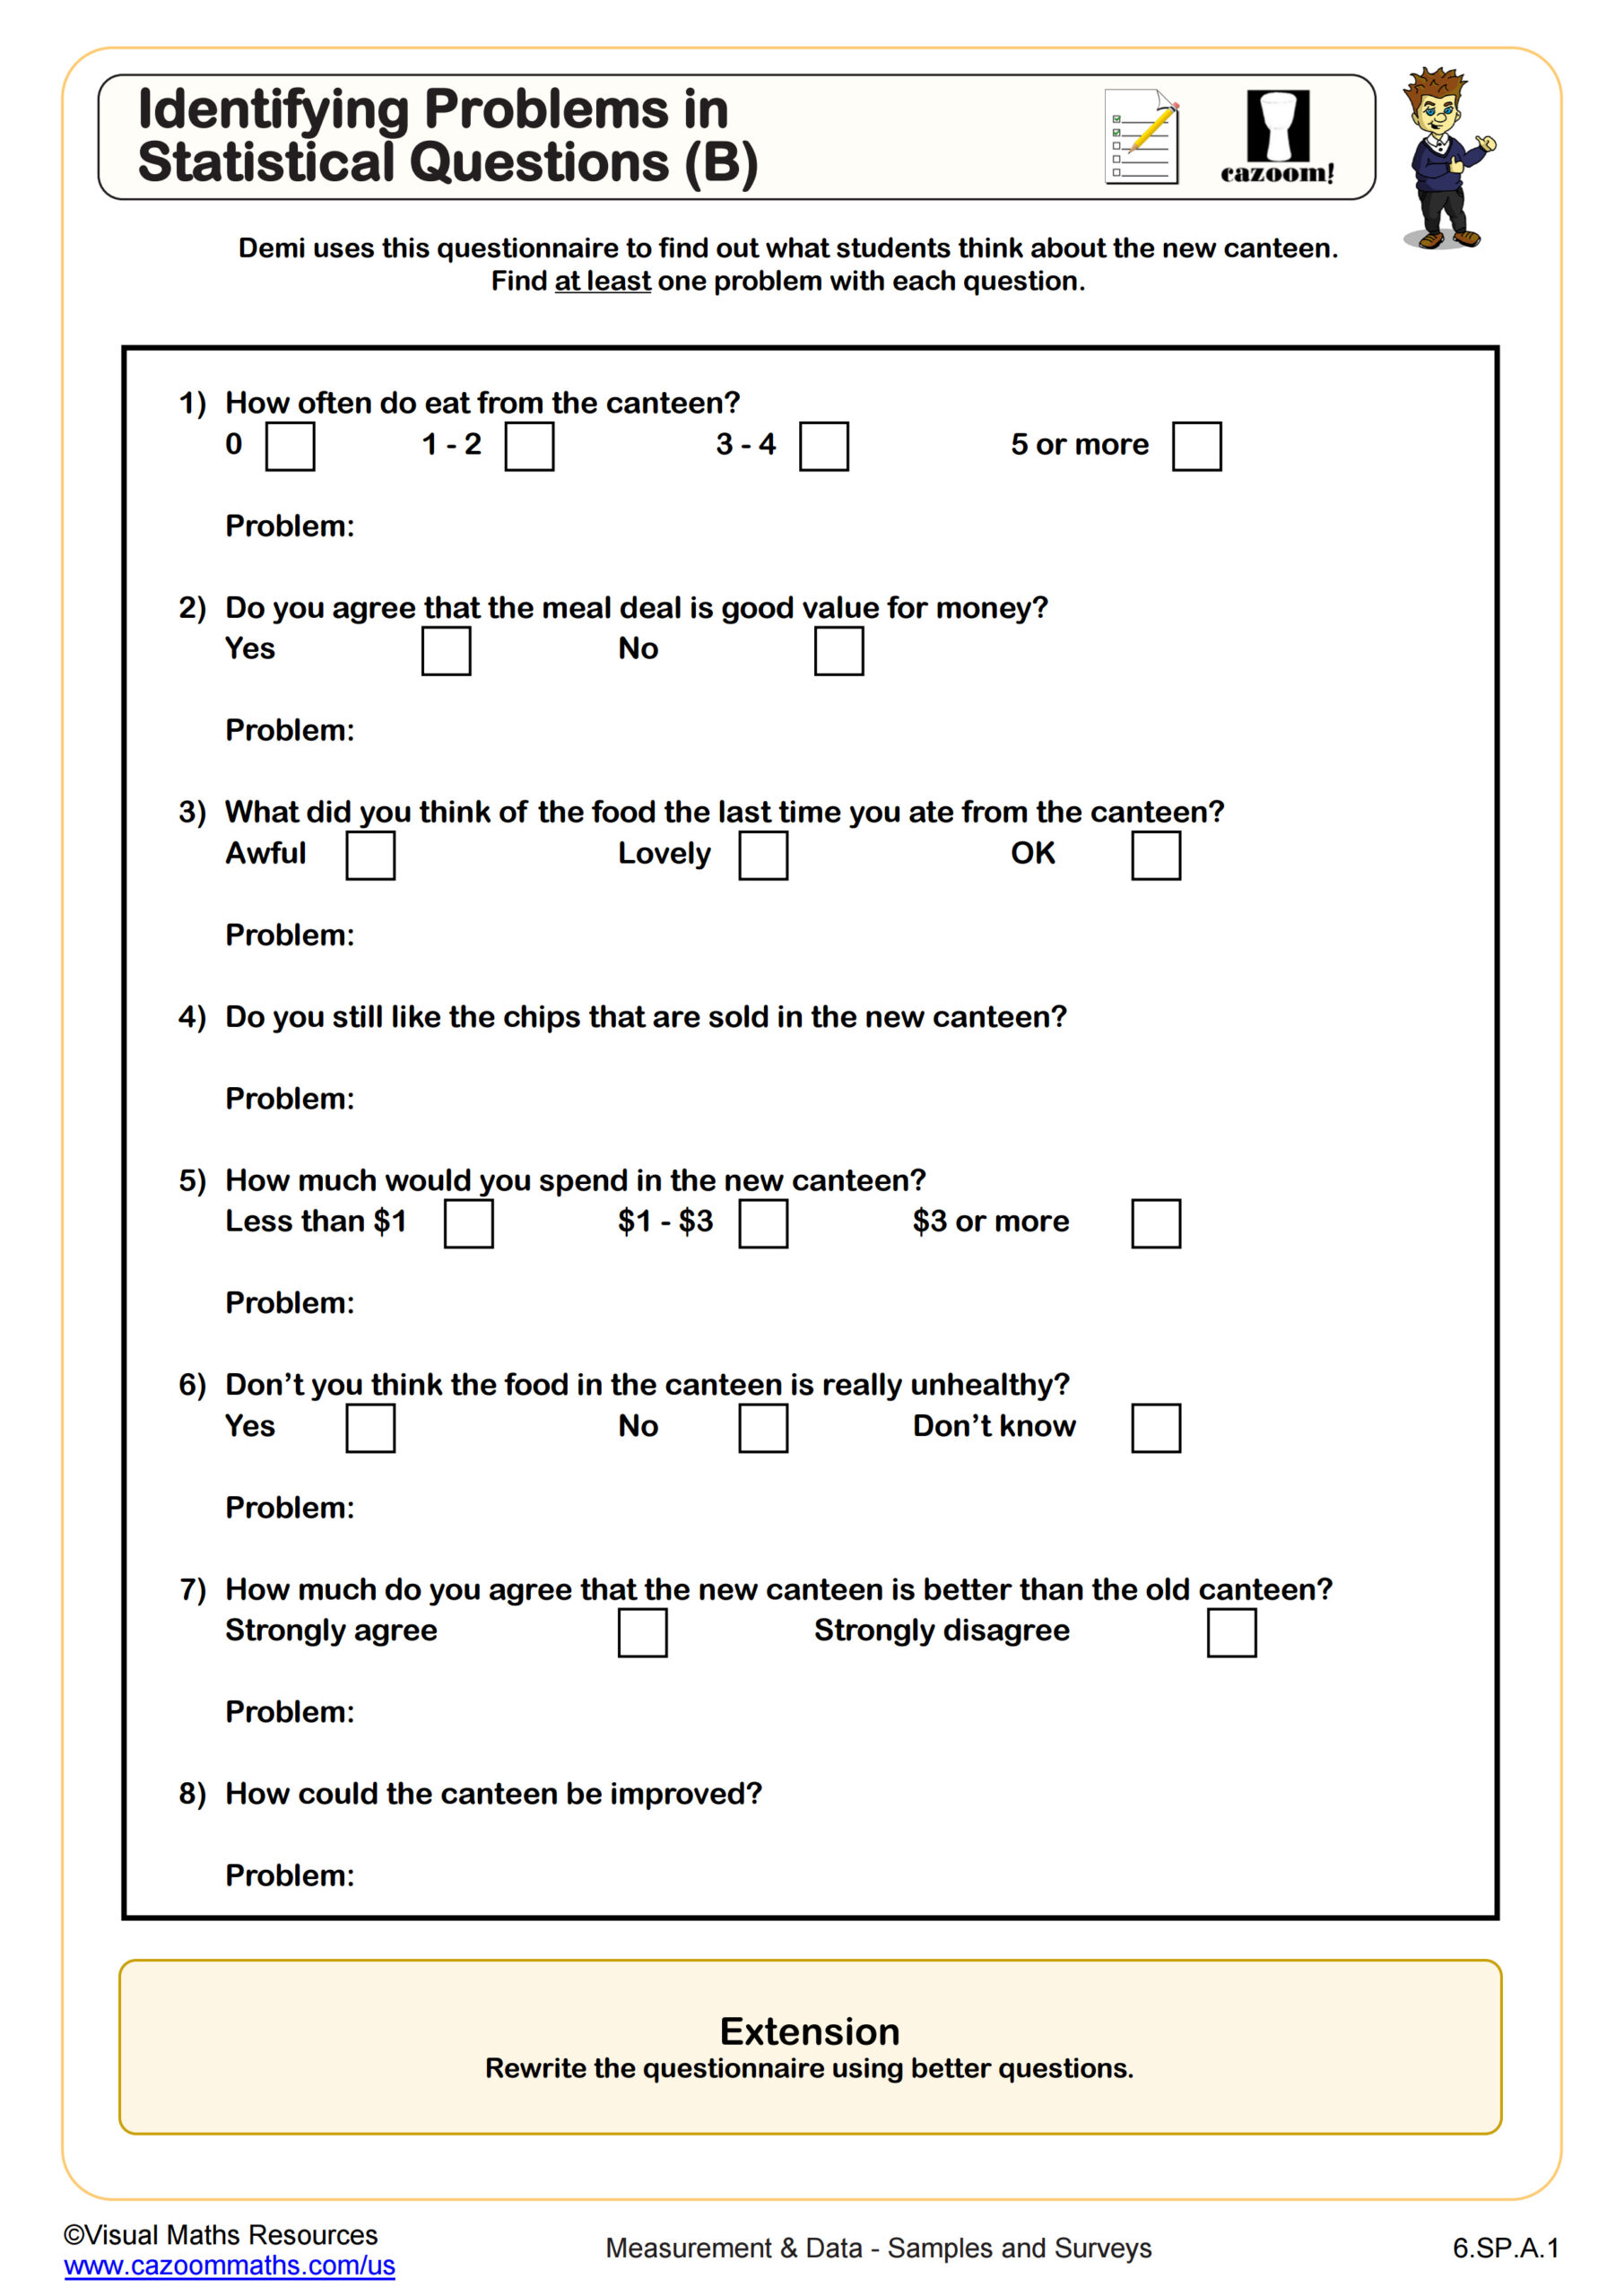
Effective 6th grade homeschool worksheets for statistics present concepts through real-world scenarios that students can relate to, such as surveying classmates about favorite foods or analyzing sports team data. The Common Core standards at this level emphasize developing statistical questions and understanding variability in data, which requires practice with concrete examples rather than abstract concepts.
Teachers consistently observe that students need multiple exposures to distinguish between questions that have single correct answers and those requiring data collection. Quality worksheets provide varied contexts - from school surveys to community polling - helping students recognize patterns in how statistical questions are structured and answered through data gathering rather than computation alone.
How do 6th grade statistics concepts build from elementary foundations?
Sixth grade statistics worksheets bridge the gap between elementary data displays like bar graphs and pictographs to more sophisticated analysis of samples and populations. Students move from simply reading charts to questioning how data was collected and whether conclusions are valid based on the sample size and method.
This progression requires students to think critically about data sources, which many find challenging initially. Teachers report that students often accept survey results at face value without considering whether the sample represents the larger population. Worksheets that explicitly address sampling bias and representativeness help students develop the analytical thinking skills needed for advanced statistics in middle and high school.
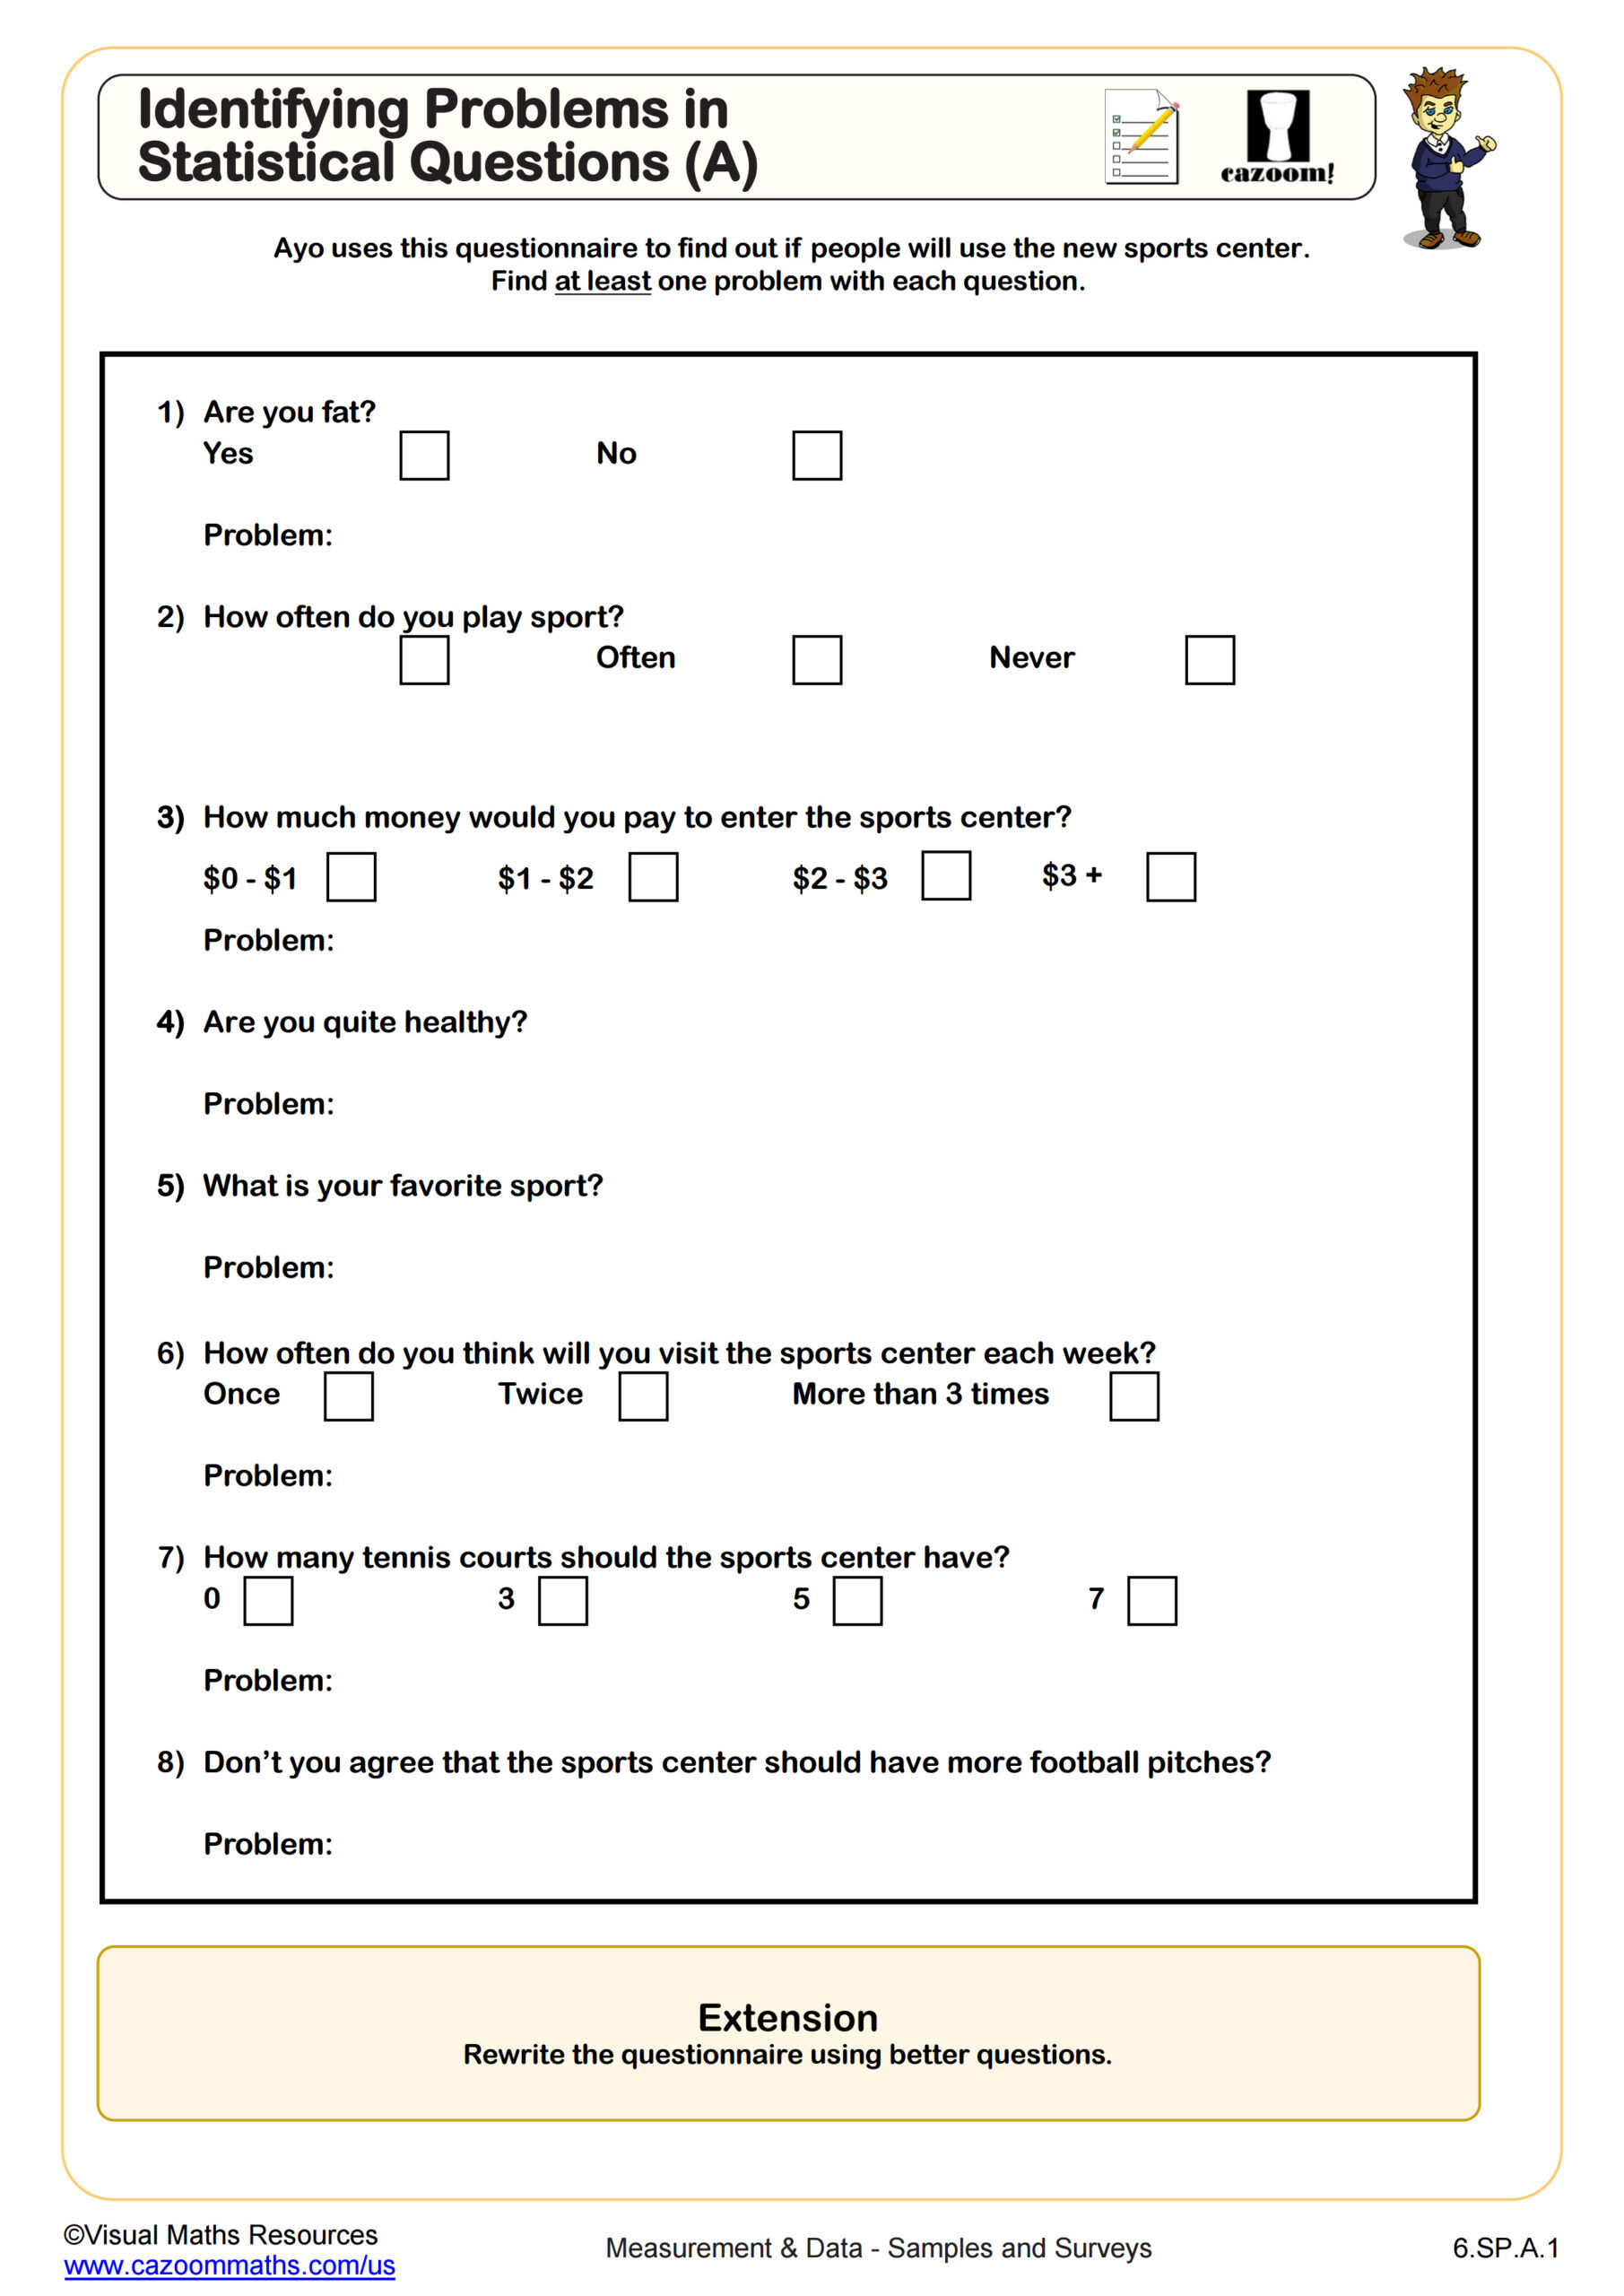
Why do students struggle with identifying statistical questions for 6th graders?
Students frequently confuse statistical questions with regular questions because they focus on whether numbers are involved rather than whether data collection is required. A question like "How tall is the tallest student in class?" seems statistical because it involves measurement, but it has one definite answer, while "How tall are students in our class?" requires gathering multiple data points.
Classroom experience shows that students benefit from sorting activities where they categorize questions as statistical or non-statistical. The key distinction lies in whether the question requires collecting data that will vary, not just whether it involves numbers. Worksheets that provide clear examples and counter-examples help students internalize this critical concept that underlies all statistical thinking.
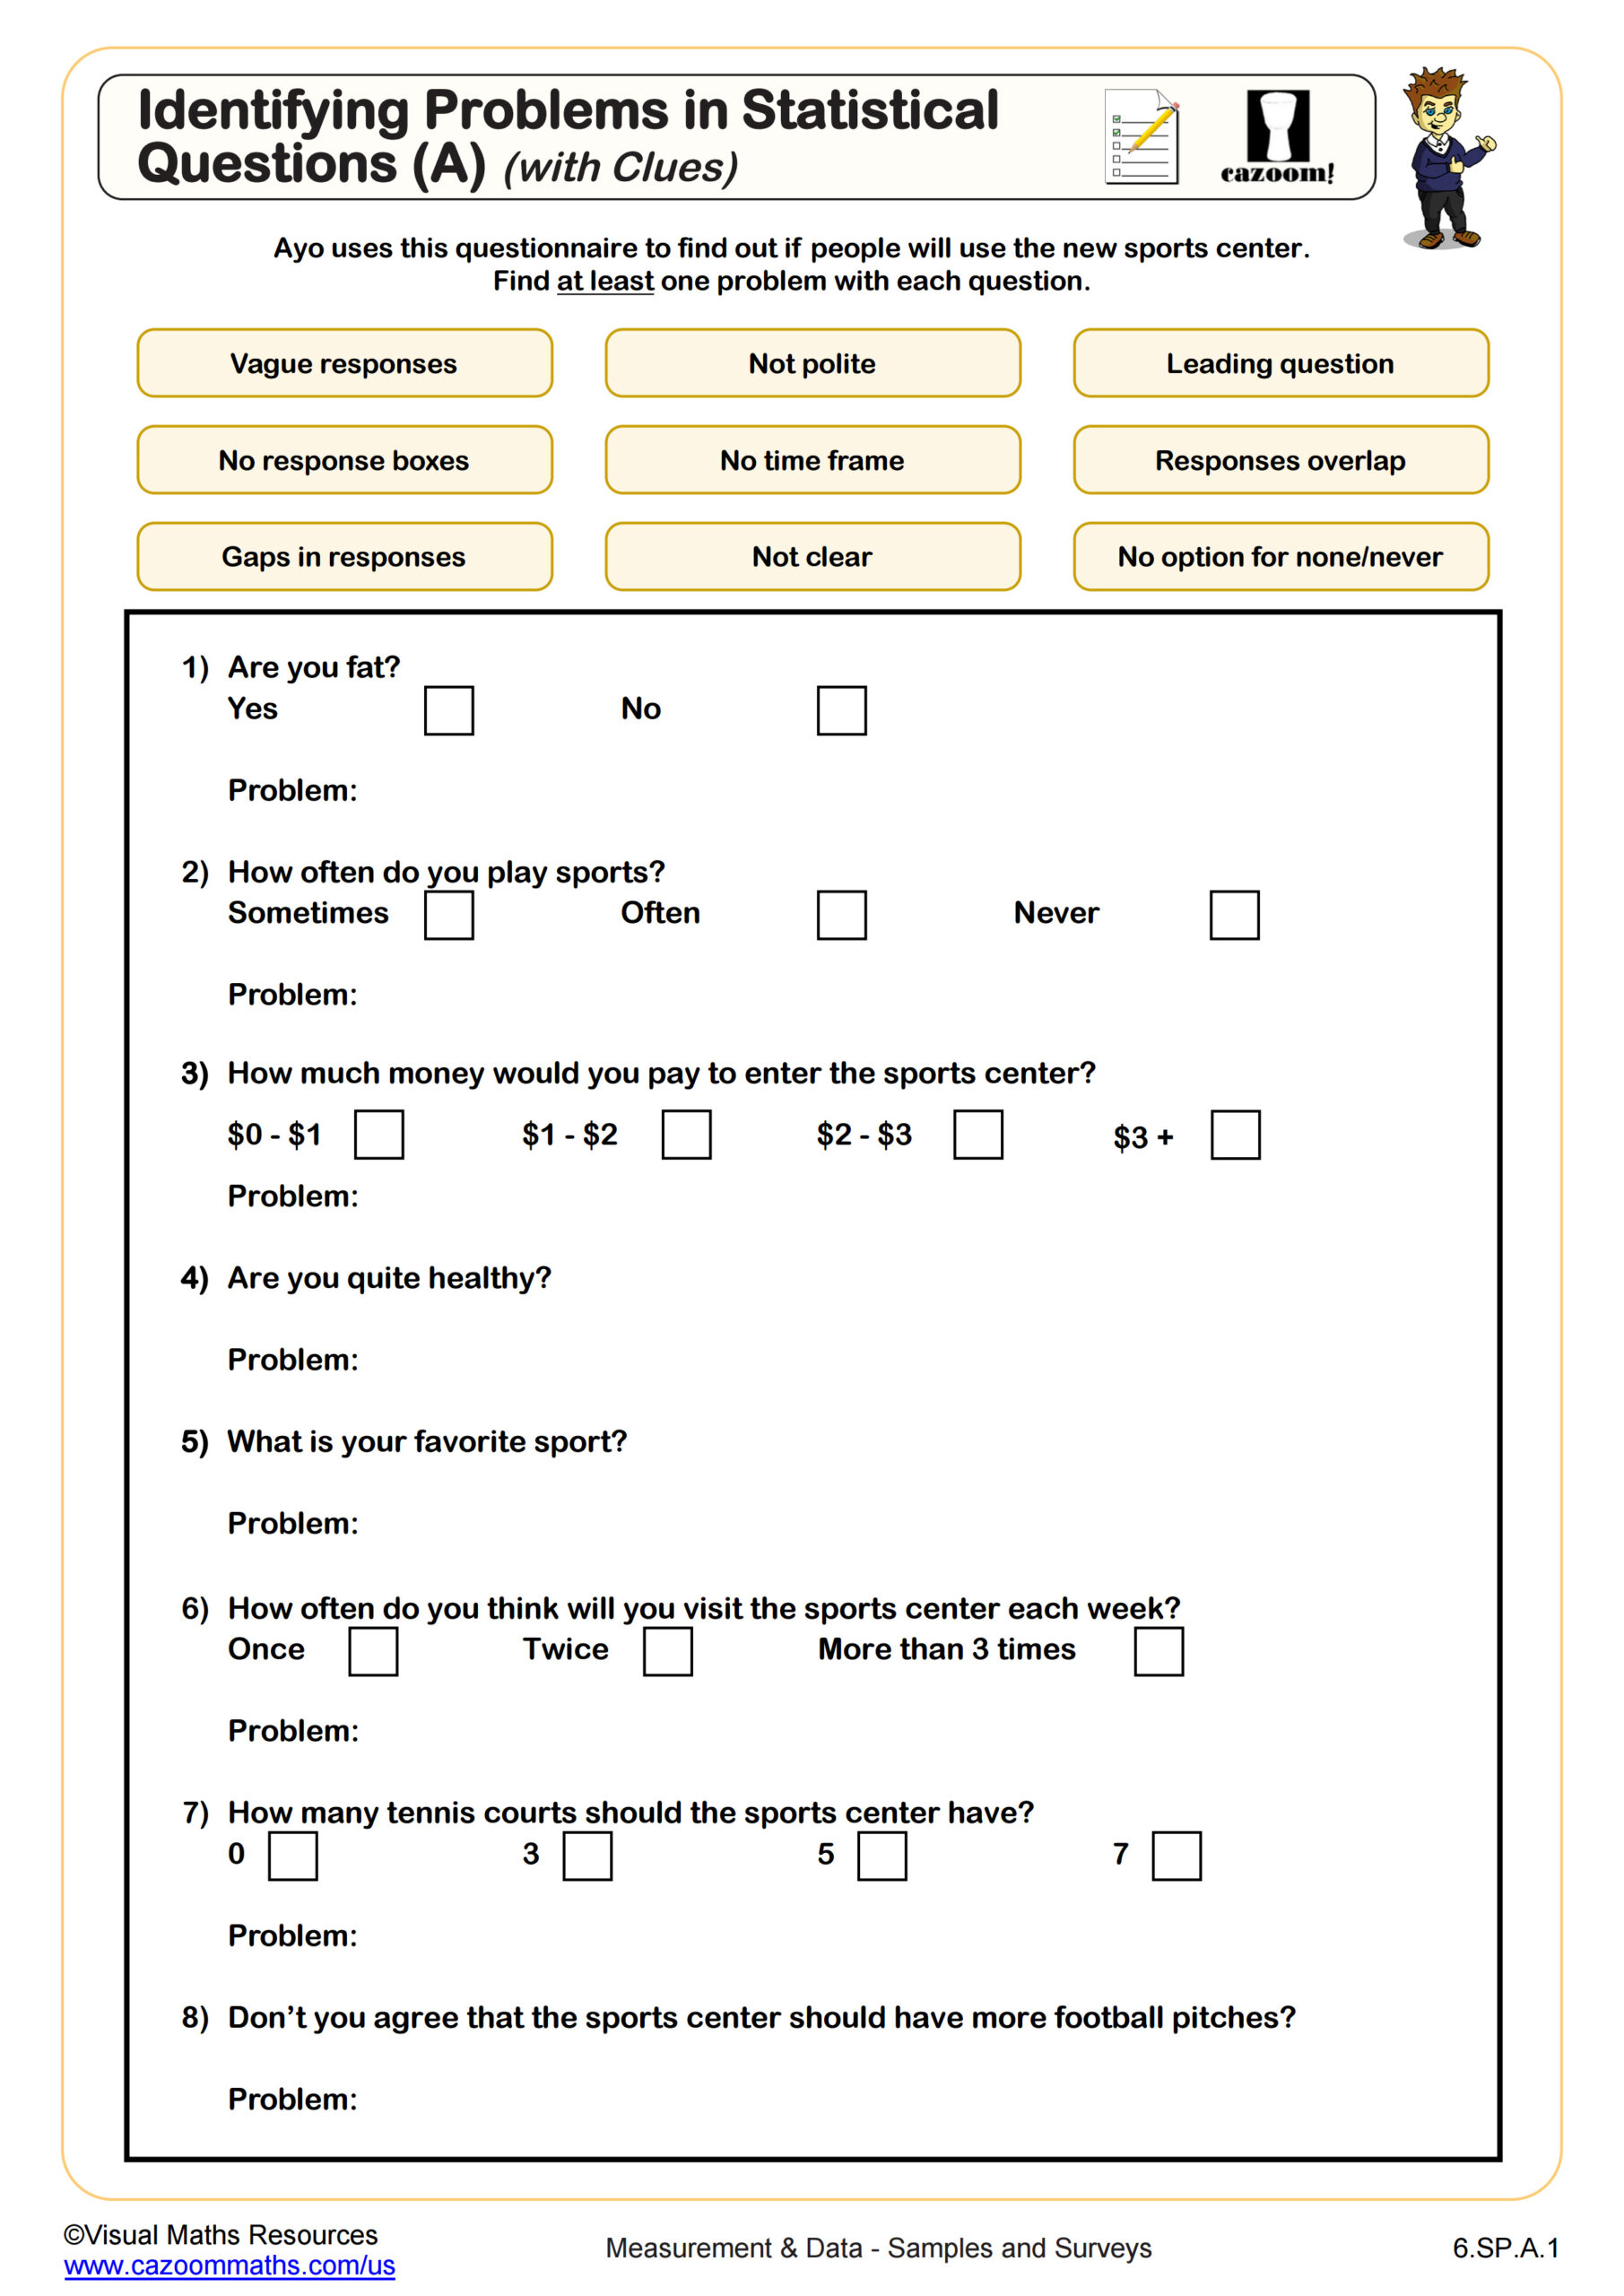
How can teachers maximize learning from samples and surveys worksheets?
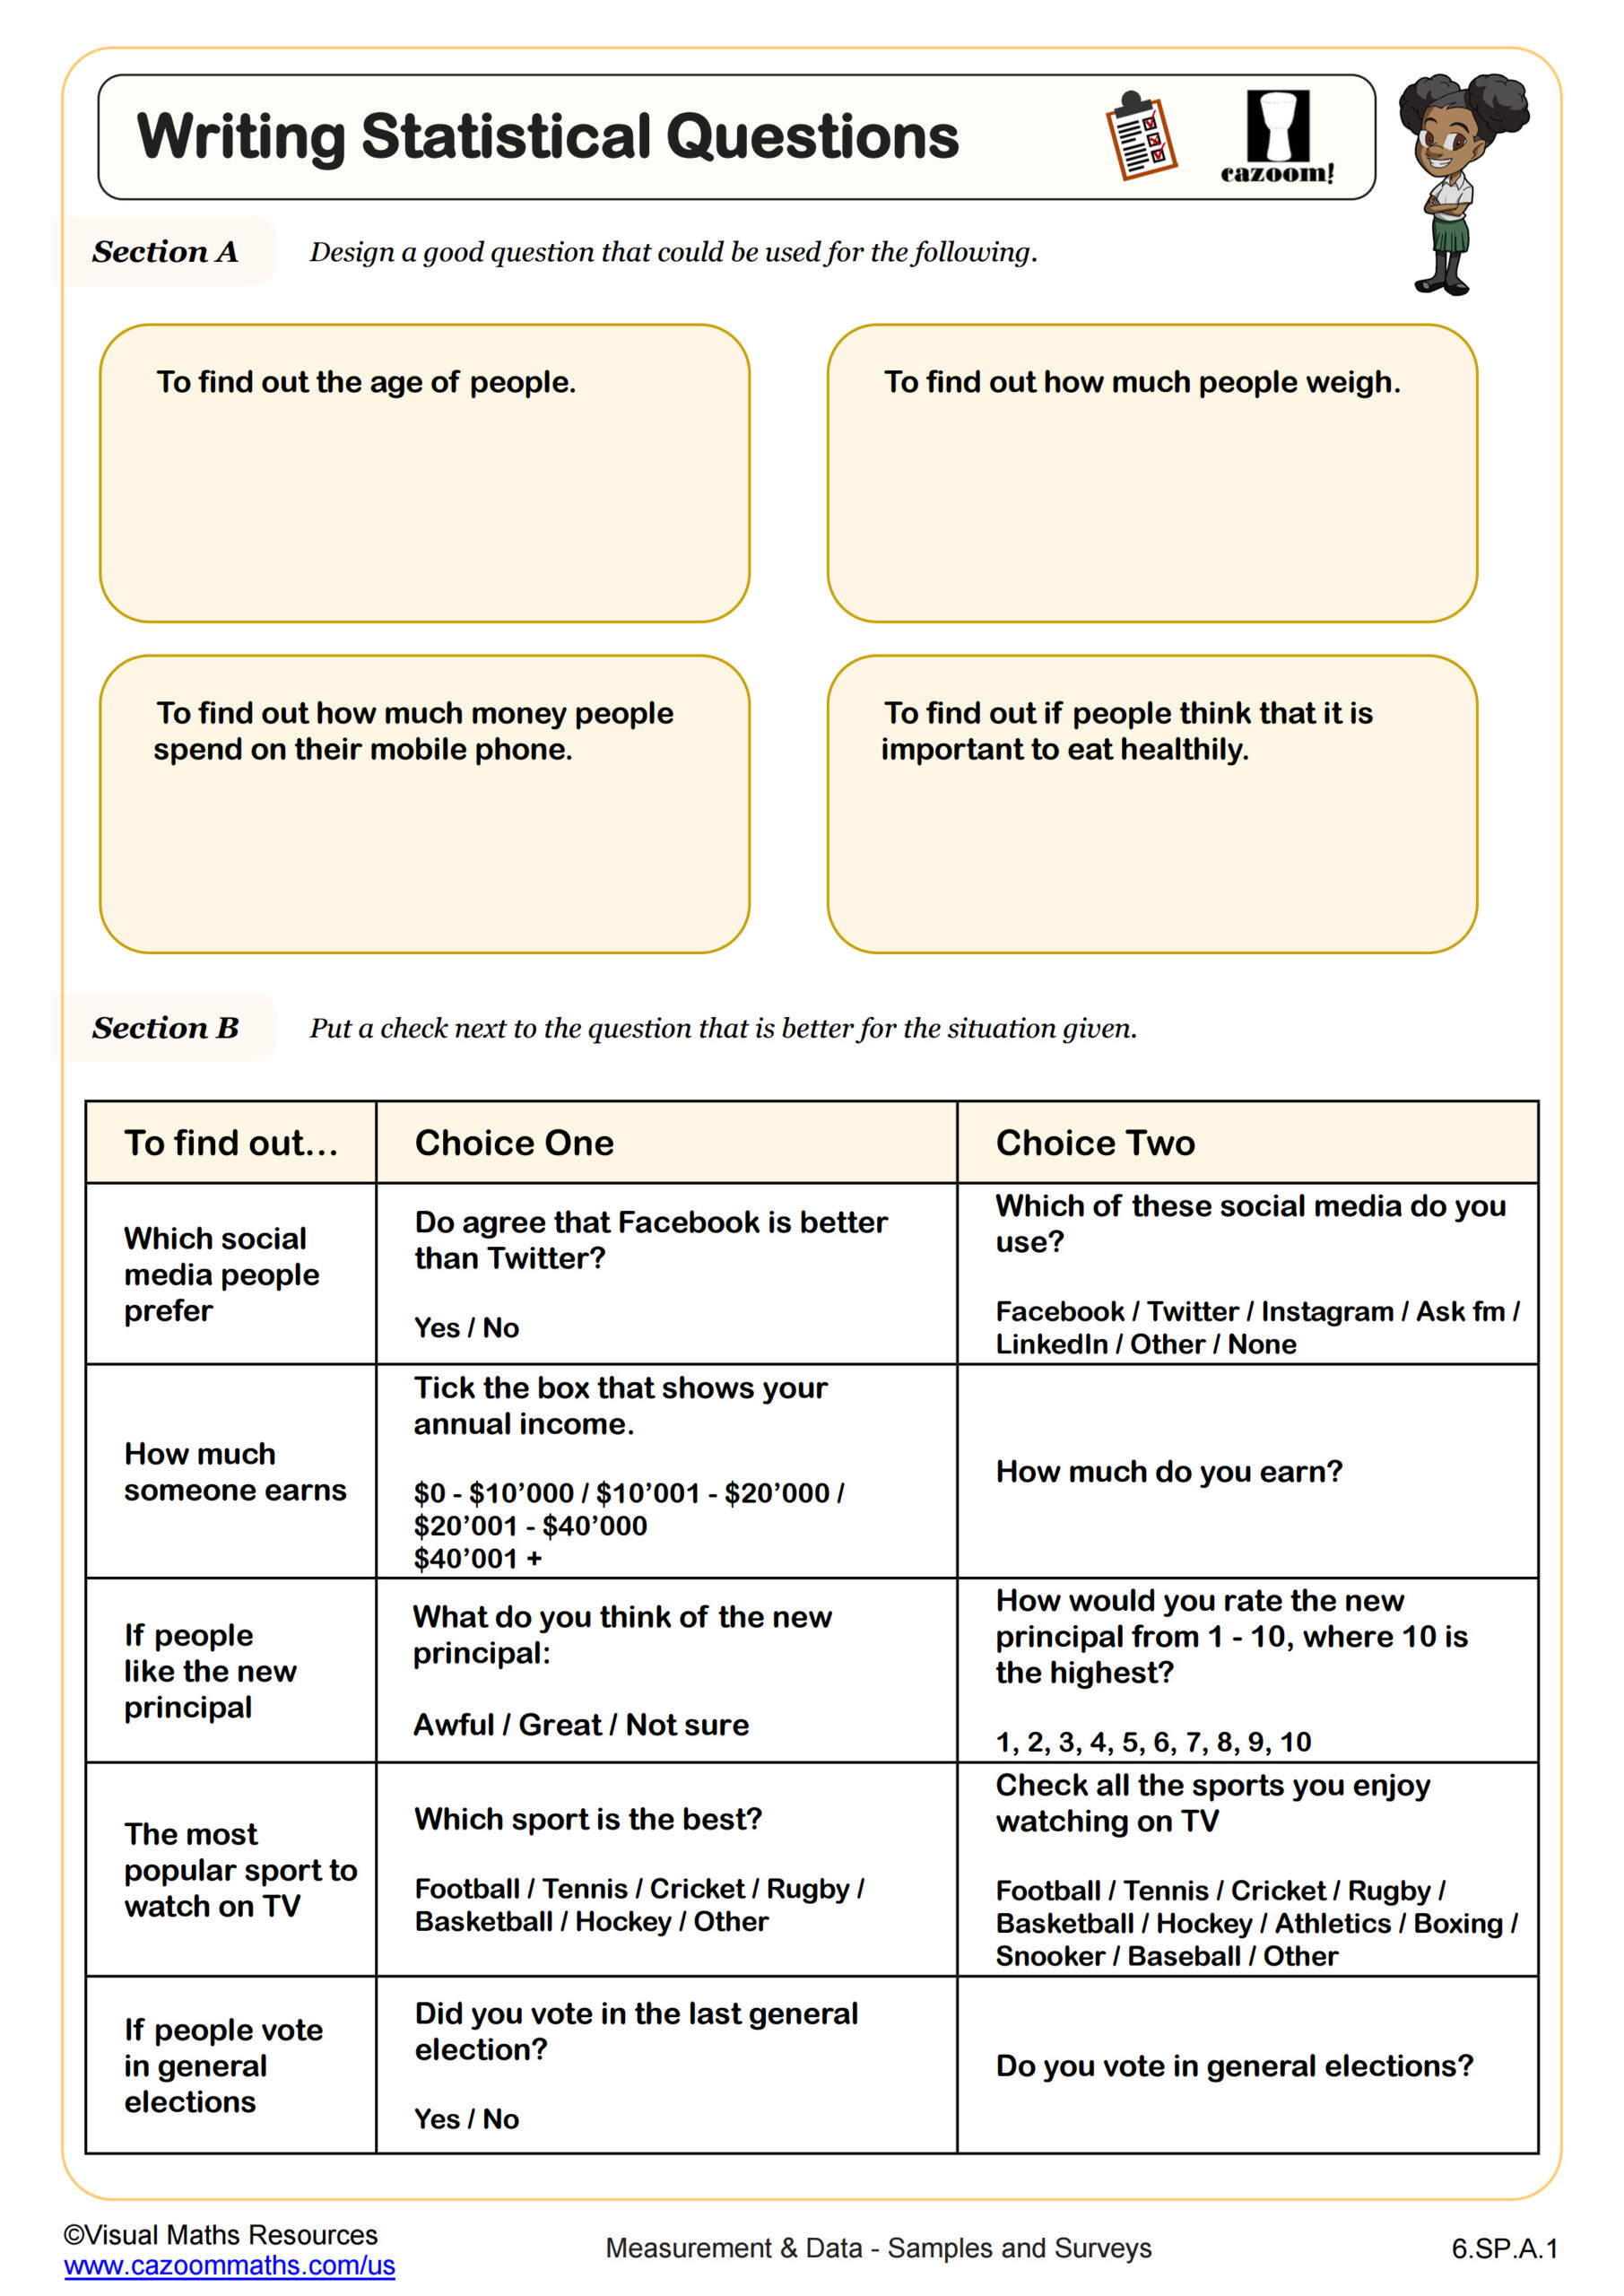
Teachers find that connecting worksheet problems to real classroom or school scenarios increases student engagement and comprehension. When students design surveys about actual topics like lunch preferences or homework time, they better understand concepts like sample size and question wording that affect results quality.
The most effective approach combines worksheet practice with hands-on data collection activities. Students can complete worksheet problems about survey design, then conduct their own mini-surveys and compare results with worksheet examples. This reinforces the connection between statistical concepts and real-world applications, particularly relevant as students encounter data analysis in science classes and STEM projects throughout their academic careers.