6th Grade Stem-and-Leaf Diagrams Worksheets
All worksheets are created by the team of experienced teachers at Cazoom Math.
Want Better Results? Use Our Printable PDF Stem-and-Leaf Diagrams Worksheets Today
Students connect their elementary school data skills to more sophisticated analysis methods that they will learn in middle school. They learn to organize numbers systematically while preserving individual data values. This visual approach helps students clearly see patterns, clusters, and outliers. Regular practice with stem and leaf plots strengthens number sense and understanding of place value.
These diagrams prepare students for box plots and histograms in 7th grade. The worksheets progress from simple two-digit numbers to complex decimal values. Students develop critical thinking as they compare data sets and draw conclusions. Each problem reinforces the connection between data collection and meaningful interpretation.
Classroom-Ready Measurement and Data Topics for Lessons, Homework, and Revision
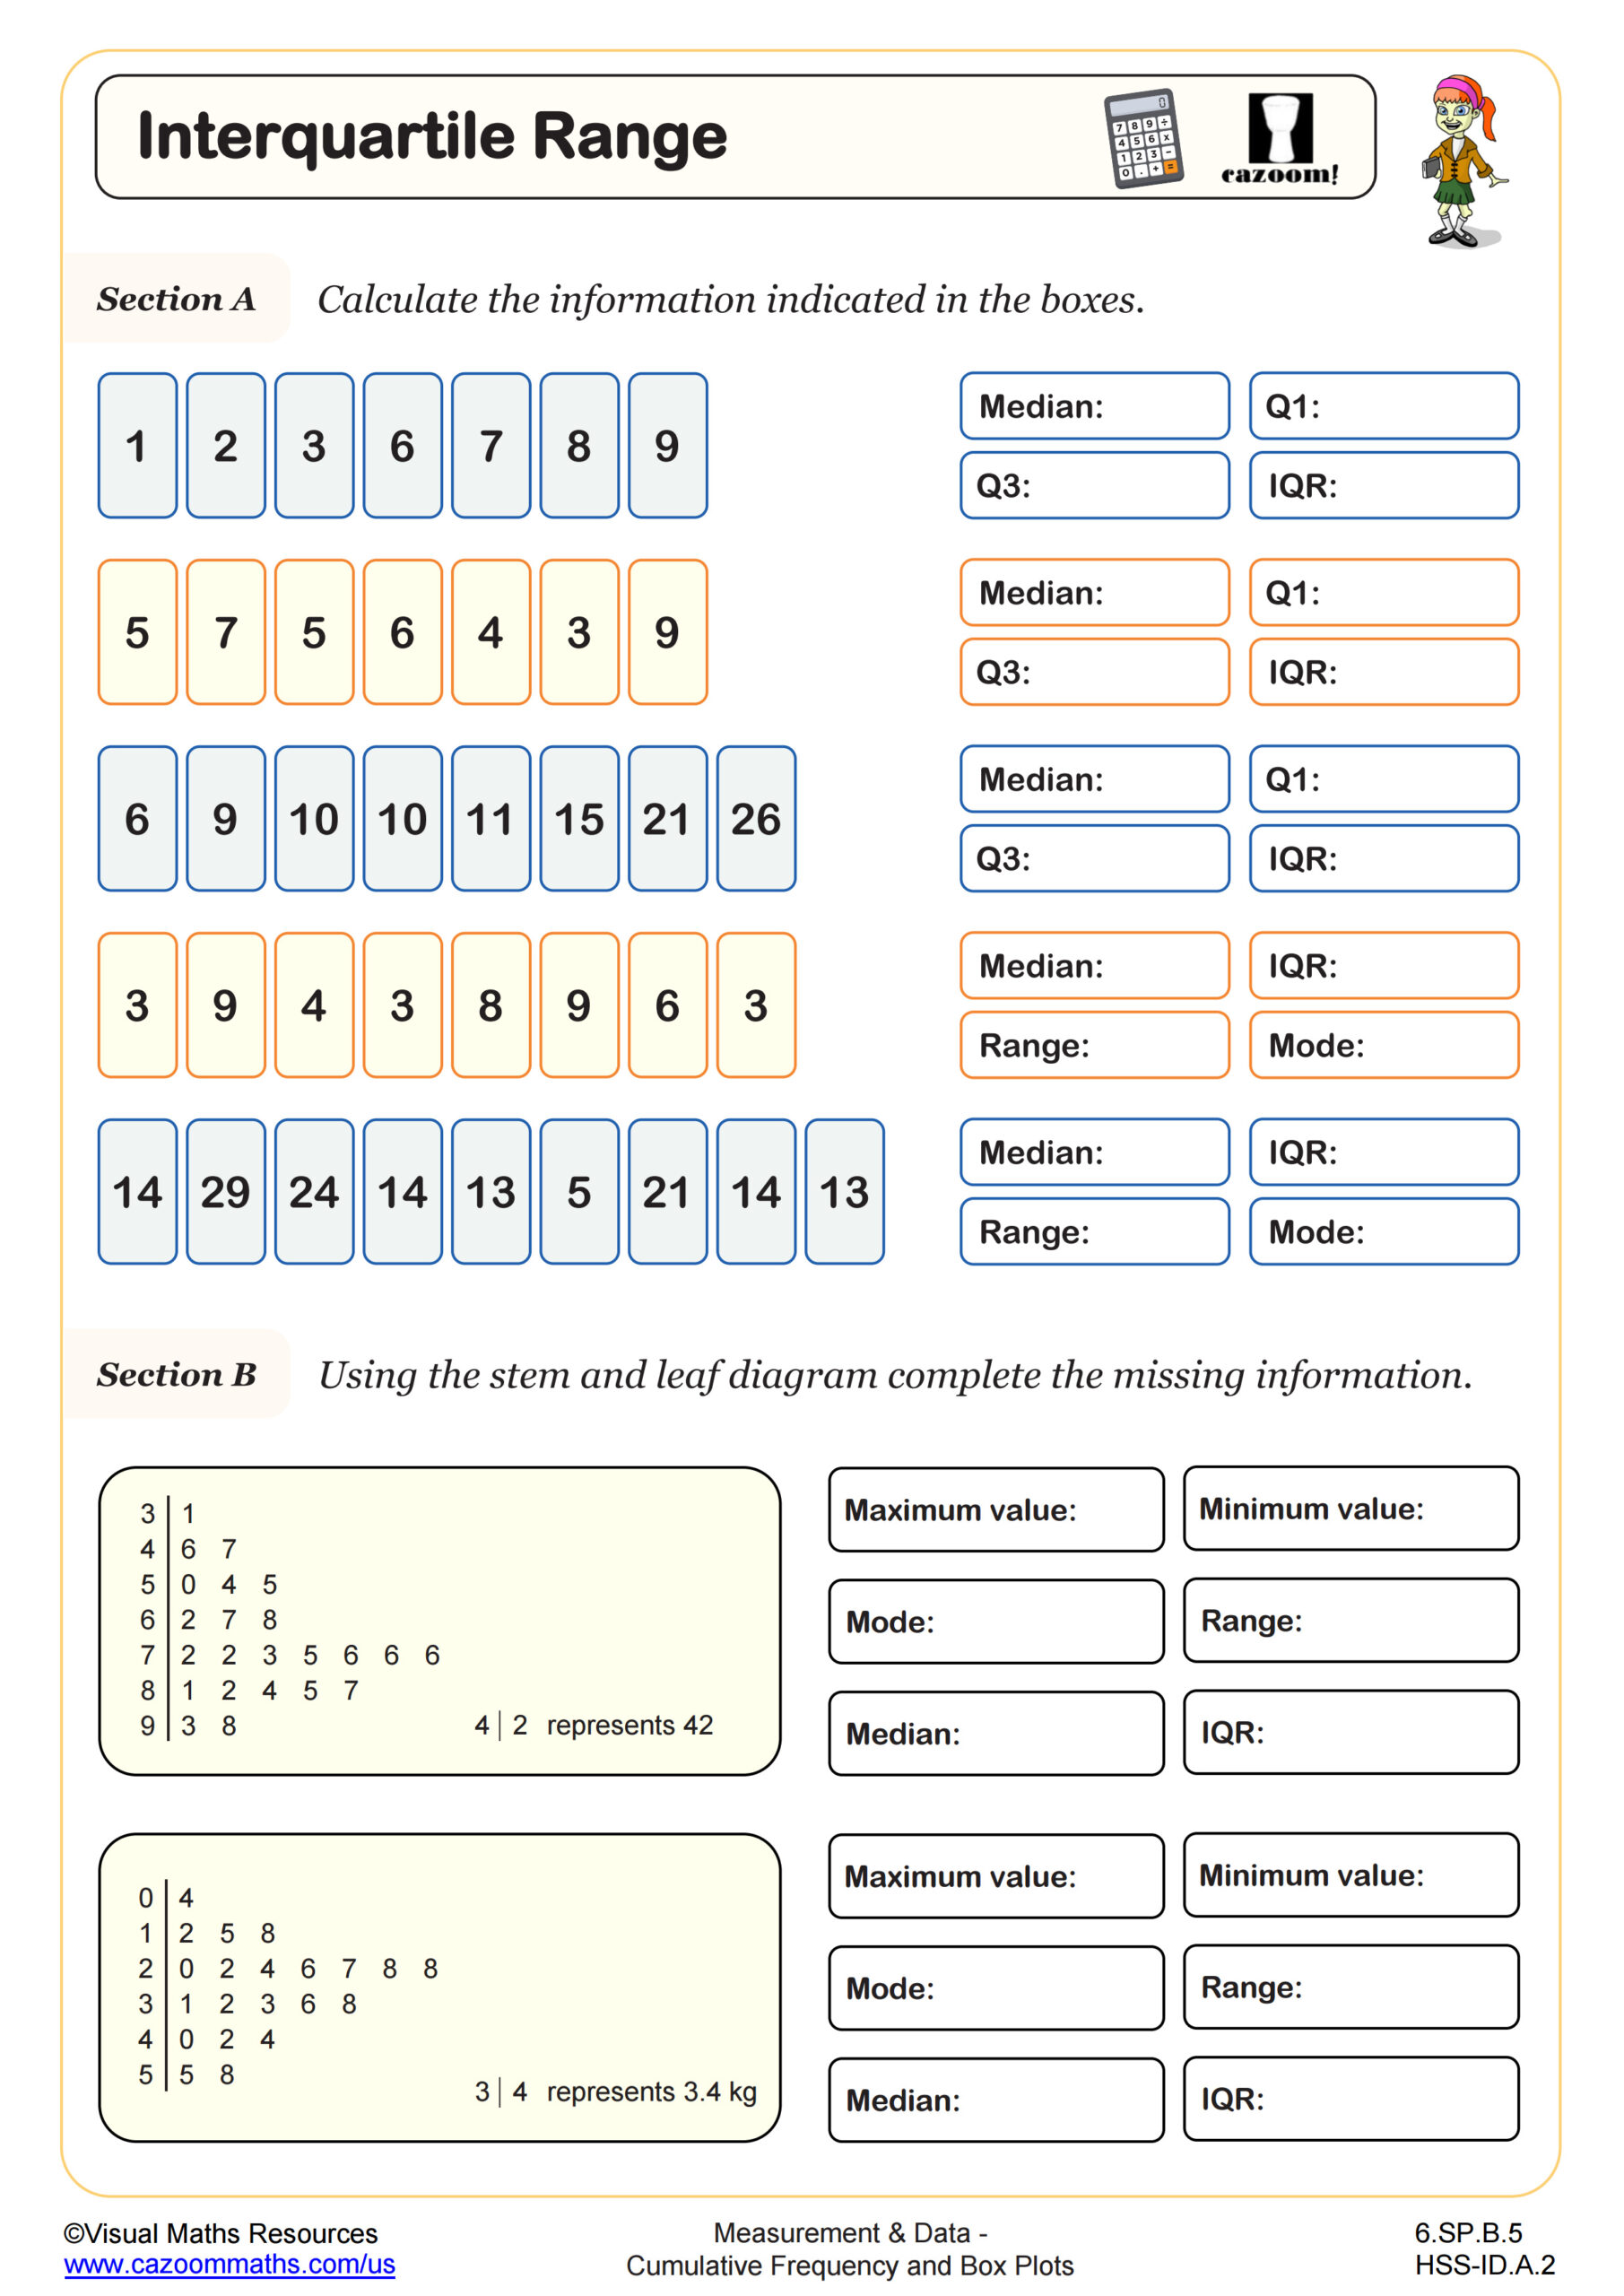
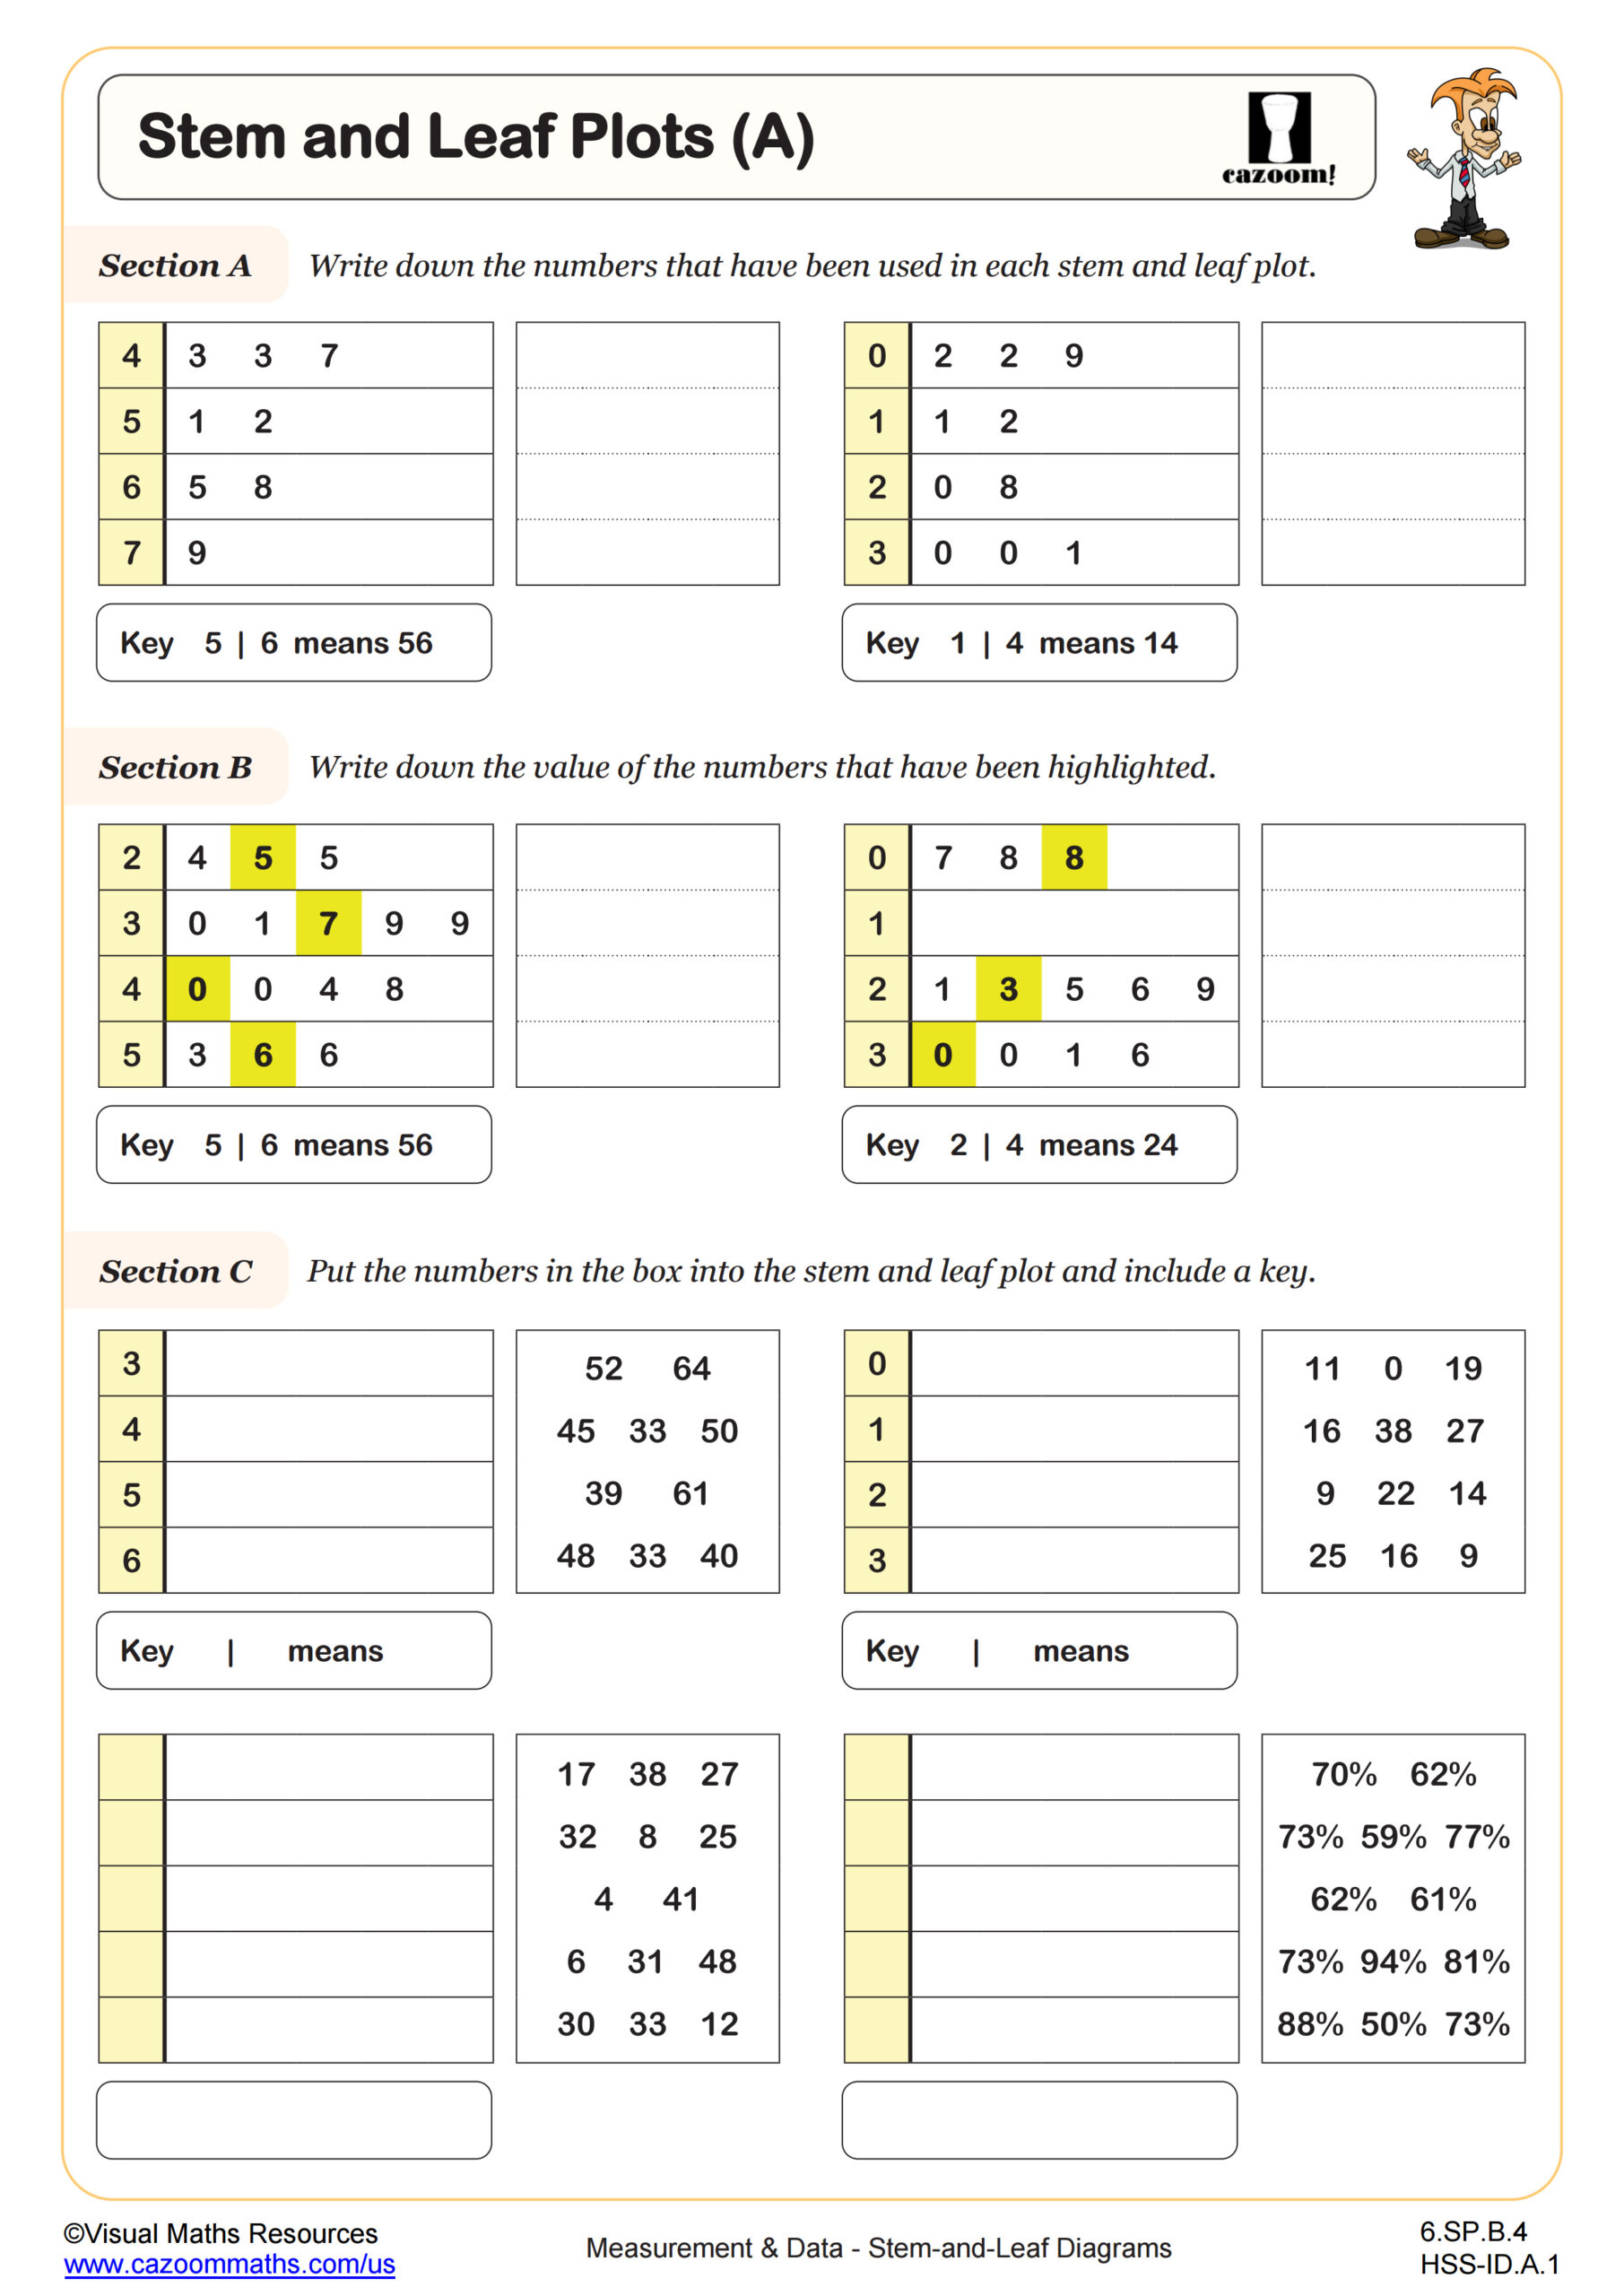
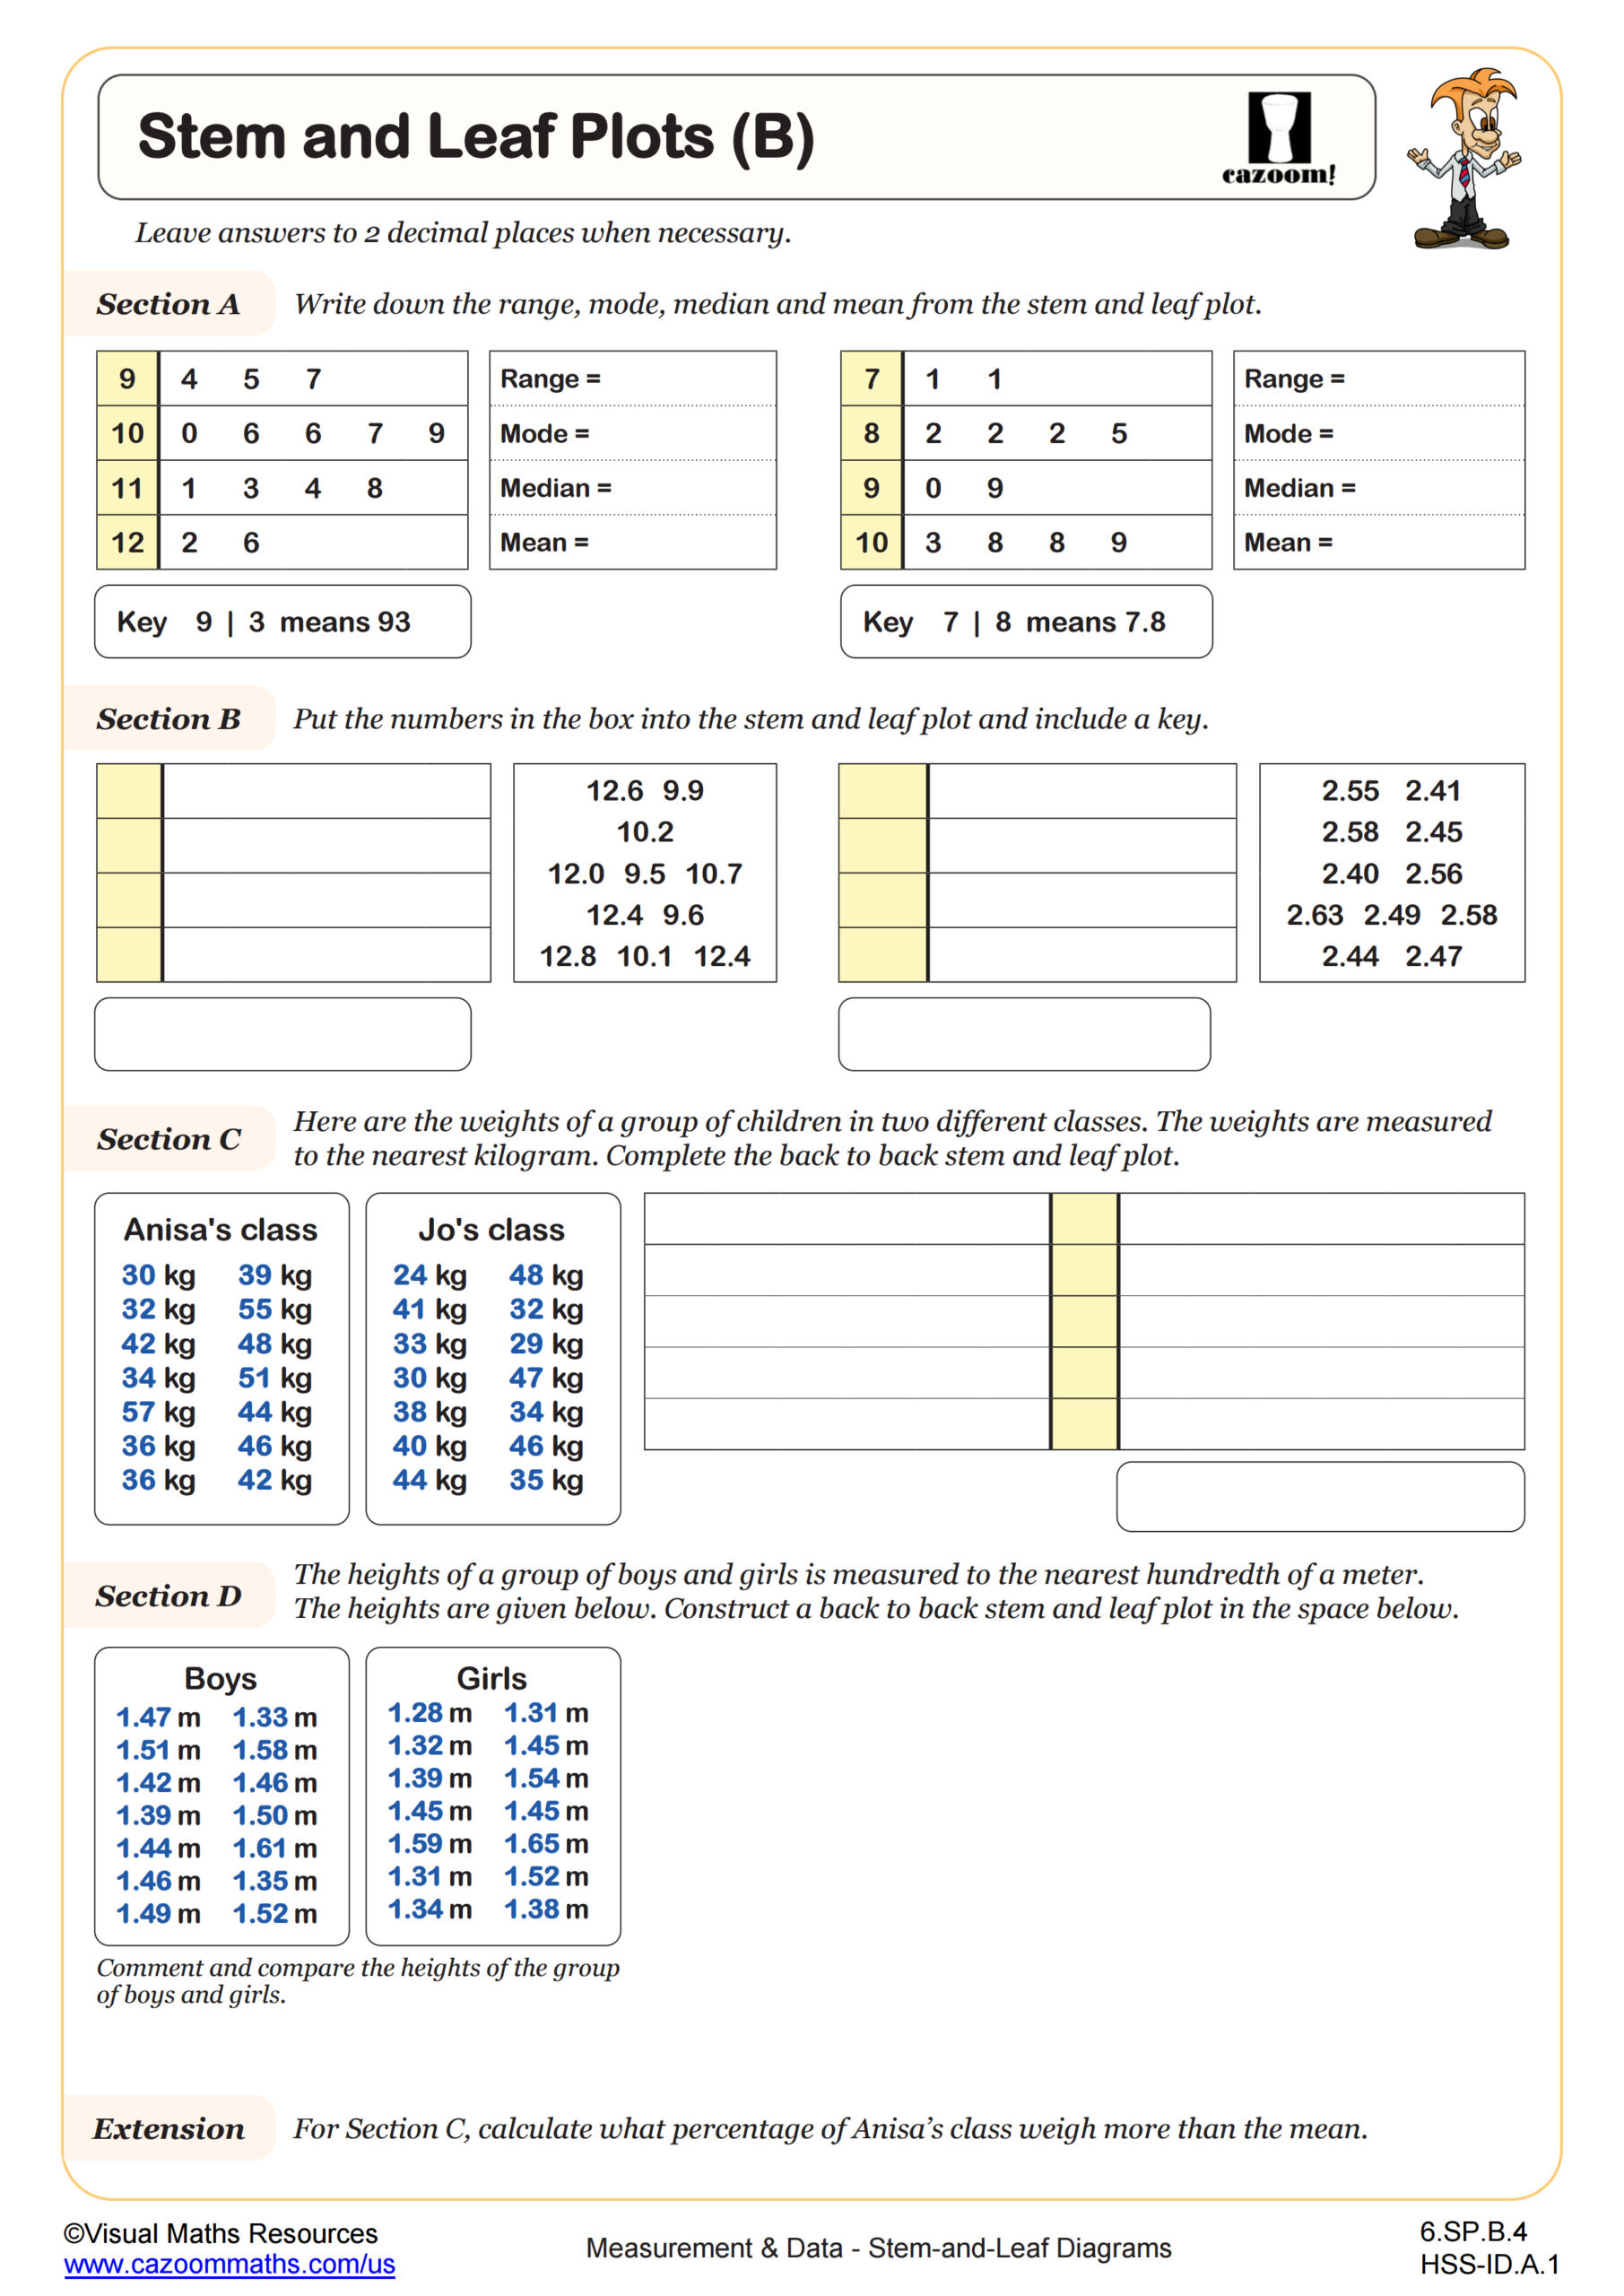
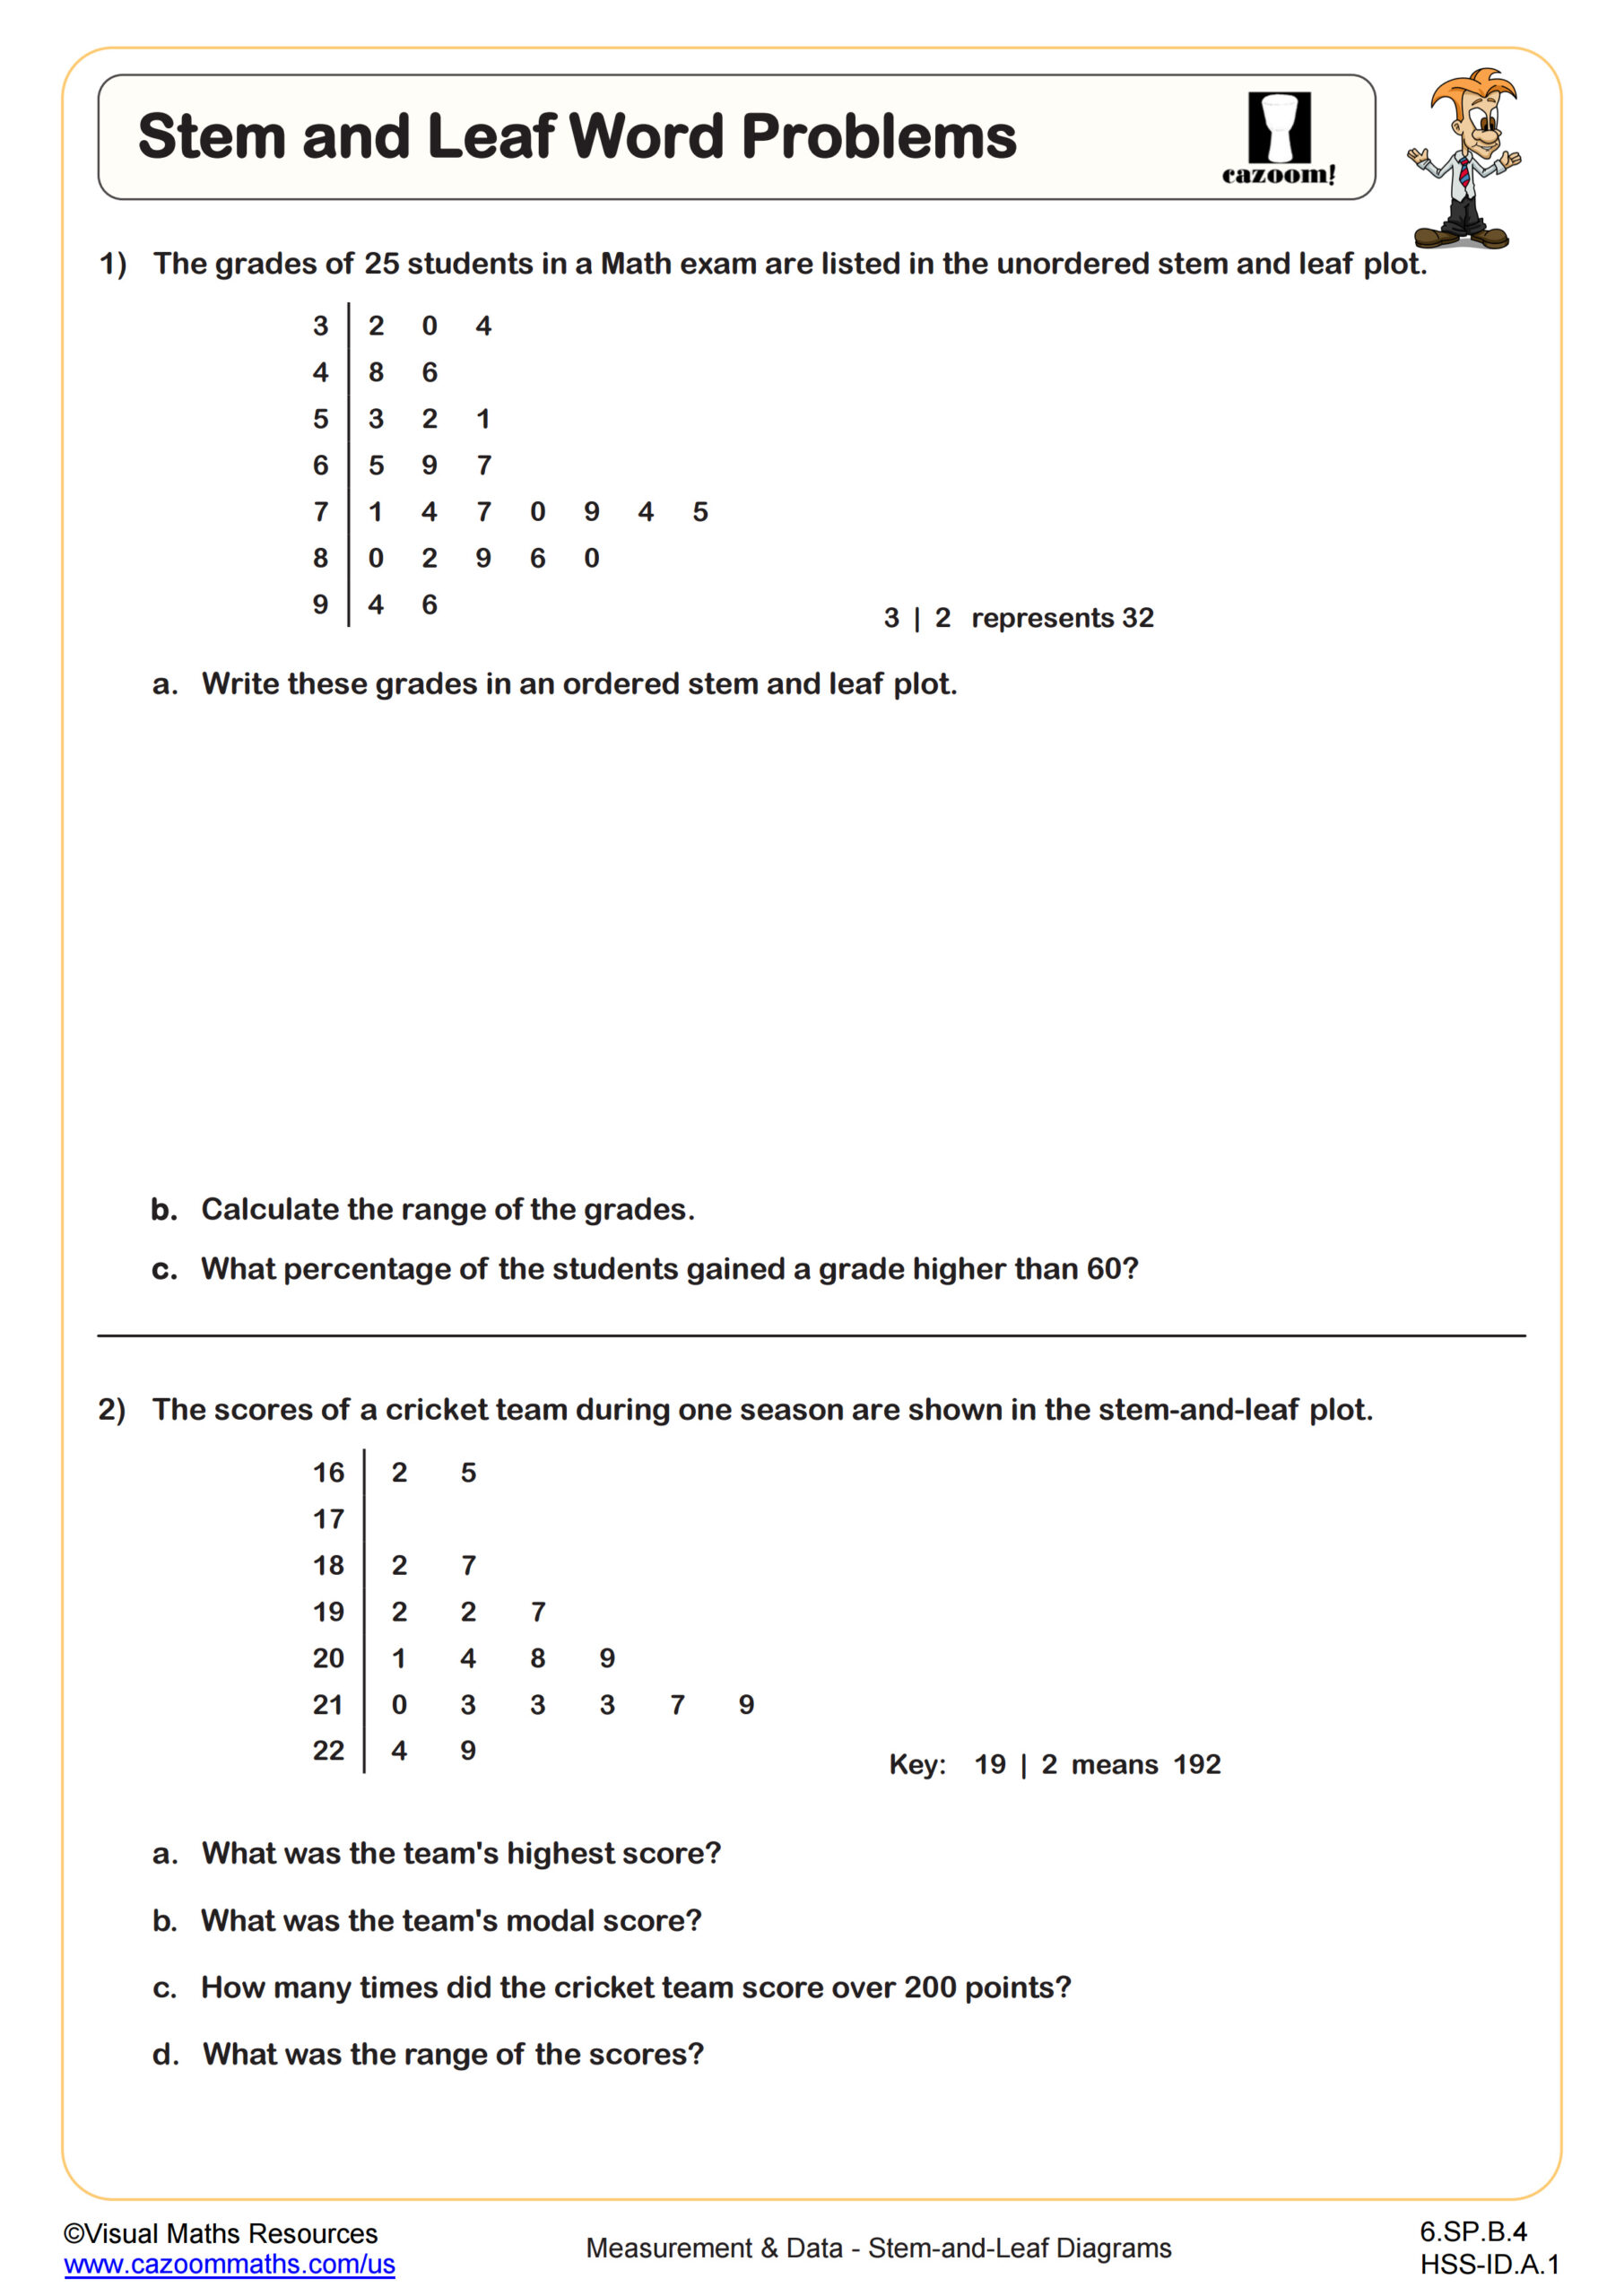
These worksheets guide students from real-world examples to a confident understanding of statistical data representation. Learners begin with familiar contexts like test scores and measurements, then progress to creating and interpreting stem-and-leaf plots independently. Visual models help bridge concrete experiences to abstract concepts such as quartiles and interquartile range. Each worksheet includes detailed, step-by-step answer keys that clearly explain the reasoning. This collection strengthens data interpretation, comparison, and problem-solving skills through structured, hands-on statistical practice.
Traditional Lessons or Worksheets? Why Our Year 6 Stem-and-Leaf Diagrams Work Best
Teachers appreciate the clear progression from introductory concepts to challenging applications. The worksheets offer natural differentiation opportunities for diverse classroom needs. Quick-start problems allow students to practice independently while teachers support their peers. Extension questions challenge advanced learners to explore deeper statistical relationships.
The comprehensive solutions provide an explanation of the reasoning behind each step of the process. Teachers save valuable time with pre-made assessments ready for immediate use. The format works equally well for homework, classwork, or quick formative checks. Regular retrieval practice activities help students retain these critical data skills. Cazoom Math worksheets connect mathematical concepts to students' daily experiences and interests.
Where Stem and Leaf Skills Apply Beyond the Classroom
Students use these organizing techniques to compare sports statistics and game scores. They analyze weather data to understand climate patterns in their area. Scientists employ similar methods to record experimental observations and measurements. These visual tools help people quickly make sense of large amounts of information.
• Compare player statistics in fantasy sports
• Track monthly bills and expenses
• Record plant growth in experiments
• Evaluate product ratings when shopping