7th Grade Statistics and Probability Worksheets
All worksheets are created by the team of experienced teachers at Cazoom Math.
What topics do 7th grade statistics worksheets typically cover?
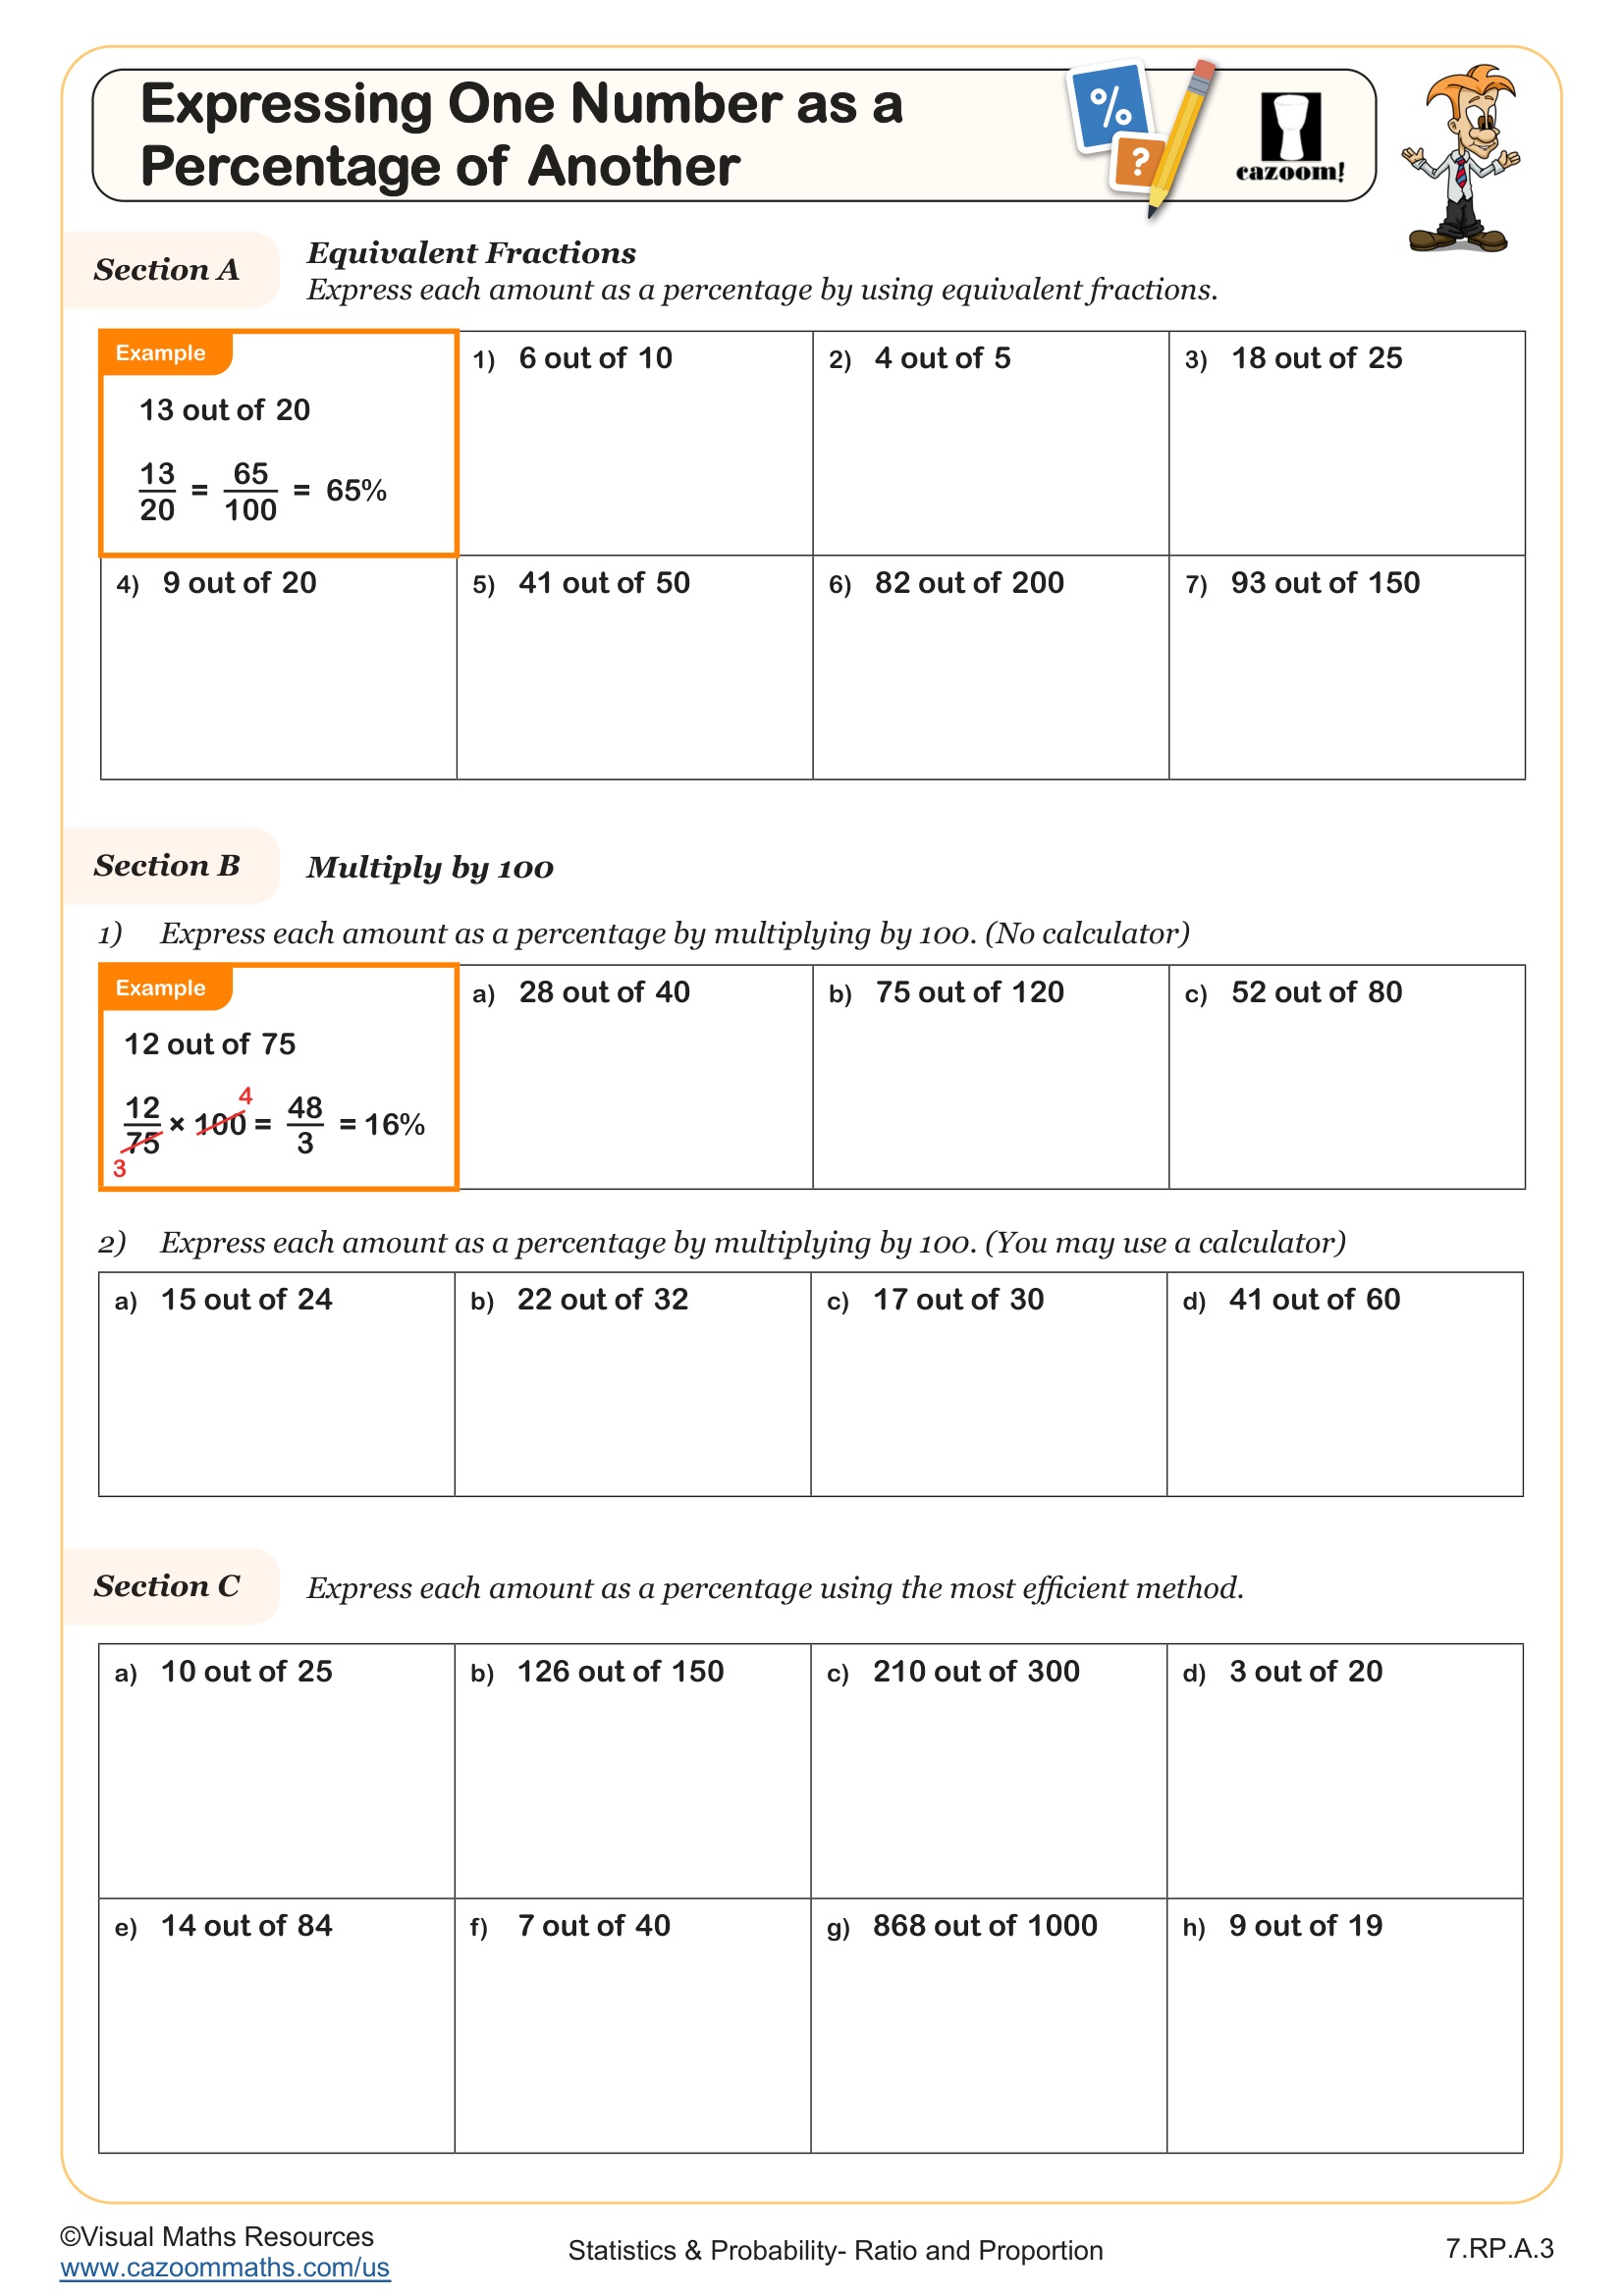
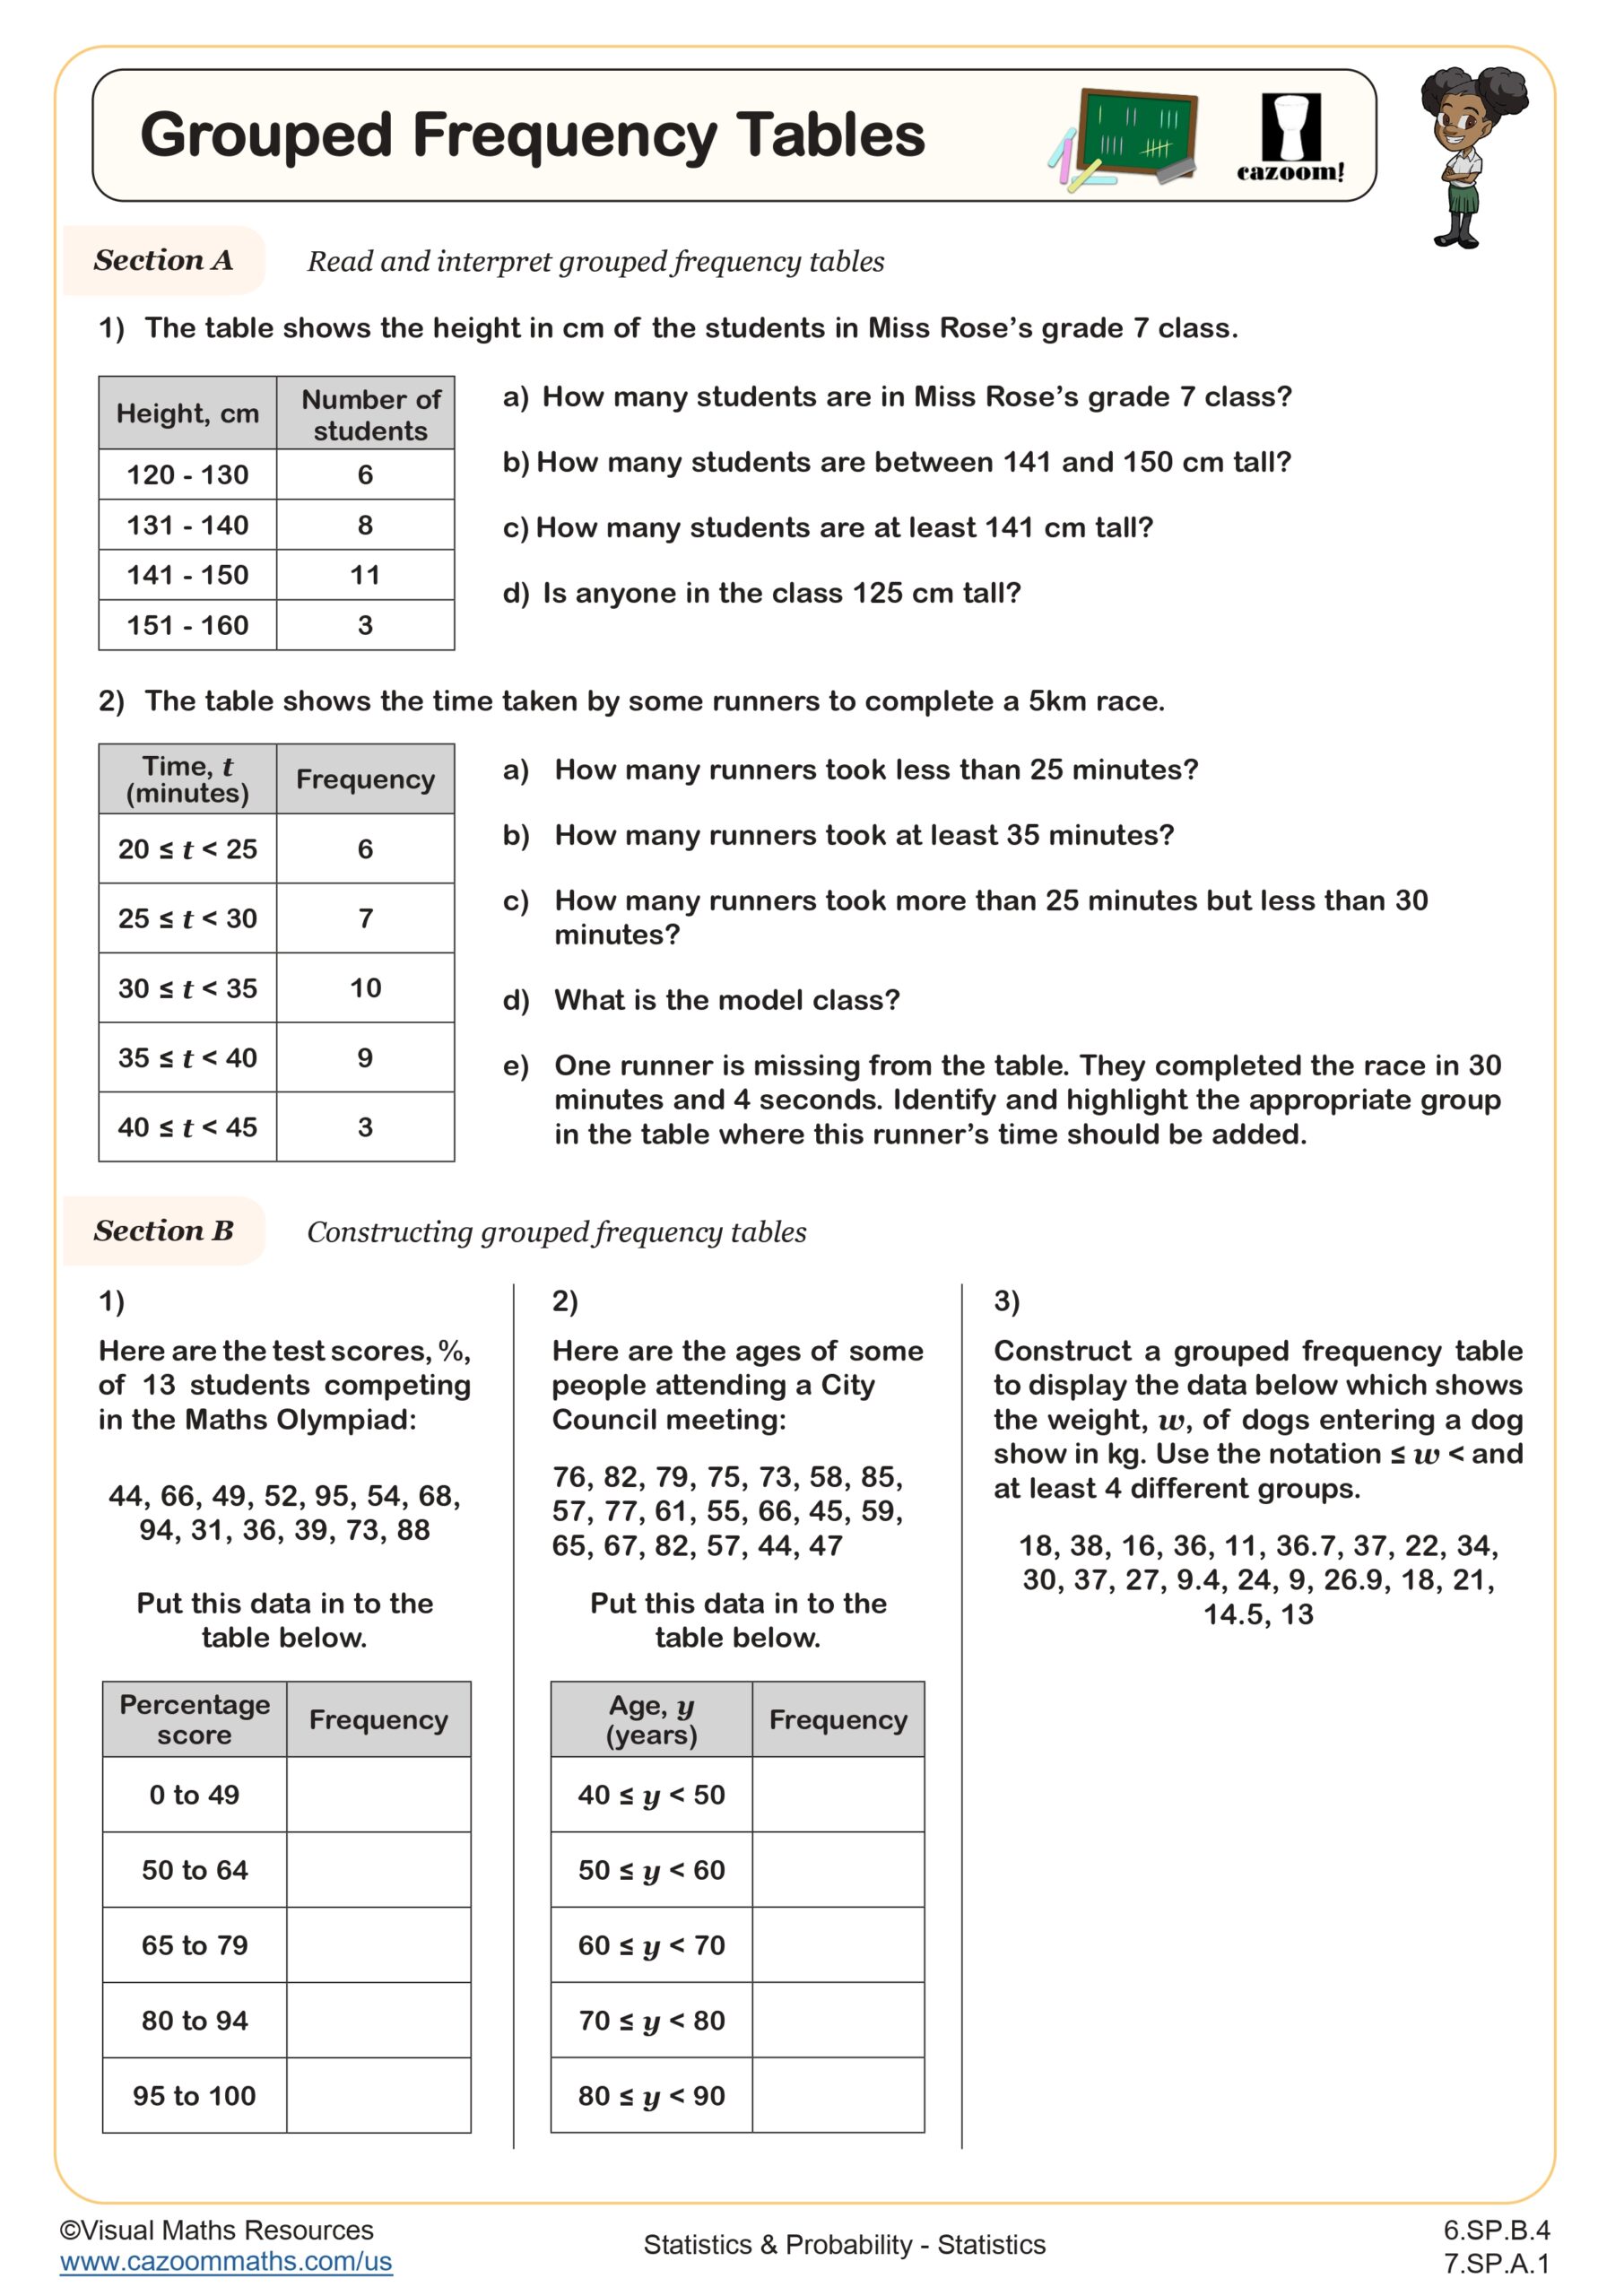
Statistics worksheets for 7th graders align with Common Core standard 7.SP, focusing on probability concepts, sampling populations, and drawing inferences from data. Students work with measures of central tendency (mean, median, mode), measures of variability (range, mean absolute deviation), and various data displays including histograms, box plots, and scatter plots.
Teachers often observe that students struggle most with understanding when to use median versus mean, particularly with outliers present in data sets. The worksheets provide multiple contexts for this comparison, helping students recognize that median better represents typical values when extreme data points skew the mean, a concept crucial for interpreting real-world statistics.
How do these worksheets prepare students for advanced statistics courses?
These 7th grade materials establish the statistical reasoning foundation students need for Algebra I statistics units and high school AP Statistics. Students develop skills in data collection, organization, and interpretation that connect directly to more complex concepts like correlation, regression, and hypothesis testing introduced in later grades.
Many teachers find that students who master variability concepts in 7th grade show significantly better performance in high school when analyzing distributions and making statistical inferences. The worksheets emphasize understanding why measures of center and spread matter, rather than just computational procedures, preparing students for the conceptual depth required in advanced coursework.
What makes probability problems challenging for 7th grade students?
Seventh graders frequently confuse theoretical and experimental probability, especially when simulation results don't match expected outcomes. They often expect experimental probability to exactly equal theoretical probability in small samples, leading to misconceptions about randomness and long-run behavior that these worksheets systematically address.
Teachers notice students commonly struggle with compound probability events, particularly distinguishing between independent and dependent situations. The worksheets provide scaffolded practice moving from simple single-event probability through more complex scenarios, helping students develop intuition about probability concepts that connect to genetics, weather prediction, and quality control applications in STEM fields.
How can teachers use these worksheets most effectively in their statistics instruction?
Teachers find these worksheets work best when used strategically throughout the statistics unit rather than as isolated practice. Beginning each topic with concrete manipulatives or simulations, then transitioning to worksheet practice helps students connect abstract concepts to hands-on experiences, improving retention and understanding of statistical principles.
Many educators use the answer keys to create peer checking opportunities, where students explain their reasoning to classmates before comparing with the provided solutions. This approach reveals common misconceptions early and allows teachers to address conceptual gaps before moving to more complex applications, particularly important given how statistical concepts build upon each other throughout the unit.