7th Grade Two-Way Tables and Pictograms Worksheets
All worksheets are created by the team of experienced teachers at Cazoom Math.
How do two-way tables support a 7th grade data analysis science project?
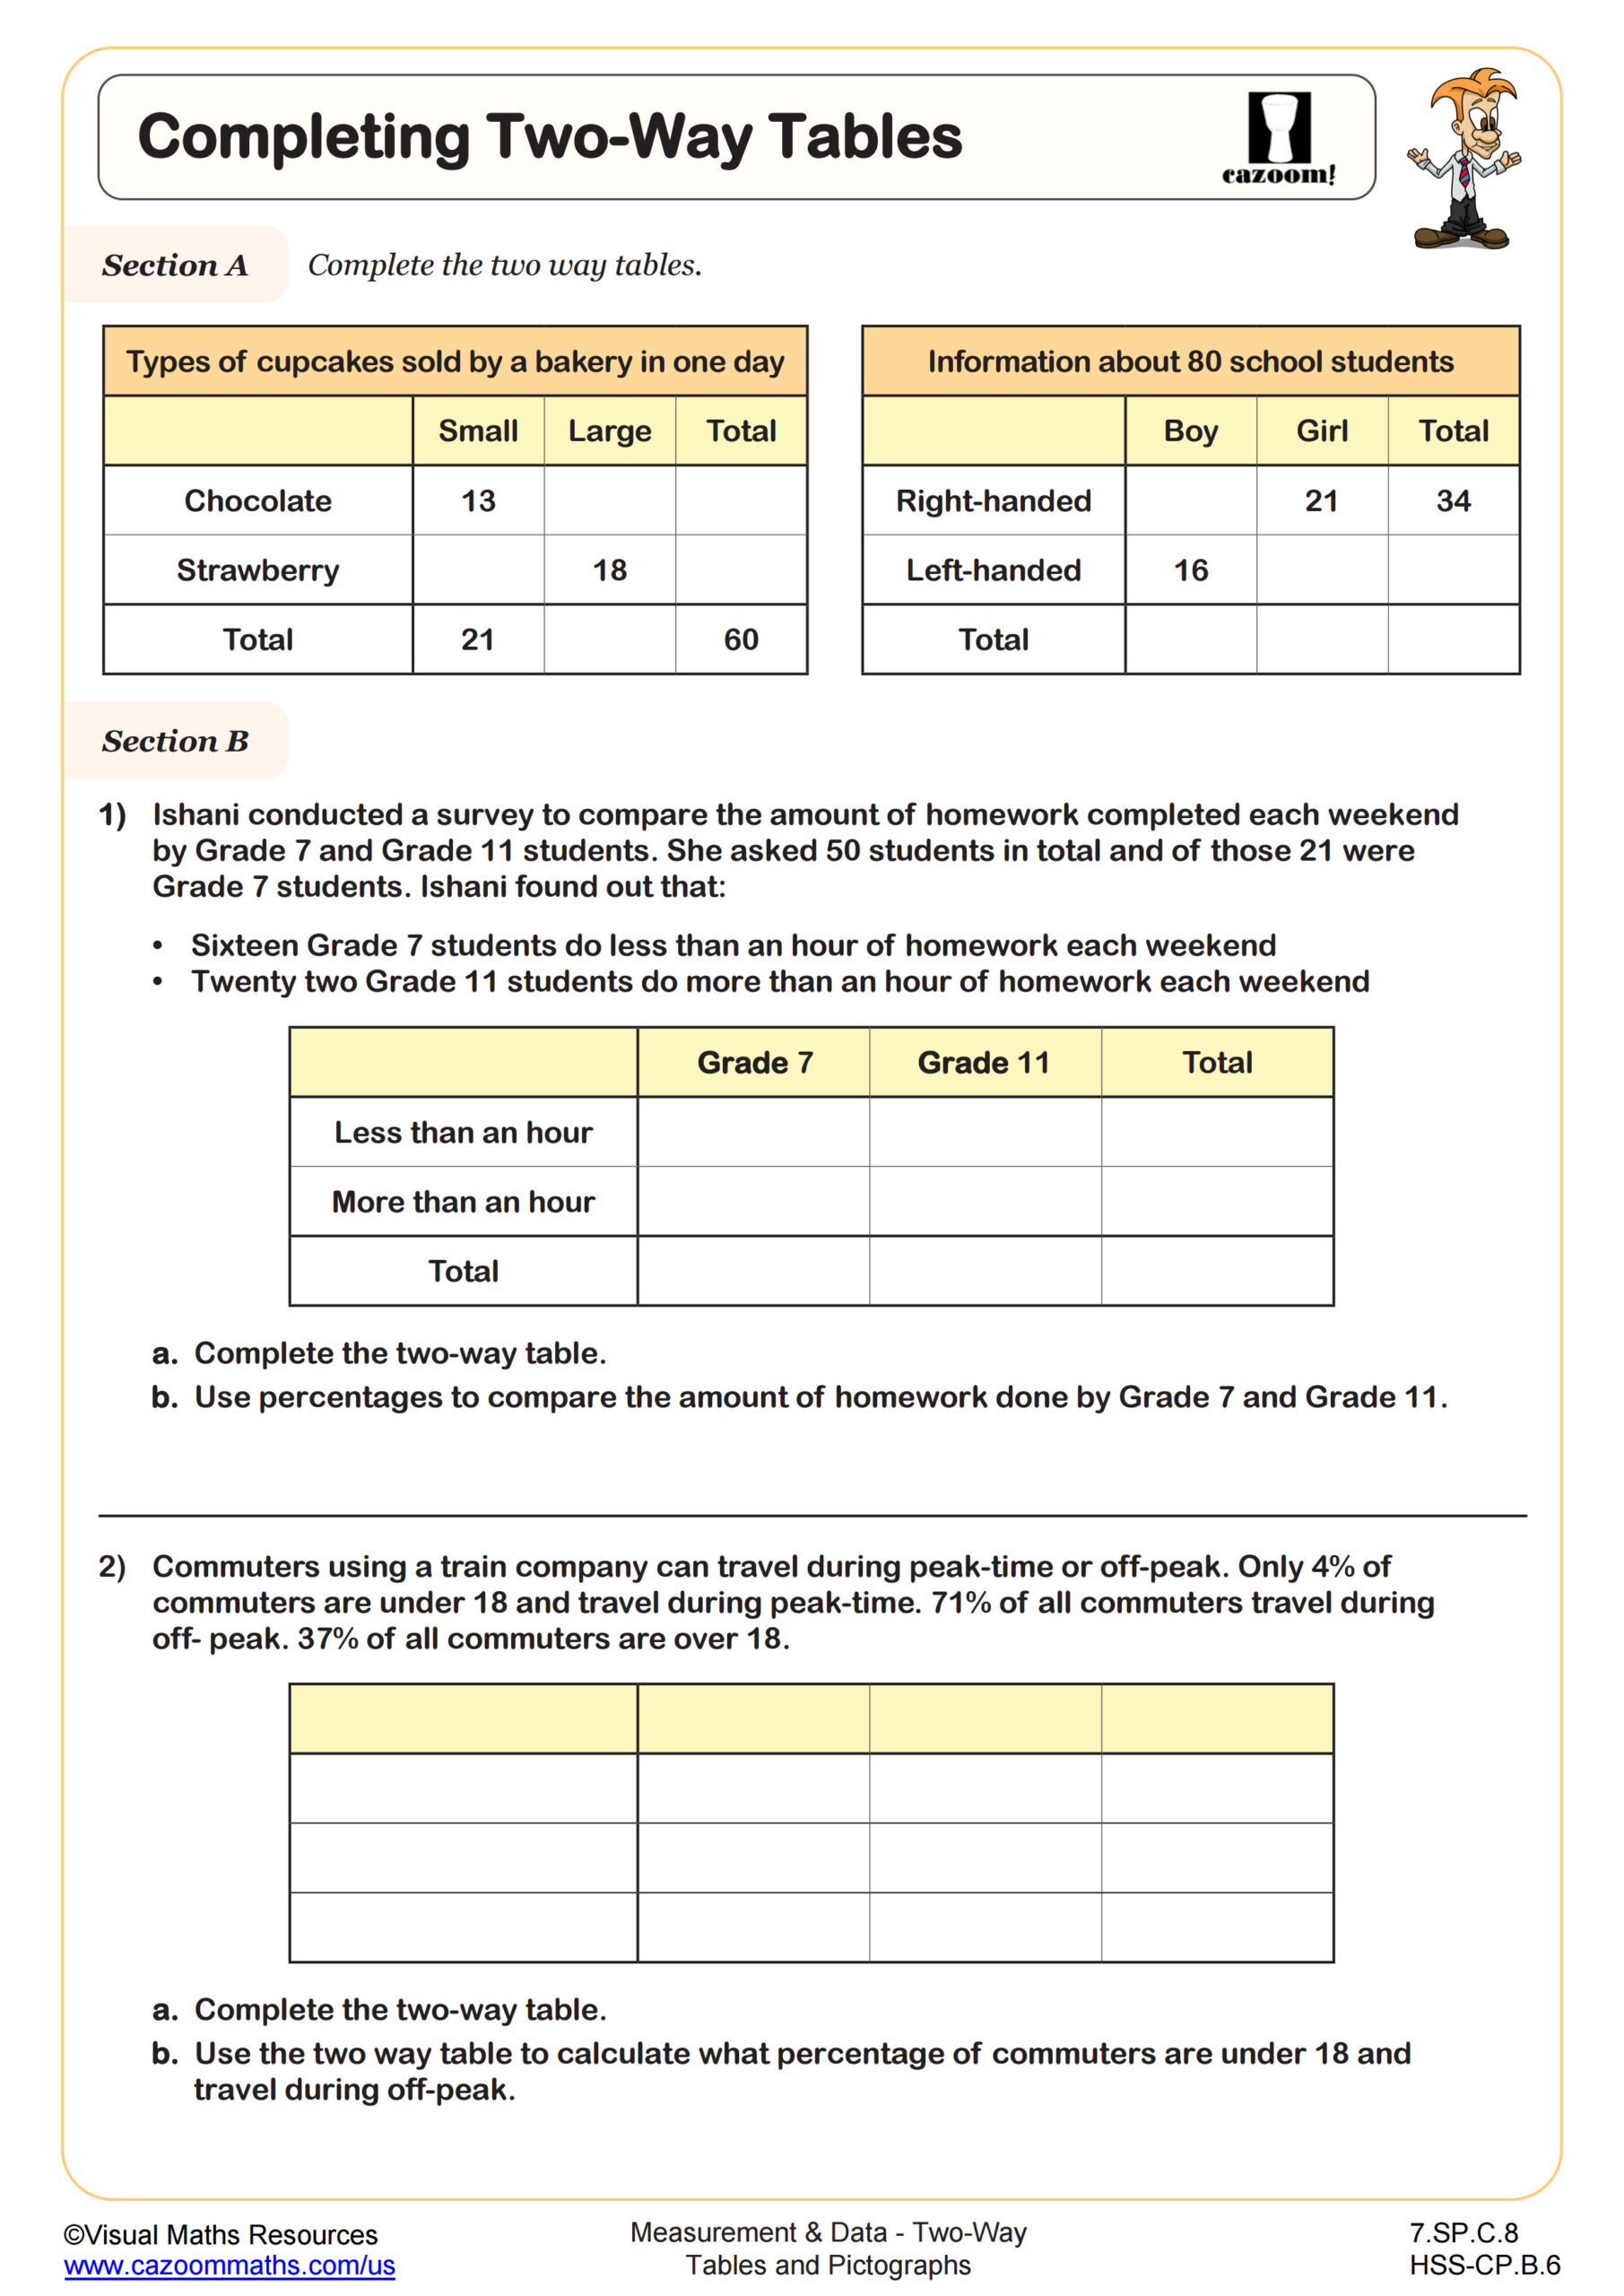
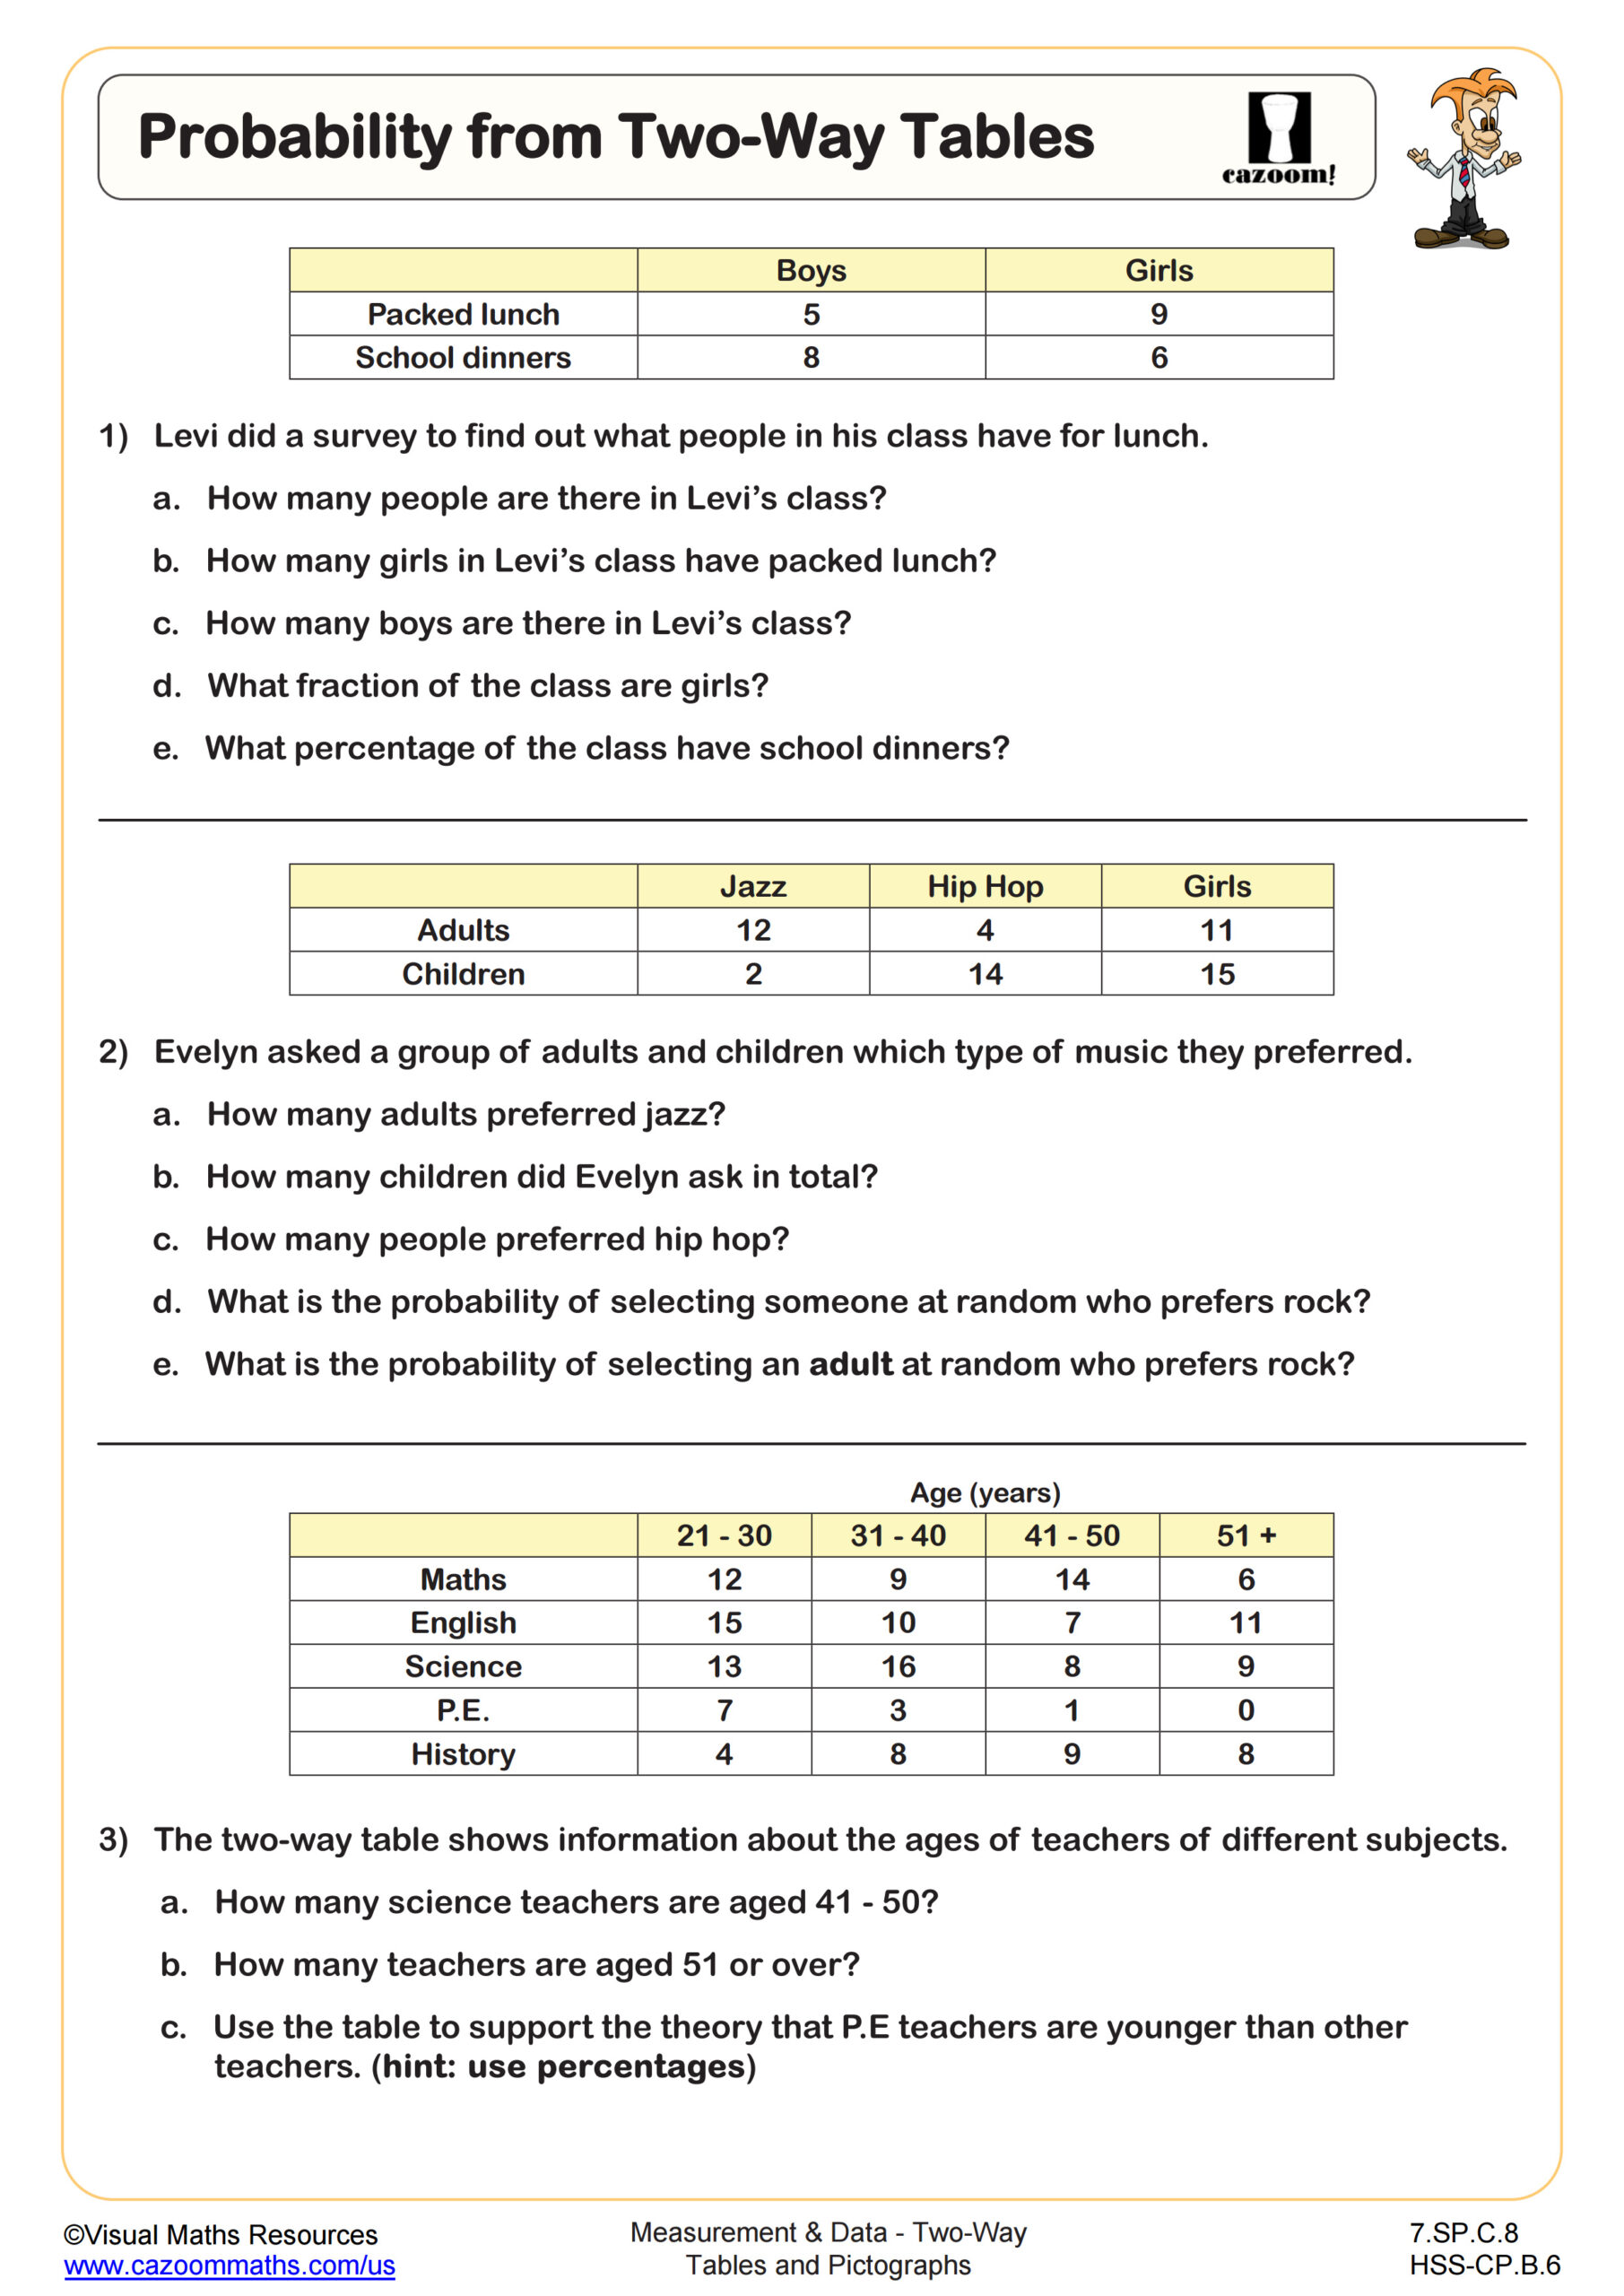
Two-way tables provide an organized method for students to categorize and analyze relationships between two variables in their science investigations. According to Common Core Standard 7.SP.3, seventh graders must investigate patterns of association in bivariate categorical data, making these tables fundamental for science project data collection and analysis.
Teachers observe that students completing science projects often collect data naturally suited for two-way tables, such as plant growth under different light conditions or survey responses by gender. The visual organization helps students identify patterns and draw conclusions that strengthen their scientific reasoning and presentation skills.
What data analysis skills should 7th graders master before high school?
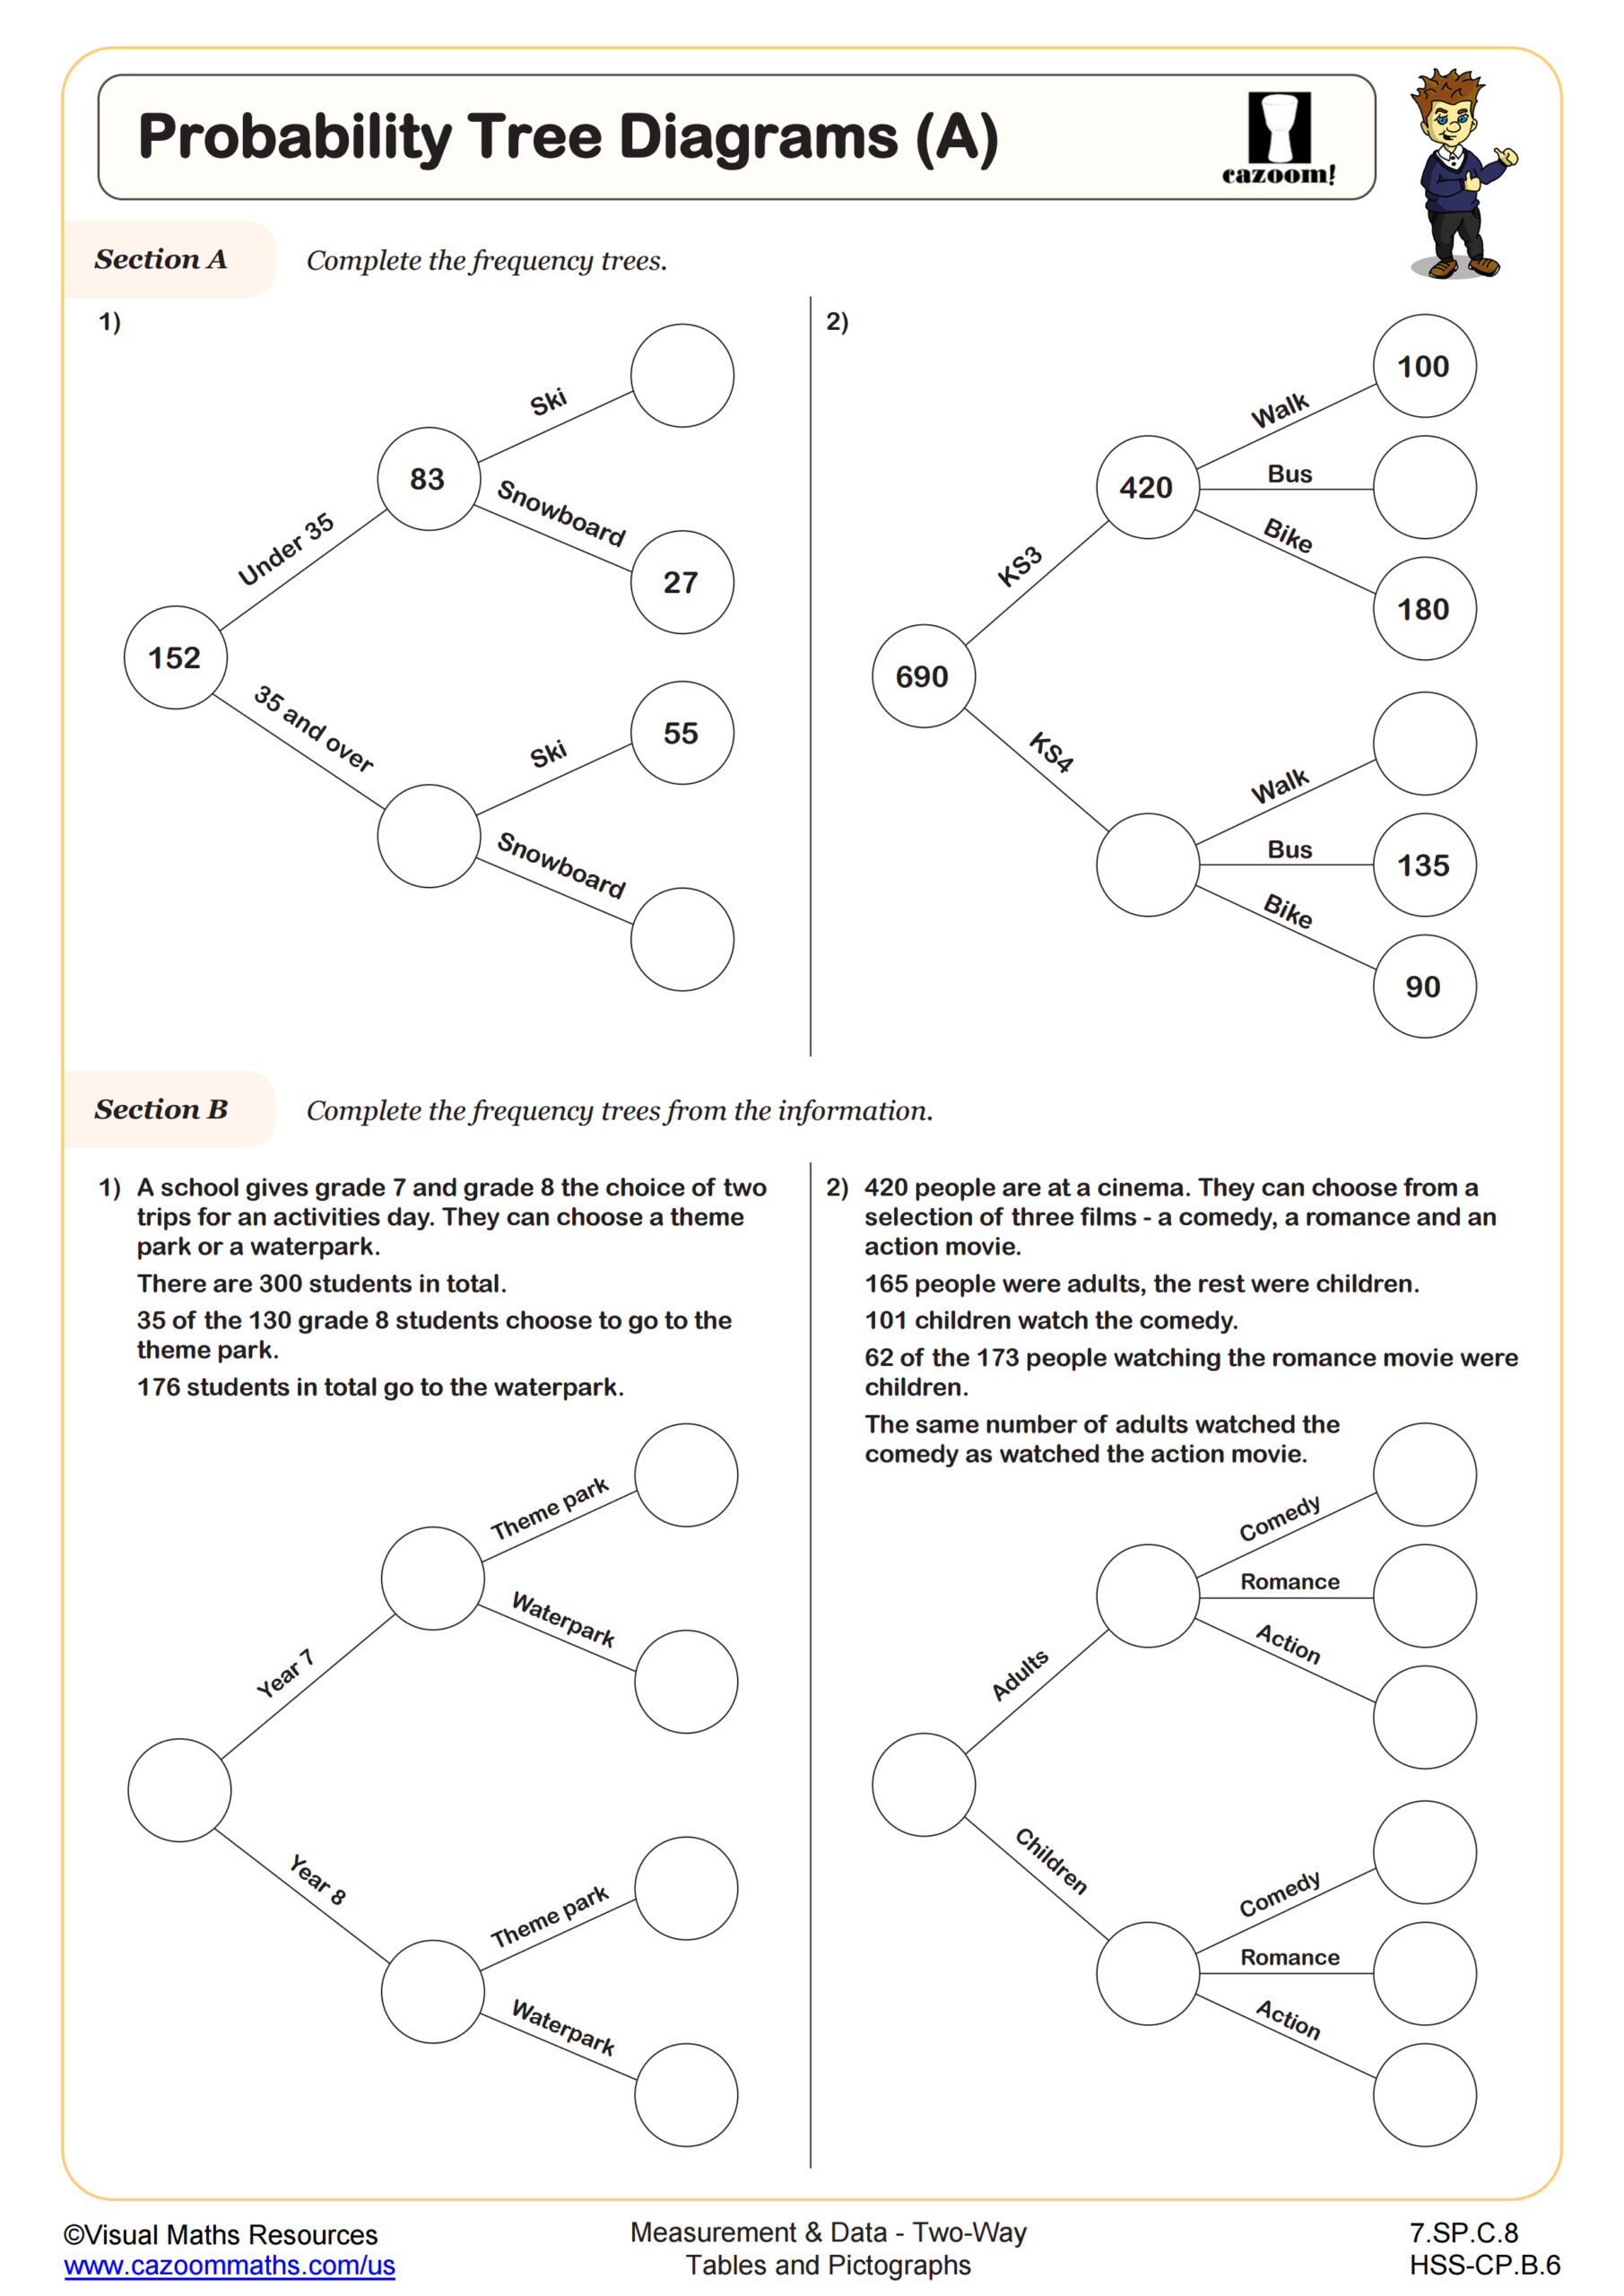
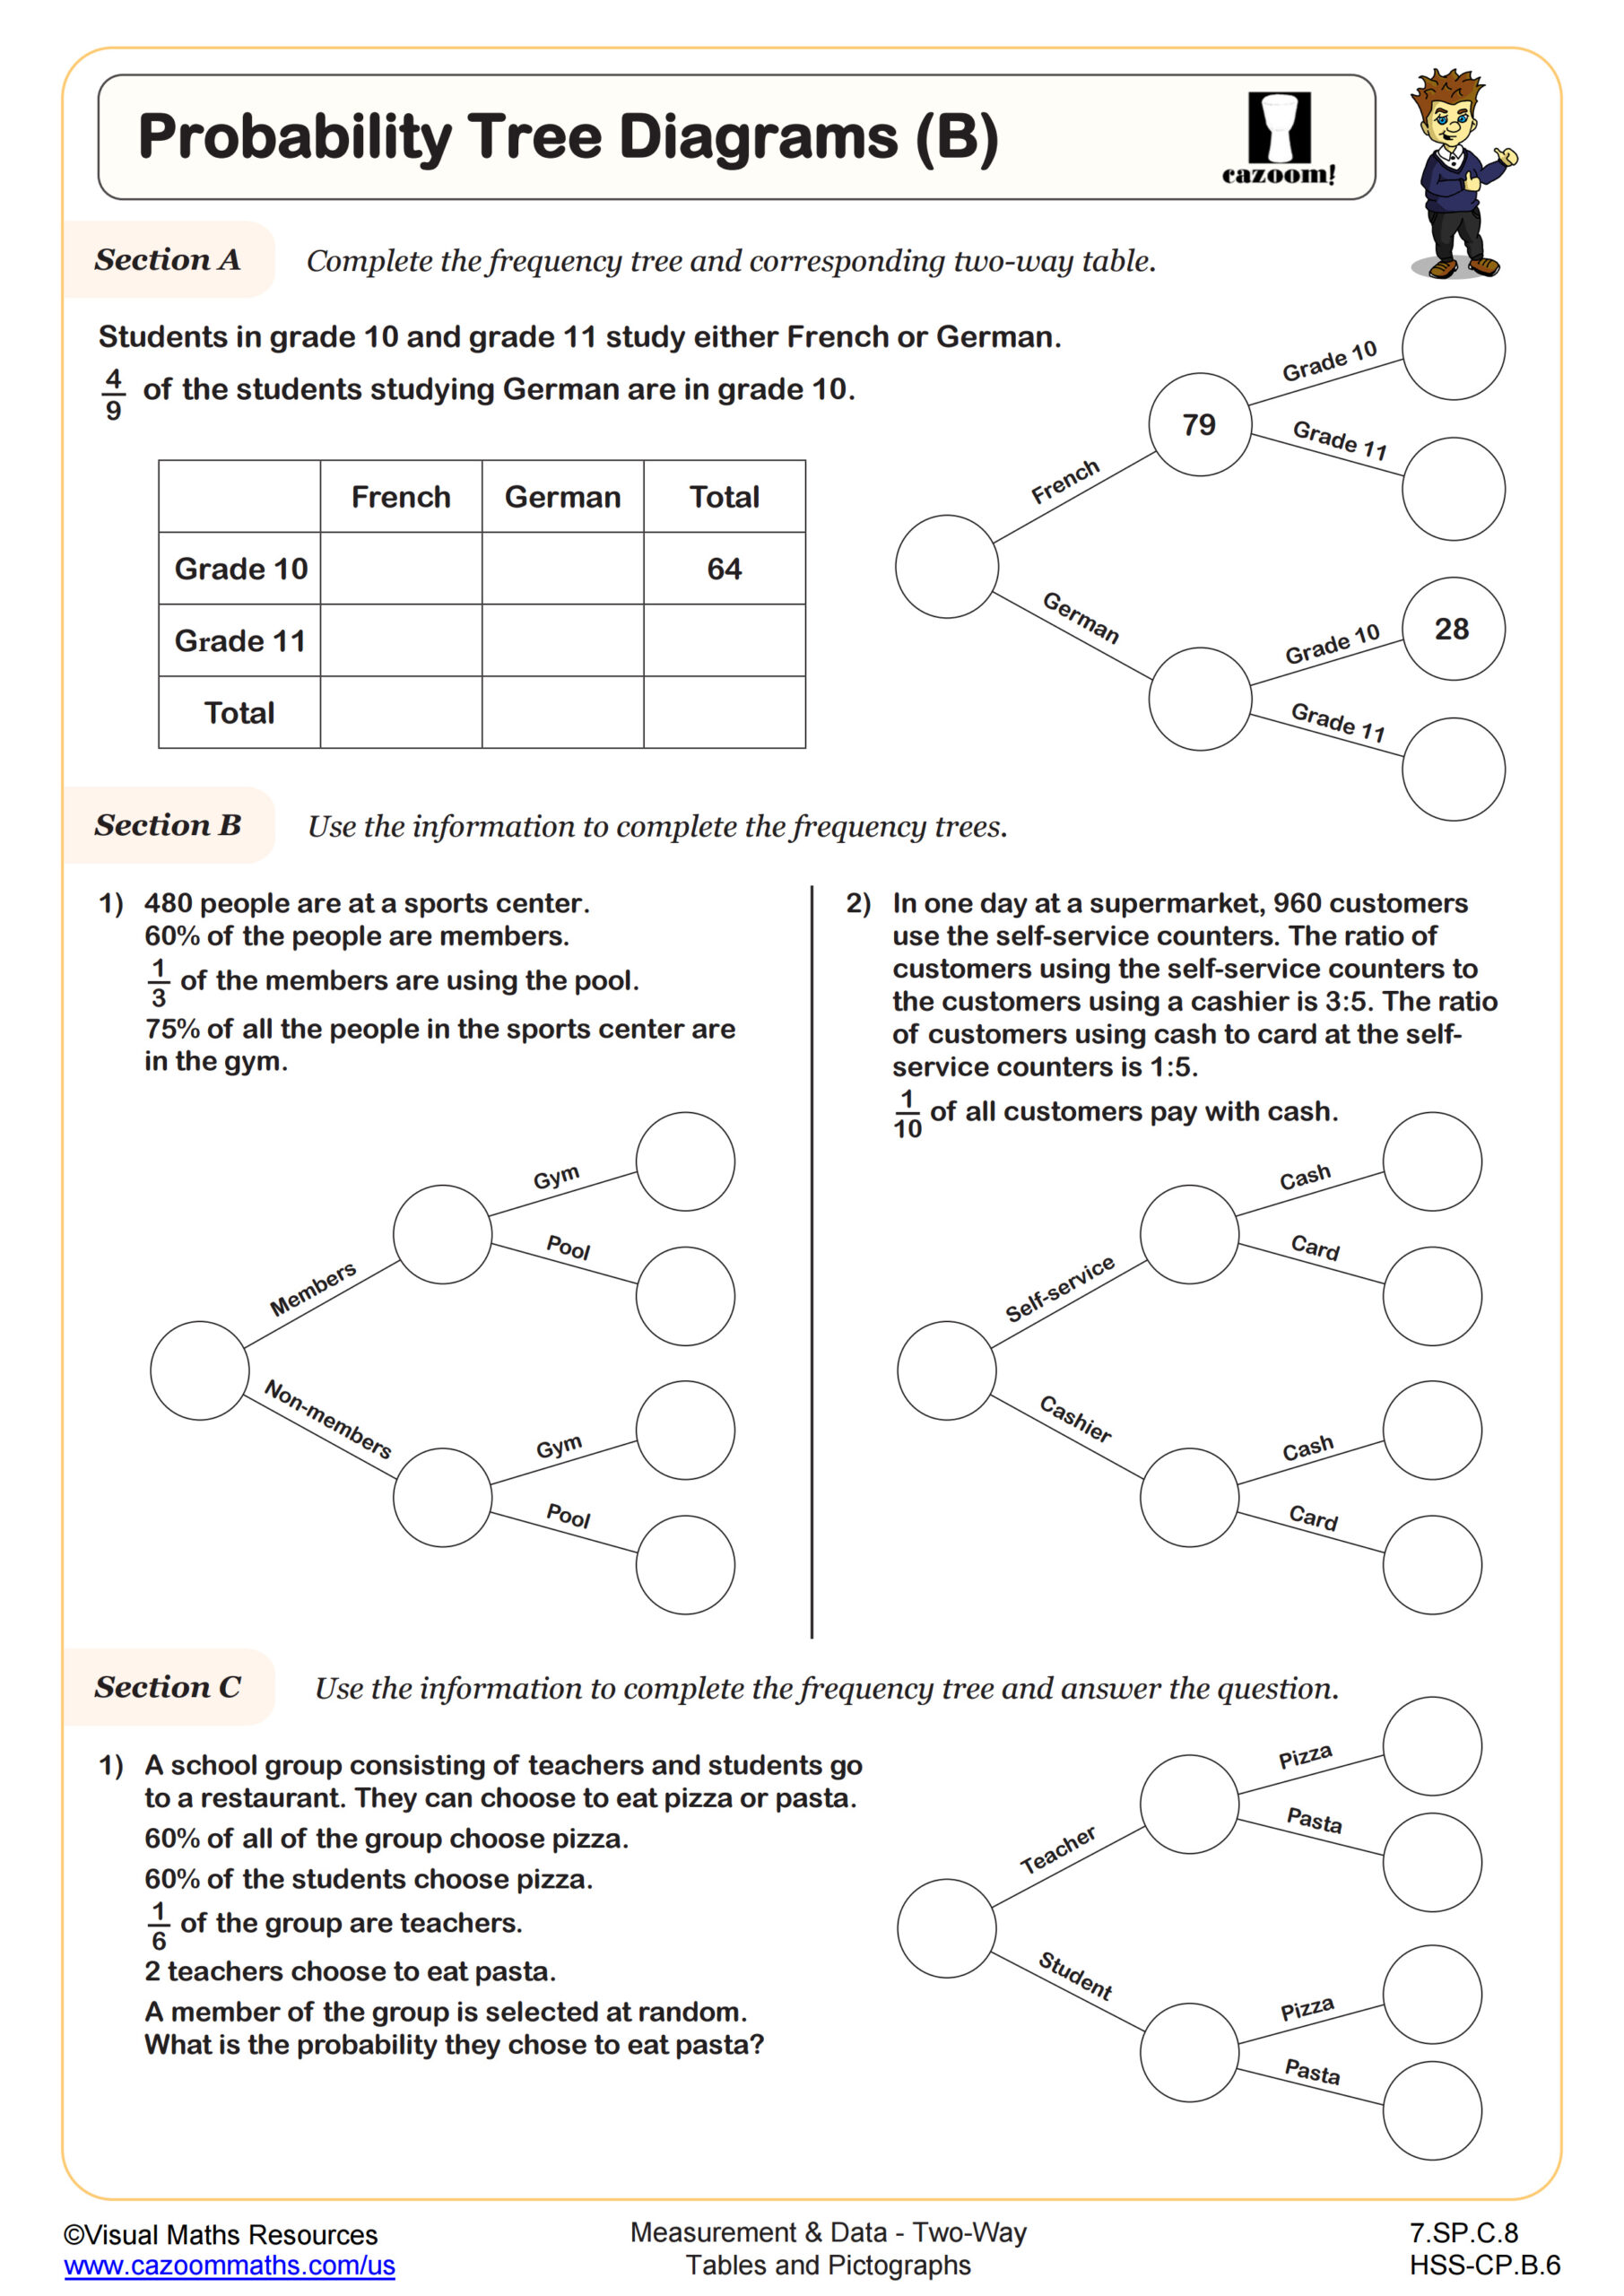
Seventh grade serves as a bridge between elementary data collection and advanced statistical analysis in high school. Students should confidently read and create pictographs, two-way tables, and circle graphs while understanding when each representation works best for different data sets. These foundational skills prepare them for more complex statistical concepts in Algebra 1 and beyond.
Classroom observations show that students who master these visualization techniques in seventh grade demonstrate stronger analytical thinking in high school math and science courses. The ability to organize categorical data systematically becomes particularly valuable in chemistry lab reports and biology research projects where data comparison is practical.
Why do students make errors when reading pictographs?
The most common error occurs when students forget to multiply by the key value in pictographs. Many seventh graders count symbols directly instead of recognizing that each symbol represents multiple units, leading to significant calculation mistakes. Teachers notice this happens especially with fractional symbols or when keys use values other than 1, 5, or 10.
Another frequent issue involves interpreting partial symbols in pictographs. Students often round inappropriately or ignore fractional parts entirely. Systematic practice with various key values and explicit instruction about scaling helps students develop accuracy with these visual representations before advancing to more complex data analysis tasks.
How can teachers effectively use these worksheets in data analysis lessons?
Teachers find success by starting with simple pictographs using familiar contexts before progressing to two-way tables with categorical variables. The answer keys allow for immediate feedback, helping students identify misconceptions quickly. Many educators use these worksheets as warm-up activities or exit tickets to assess understanding after introducing new concepts.
Pairing worksheet practice with real data collection activities strengthens student engagement and comprehension. Teachers report that students who practice with these structured problems show improved performance when analyzing their own collected data in science projects or social studies research, demonstrating transfer of skills across subject areas.