8th Grade Bivariate Data Worksheets
All worksheets are created by the team of experienced teachers at Cazoom Math.
What topics do bivariate data worksheets cover for 8th grade students?
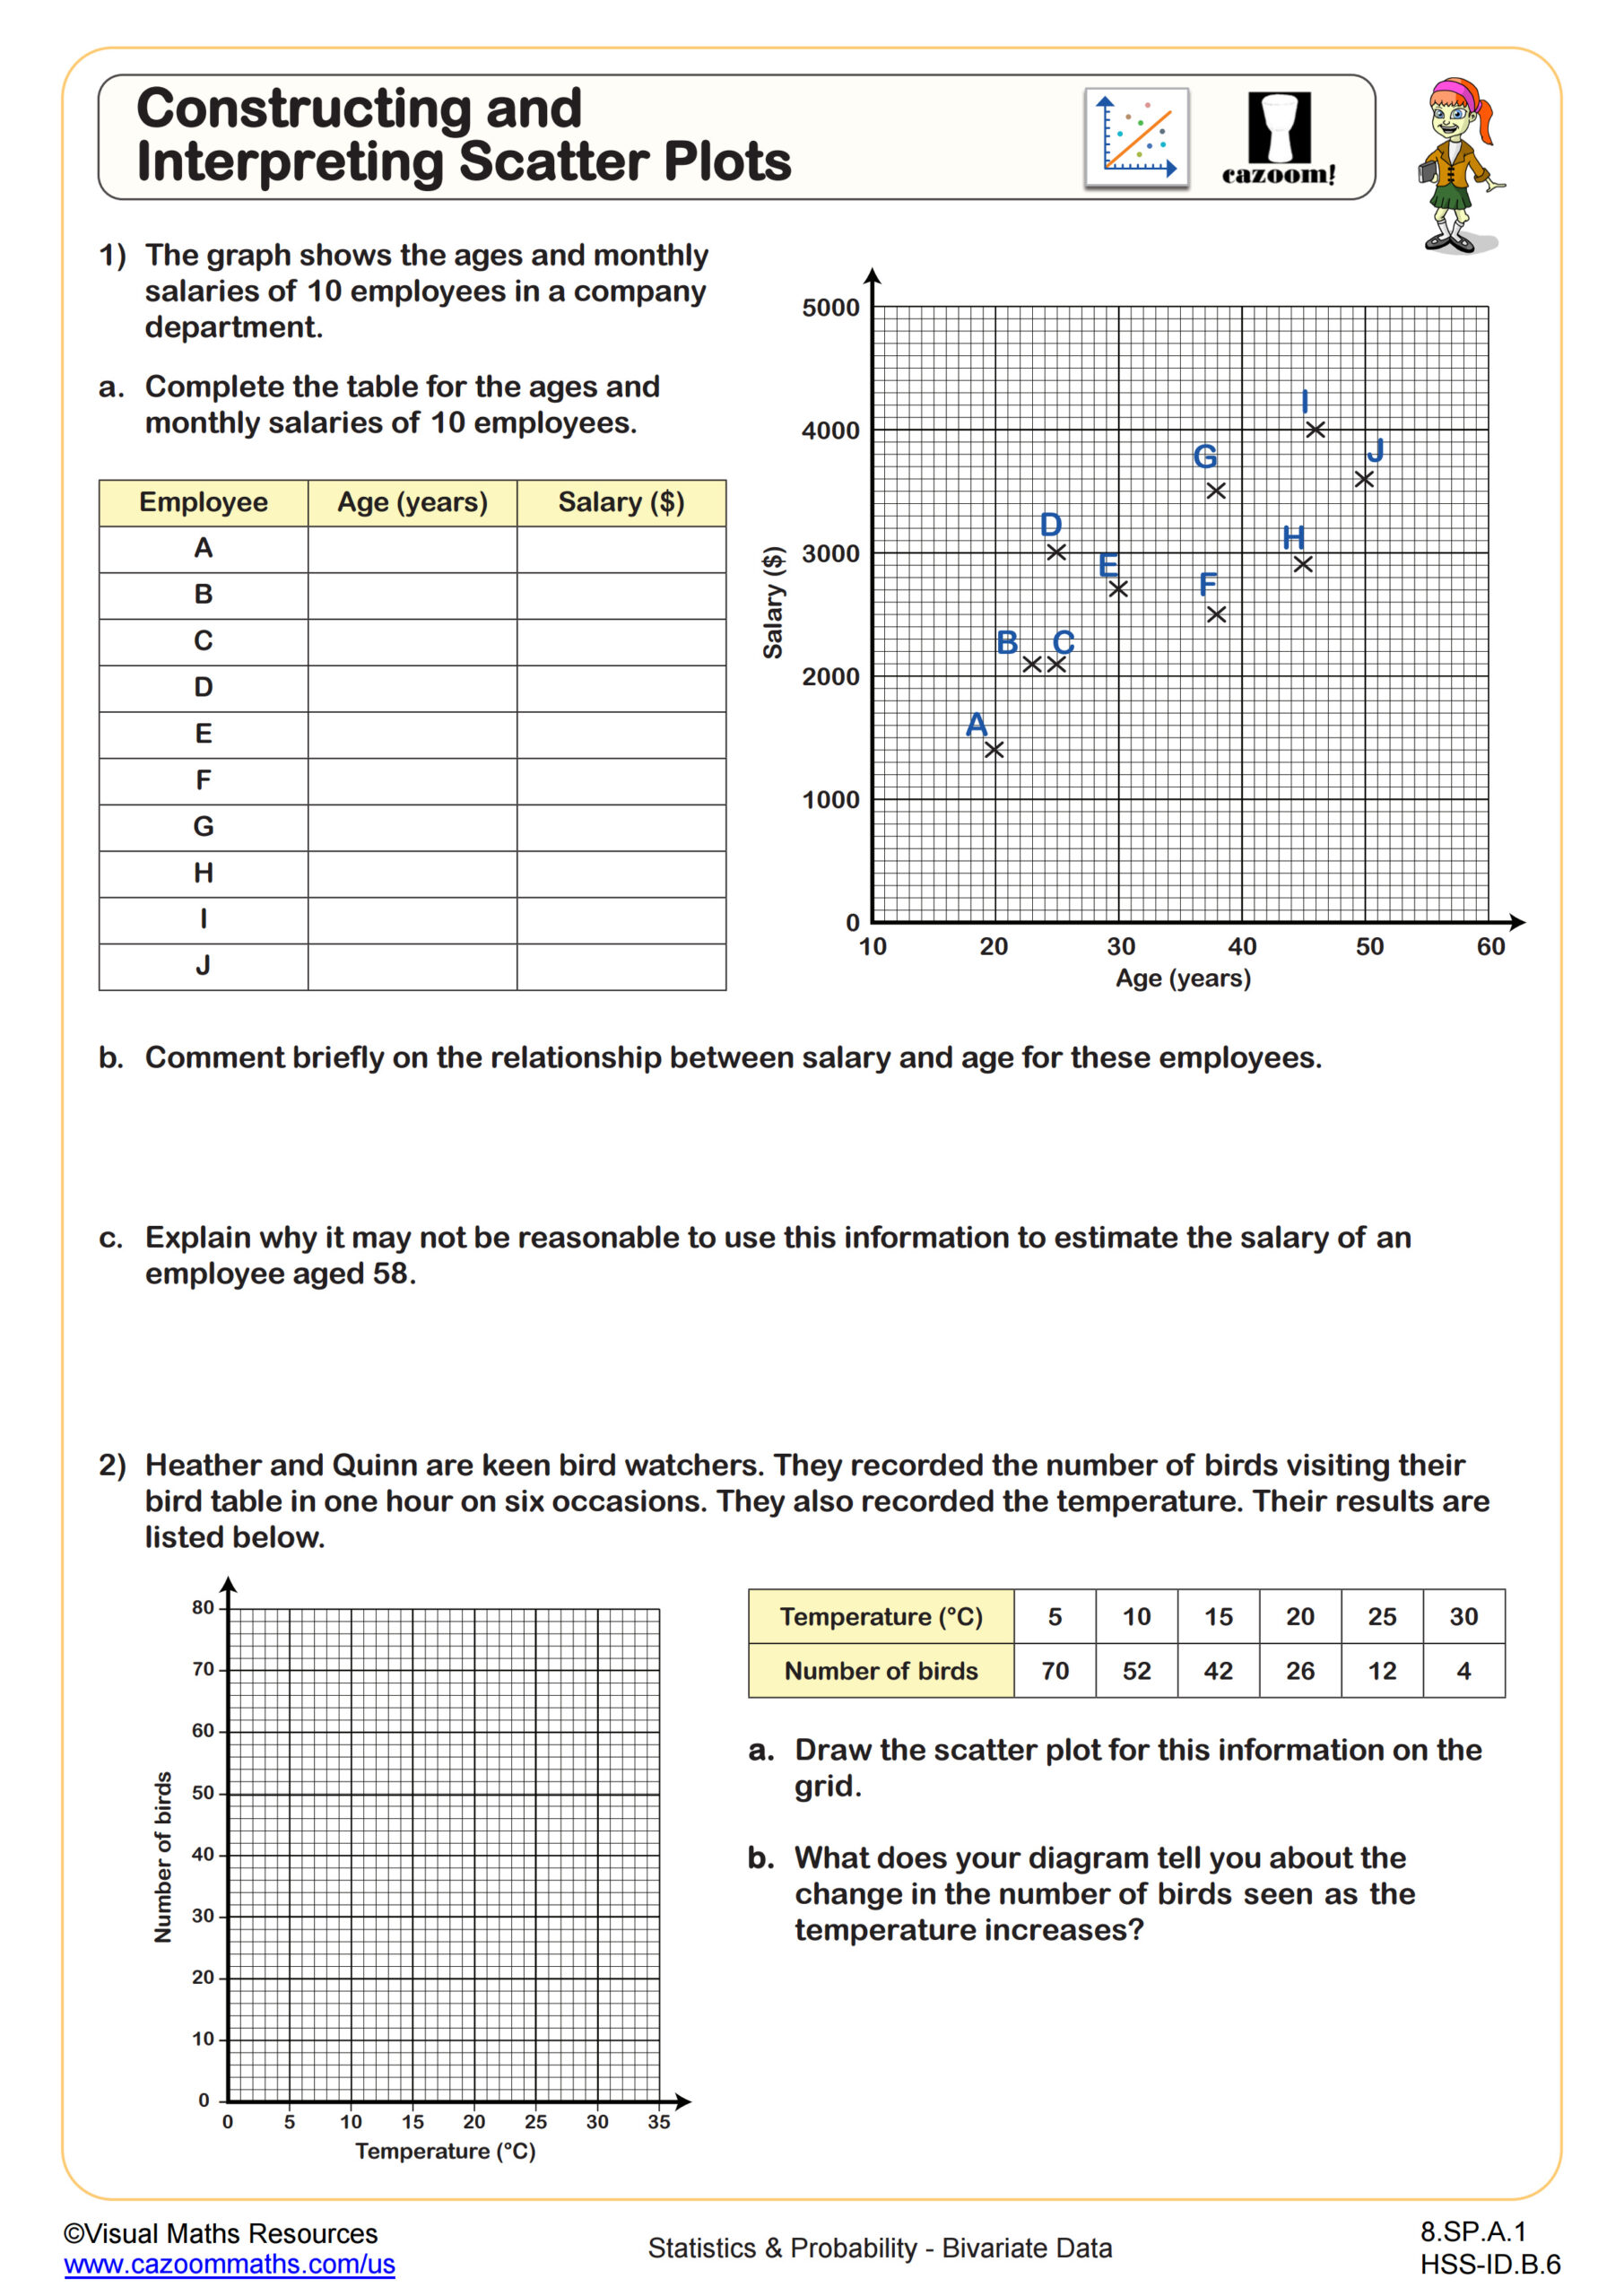
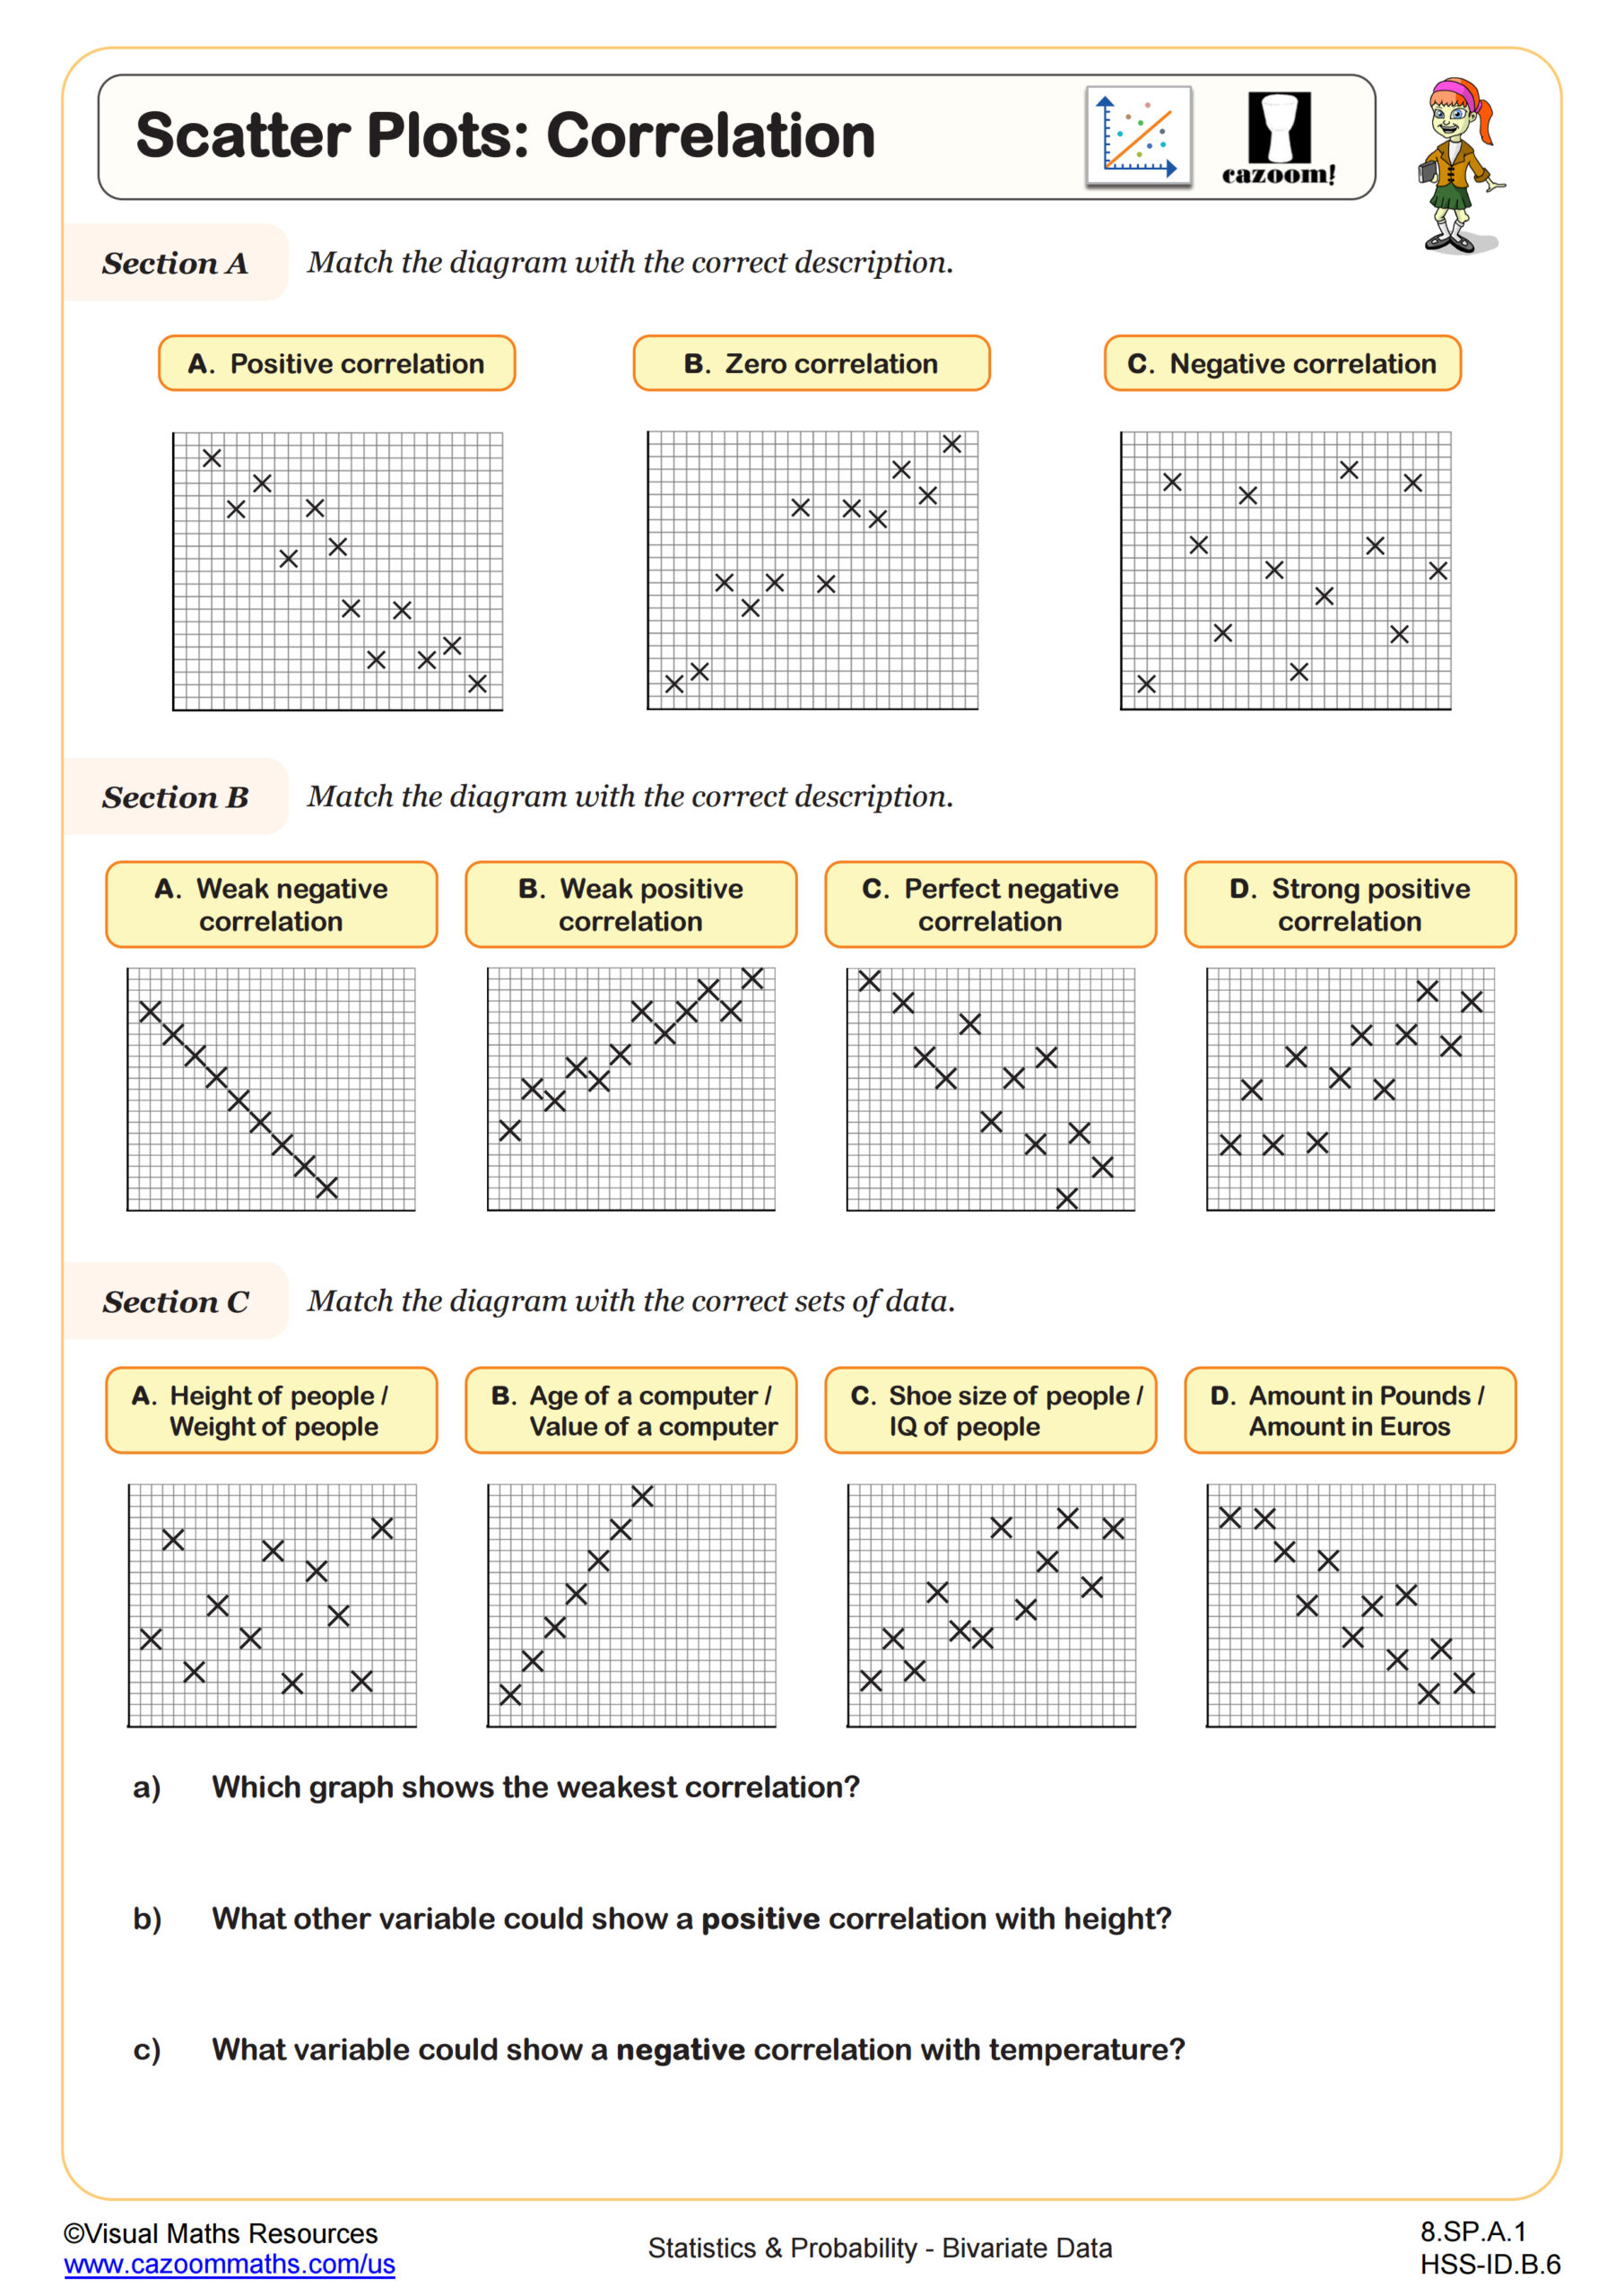
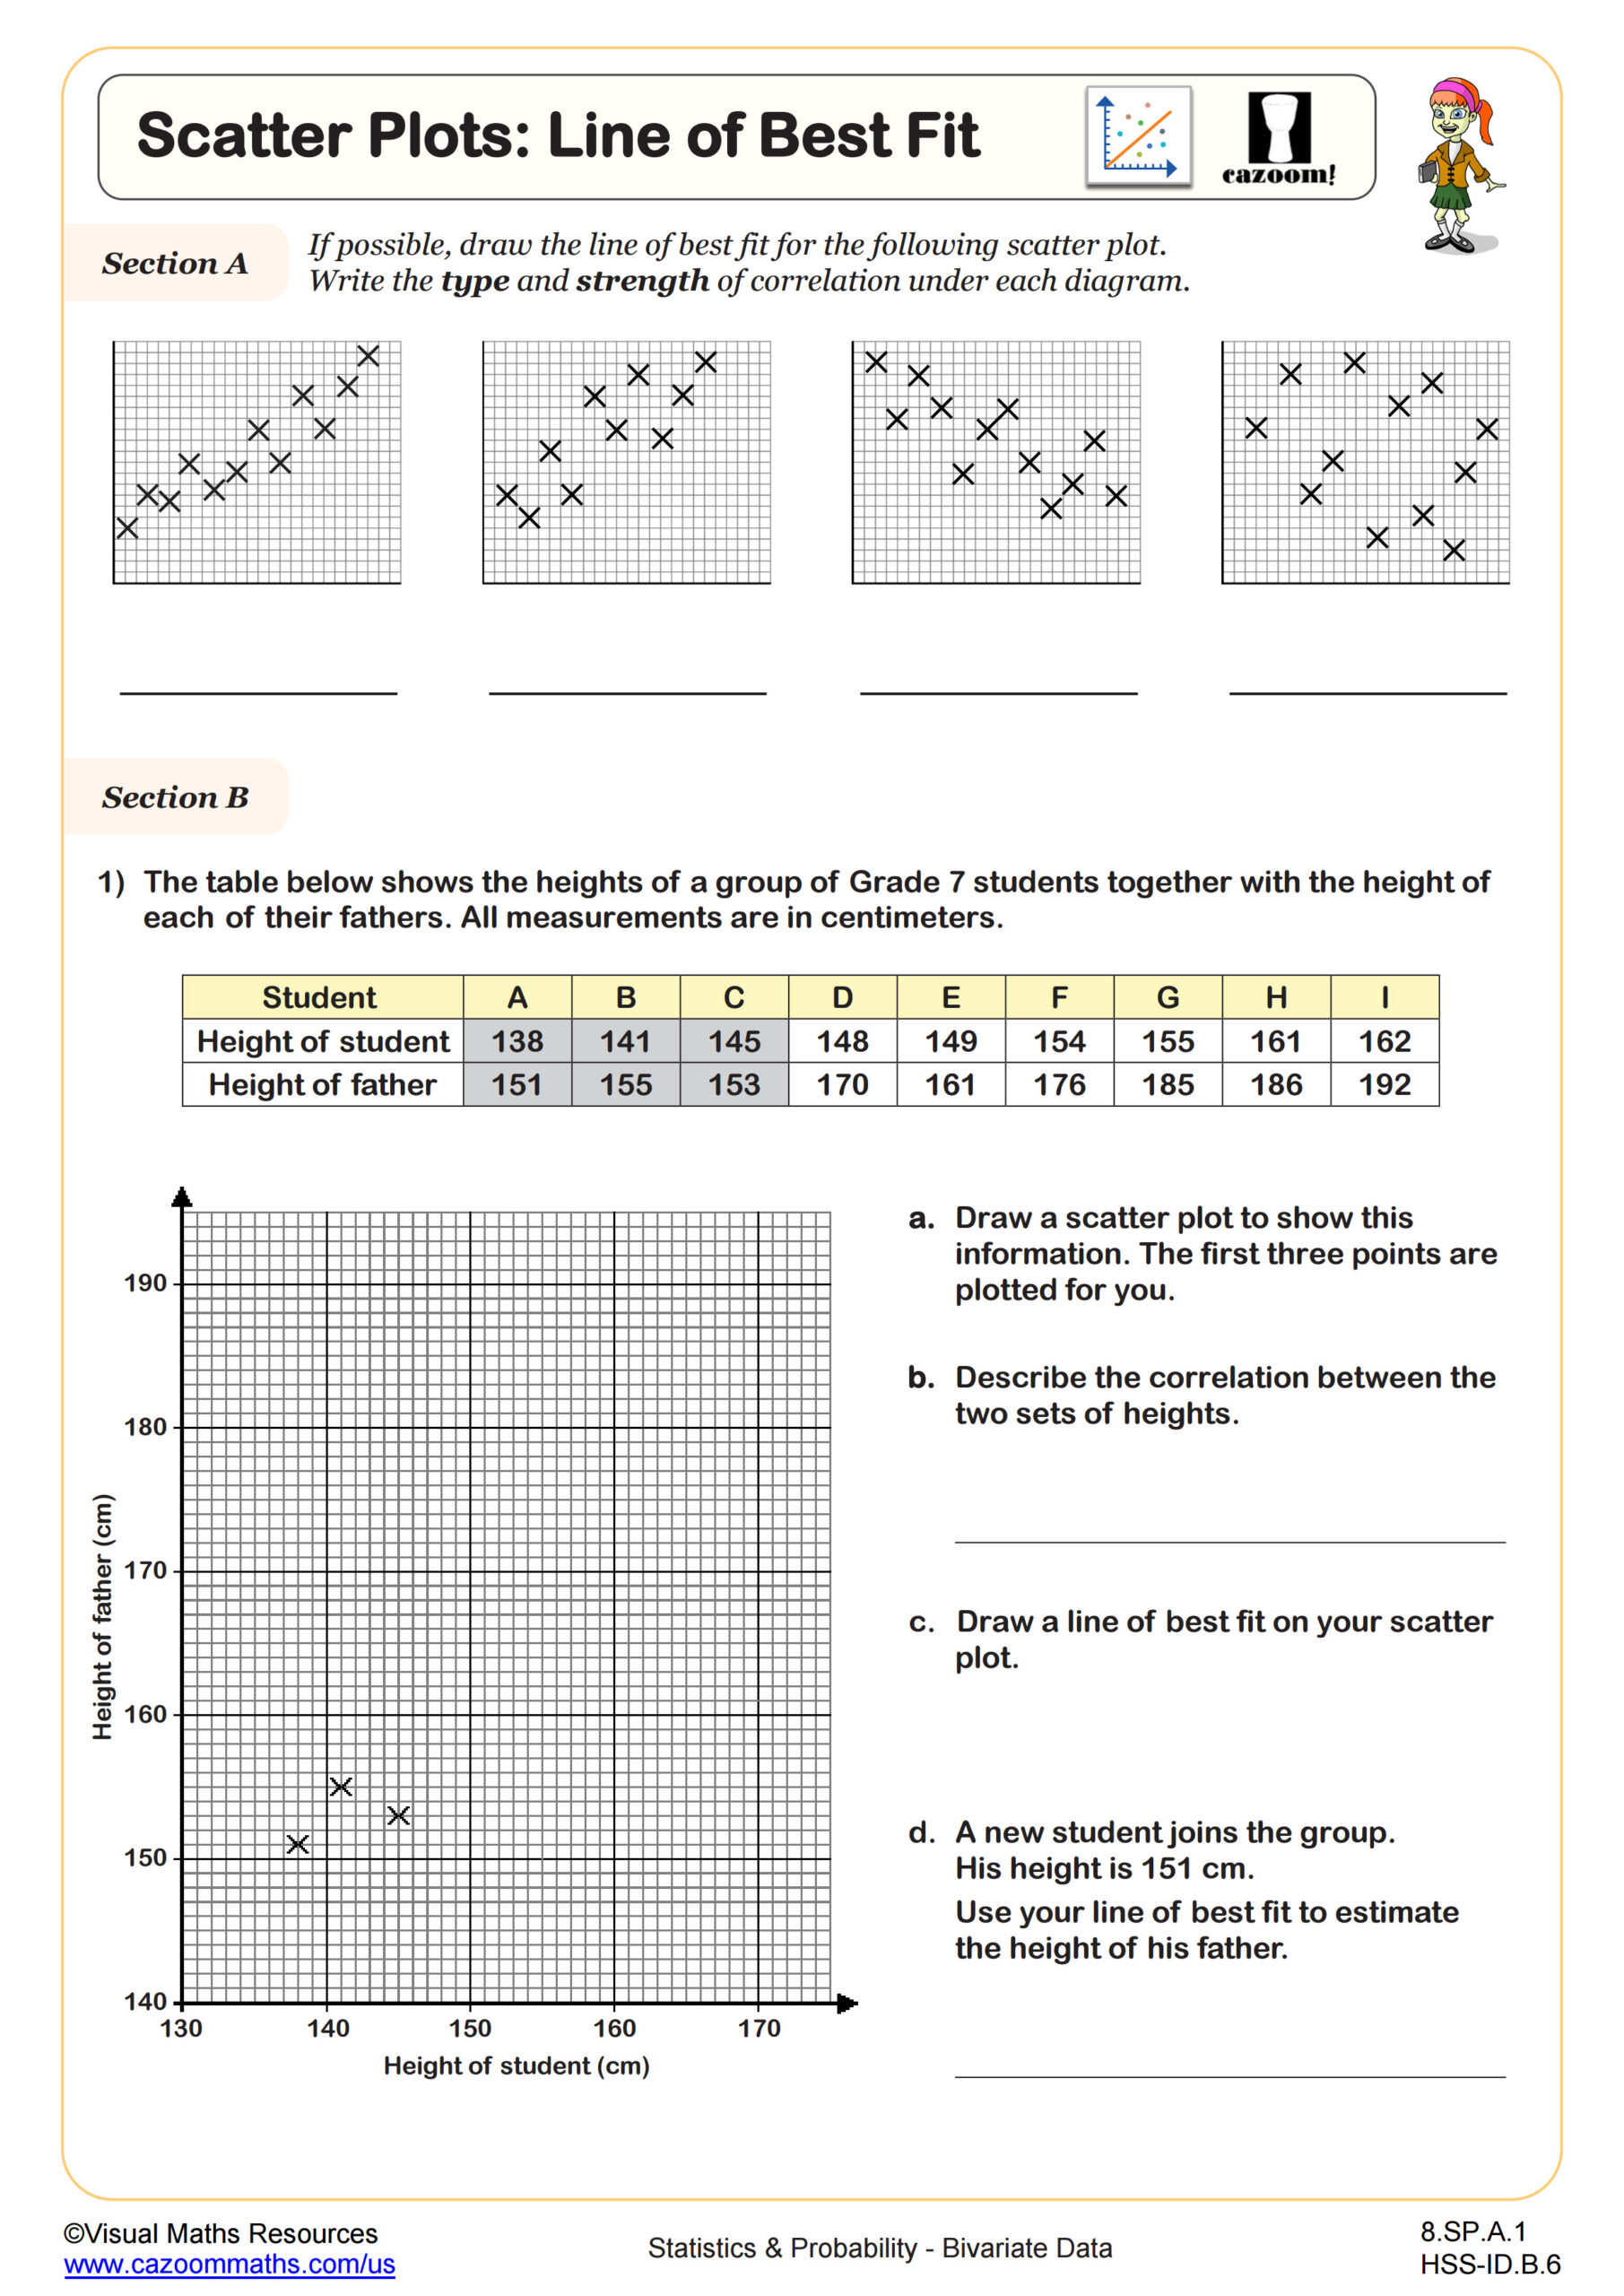
Bivariate data worksheets for 8th grade align with Common Core standard 8.SP.A.1, covering scatter plots, correlation patterns, and linear associations between two quantitative variables. Students work with real-world datasets to identify positive, negative, and no correlation while learning to describe the strength of relationships.
Teachers frequently observe that students confuse strong correlation with causation, particularly when working with relatable datasets like study hours versus test scores. The worksheets include explicit practice distinguishing between these concepts, with problems that present misleading correlations to develop critical thinking skills targeted for data literacy in our information-rich society.
How do 8th grade data analysis worksheets prepare students for high school mathematics?
Eighth grade bivariate data analysis serves as the foundation for Algebra I functions and later statistics courses, introducing students to coordinate plane analysis and mathematical modeling concepts. The skills developed through scatter plot interpretation and trend identification directly support understanding of linear functions and regression analysis in advanced coursework.
Many teachers report that students who master bivariate data concepts in 8th grade show greater confidence with graphical analysis throughout high school math. The visual nature of scatter plots helps students transition from concrete arithmetic thinking to more abstract algebraic reasoning, making these worksheets particularly effective for diverse learning styles and mathematical readiness levels.
What makes scatter plot analysis challenging for middle school students?
Creating accurate scatter plots requires students to carefully manage coordinate pairs and scaling, skills that often reveal gaps in their understanding of the coordinate plane and proportional reasoning. Many students struggle with selecting appropriate scales for axes, leading to compressed or distorted representations that obscure meaningful patterns in the data.
Teachers notice that students frequently plot points incorrectly by reversing x and y coordinates, especially when working with unfamiliar variable relationships. The worksheets provide structured practice with clearly labeled axes and guided scale selection, helping students develop systematic approaches to graphical representation that will serve them throughout their mathematical education and in STEM fields.
How can teachers effectively use these worksheets in 8th grade classrooms?
These bivariate data worksheets work best when introduced after students have solid coordinate plane skills and basic understanding of proportional relationships. Teachers find success using real-world datasets that connect to student interests, such as sports statistics or social media trends, to maintain engagement while building analytical skills.
The answer keys support differentiated instruction by allowing teachers to identify specific areas where students need additional support, particularly in interpretation and mathematical reasoning. Many educators use these worksheets for both initial instruction and review before state assessments, as the visual nature of bivariate data helps students demonstrate mathematical understanding through multiple representations and explanations.