8th Grade Inequalities Worksheets
All worksheets are created by the team of experienced teachers at Cazoom Math.
What are inequalities and why do students learn them in 8th grade?
Inequalities are mathematical statements that compare two expressions using symbols like less than (<), greater than (>), less than or equal to (≤), and greater than or equal to (≥). Students learn inequalities in 8th grade because they extend equation-solving skills to situations with multiple solutions, which aligns with Common Core standard 8.EE.B.5 and prepares students for high school algebra where they'll graph linear inequalities and solve systems.
A common misconception occurs when students treat the inequality symbol like an equals sign and forget that their solution represents a range of values rather than a single answer. Students lose points on assessments when they correctly solve the inequality but fail to graph all possible solutions or shade the wrong region. Teachers notice breakthrough moments when students test boundary points and verify which side of the line satisfies the inequality, making the abstract concept concrete through numerical substitution.
Which grade levels use these inequality worksheets?
These worksheets target 8th grade students in middle school, where inequalities become a core algebraic concept. At this level, students transition from solving simple one-step inequalities to multi-step problems and graphing solutions on both number lines and coordinate planes, building the foundation for Algebra I coursework.
The progression within 8th grade moves from recognizing inequality symbols and their meanings to solving one-variable inequalities with multiple operations, then extends to graphing linear inequalities on coordinate planes. Students begin with number line representations where the solution set appears as shaded regions with open or closed circles, then advance to two-variable inequalities where they shade half-planes. This scaffolded approach ensures students master the underlying logic before tackling the visual complexity of coordinate plane graphs that appear on high school placement tests and standardized assessments.
How do students graph inequalities on a coordinate plane?
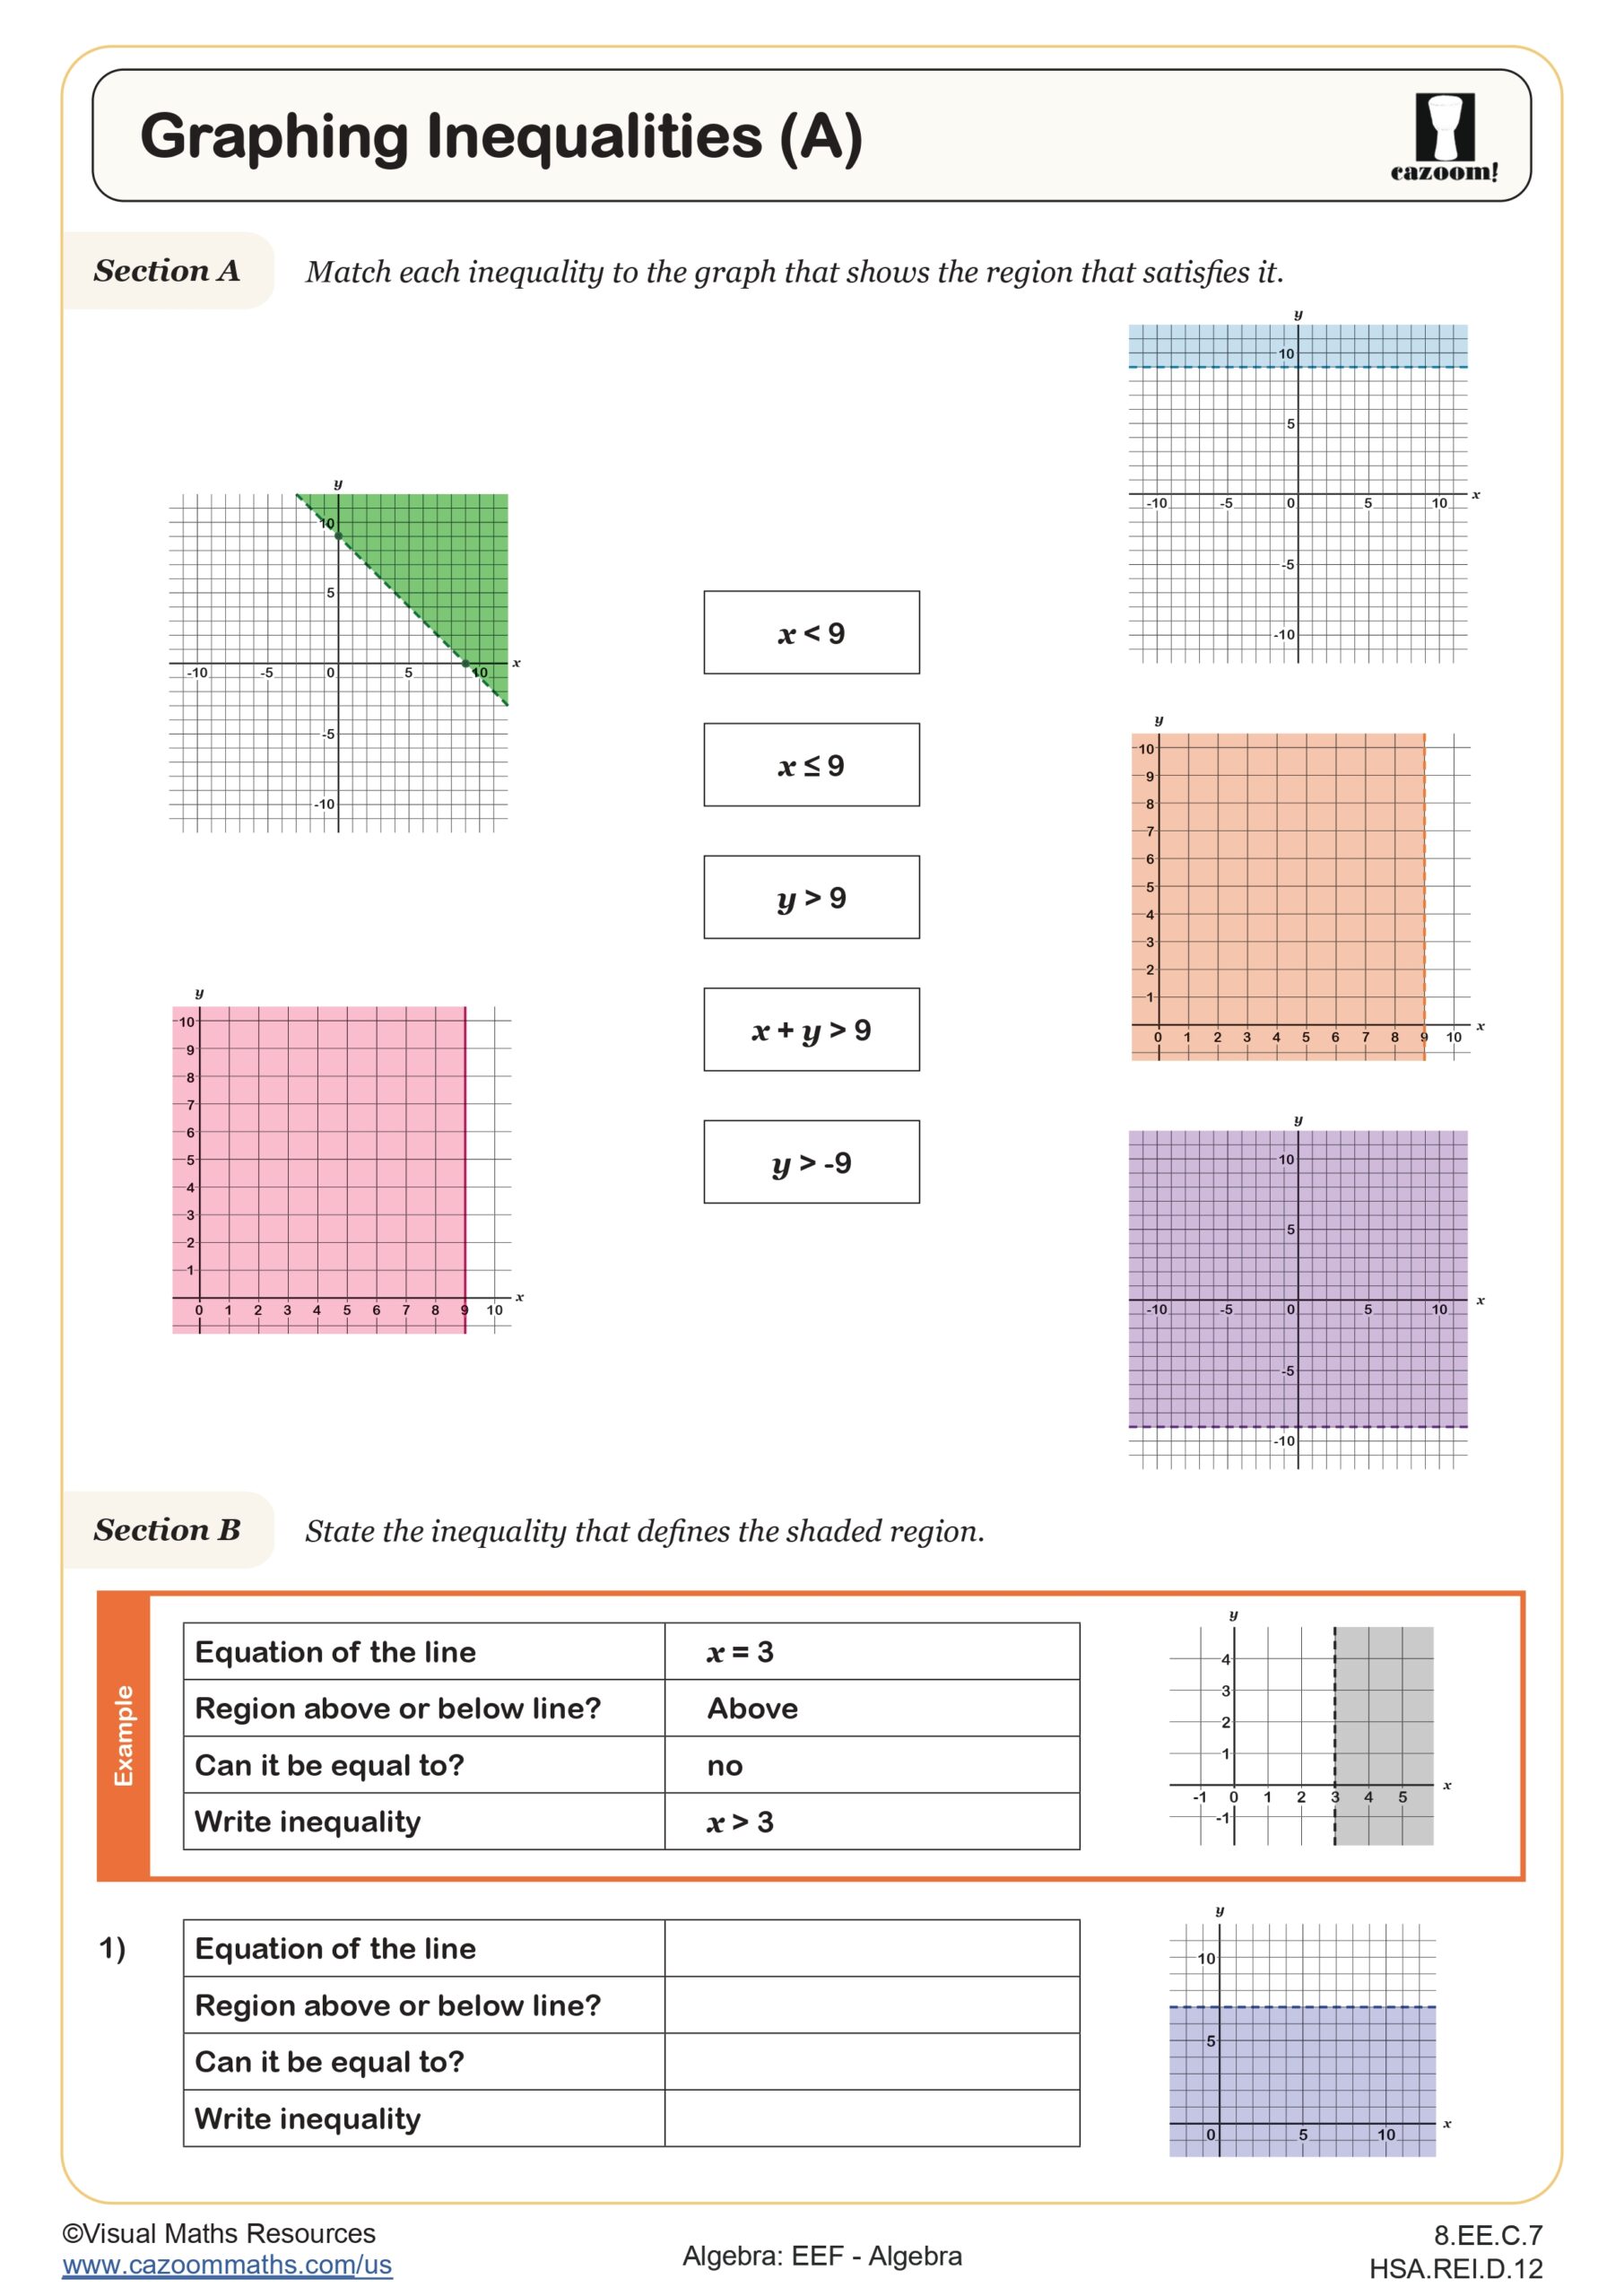
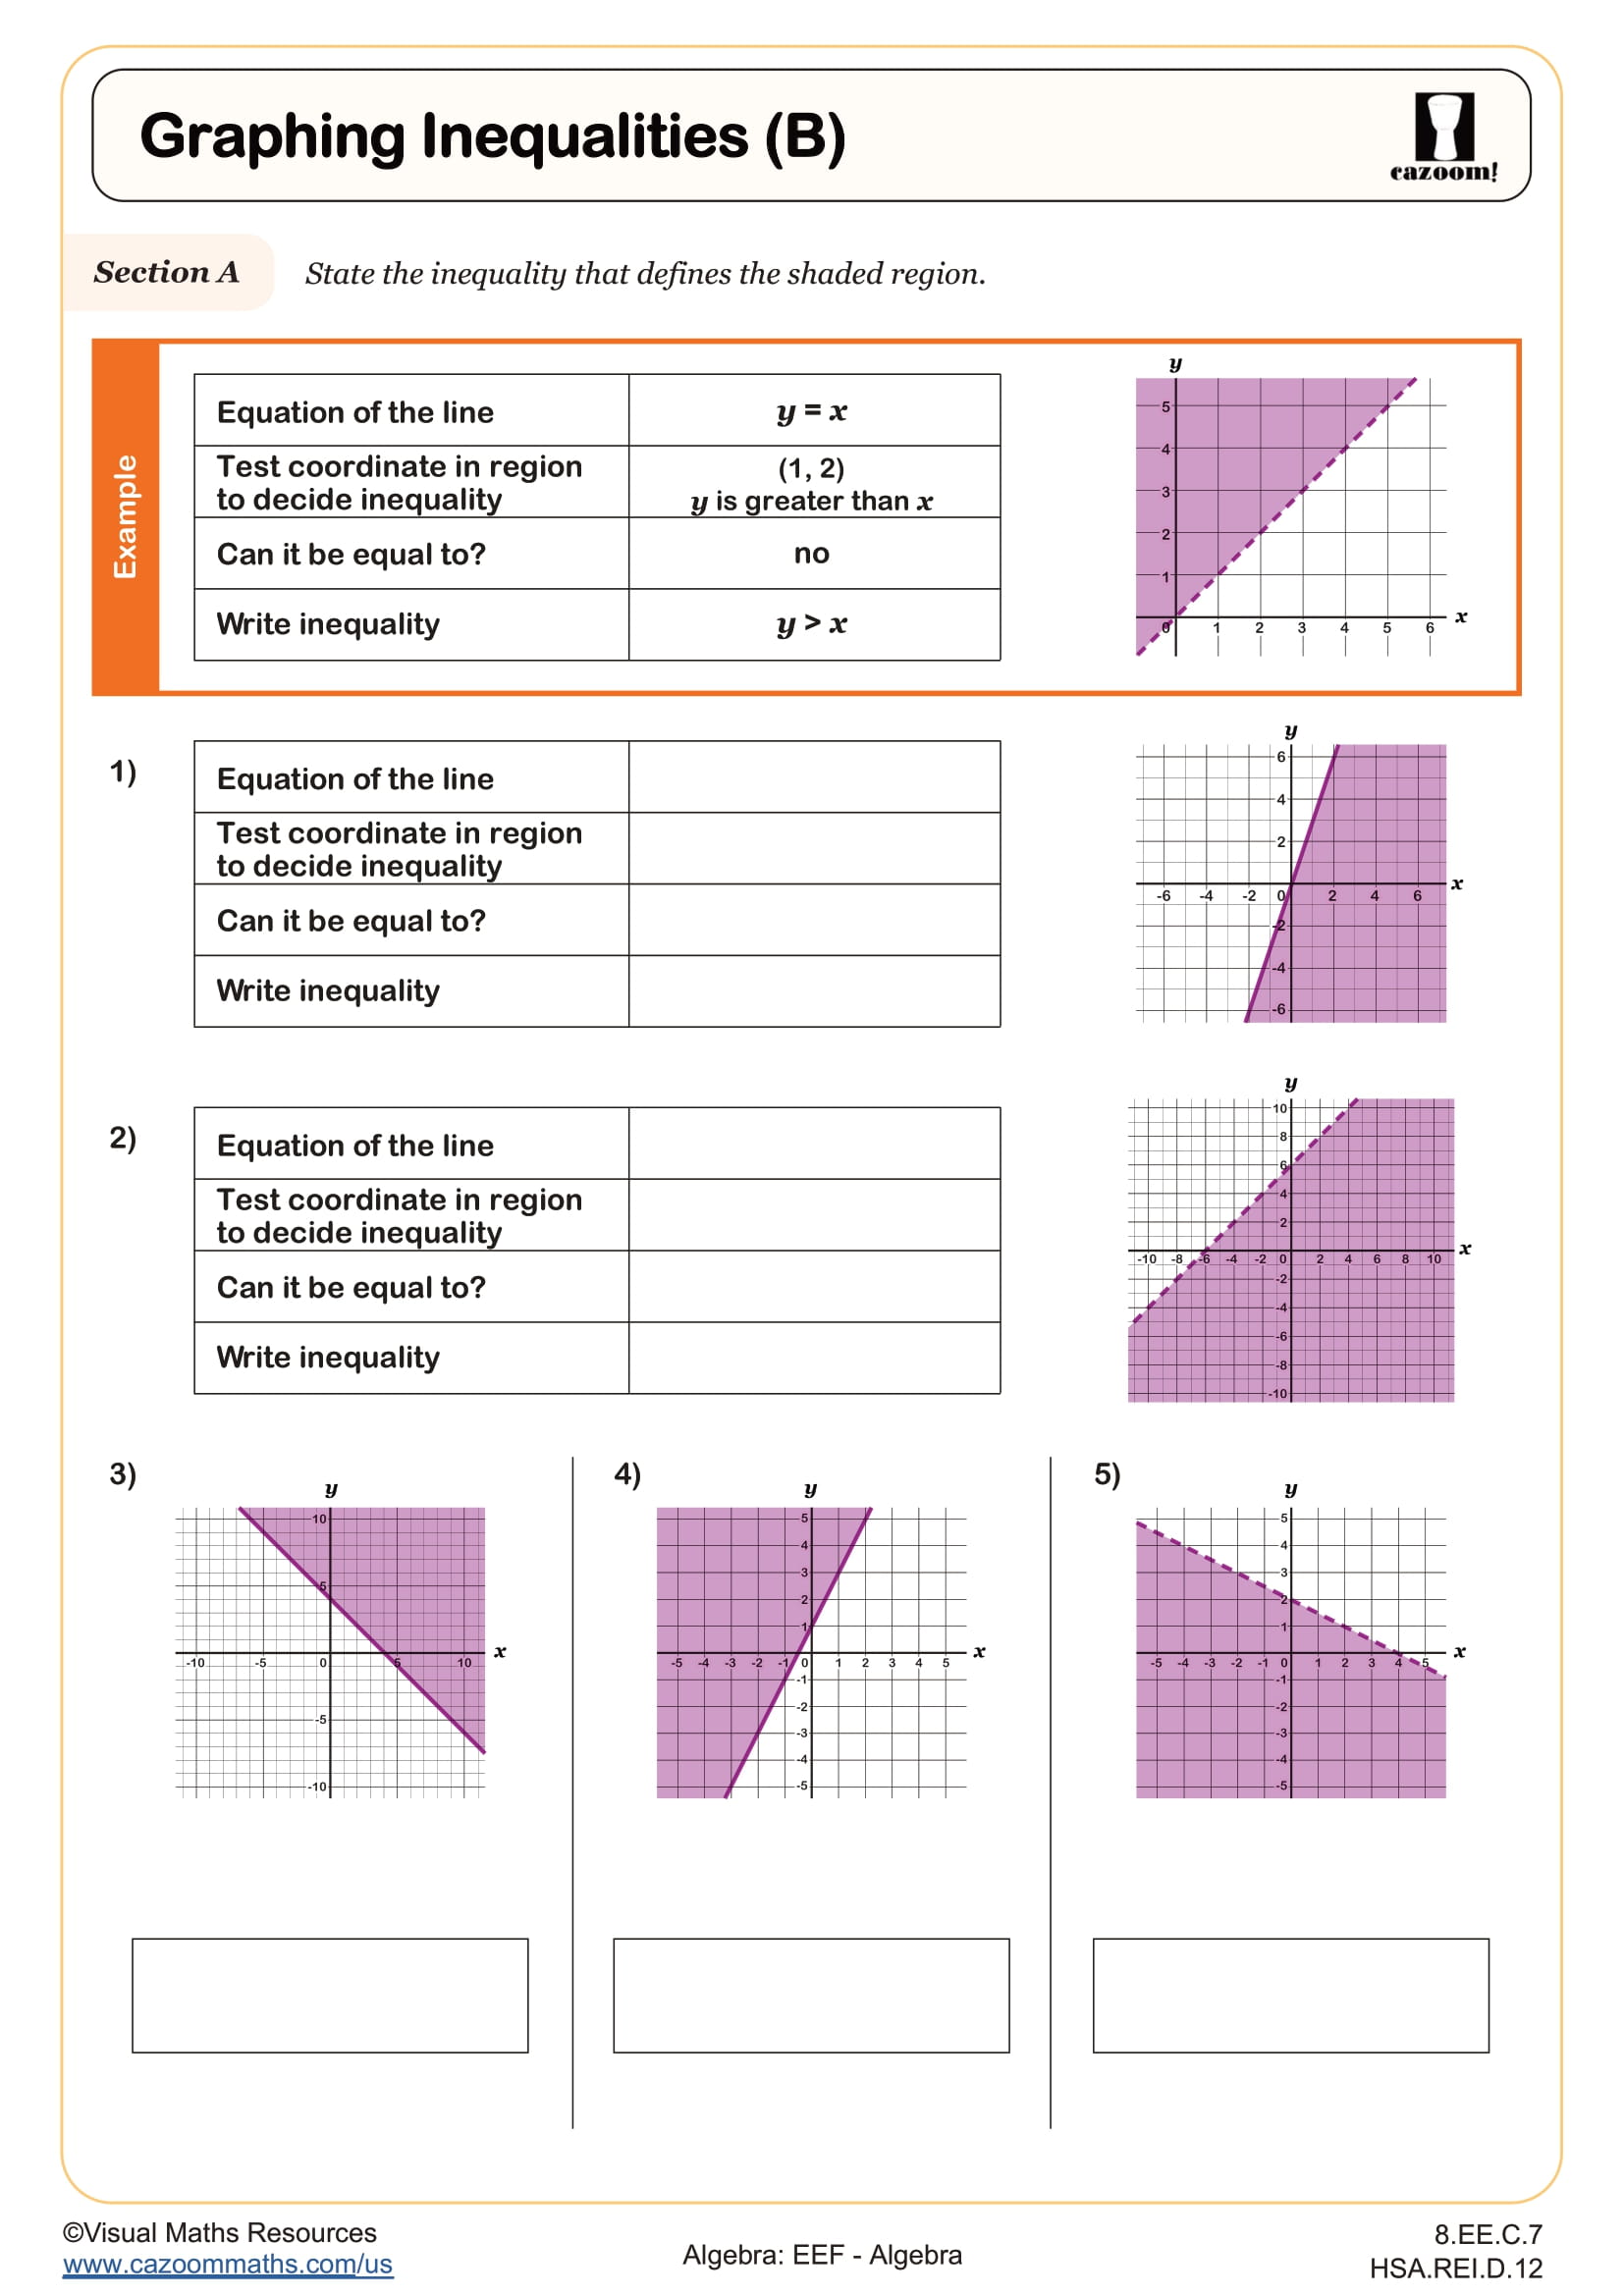
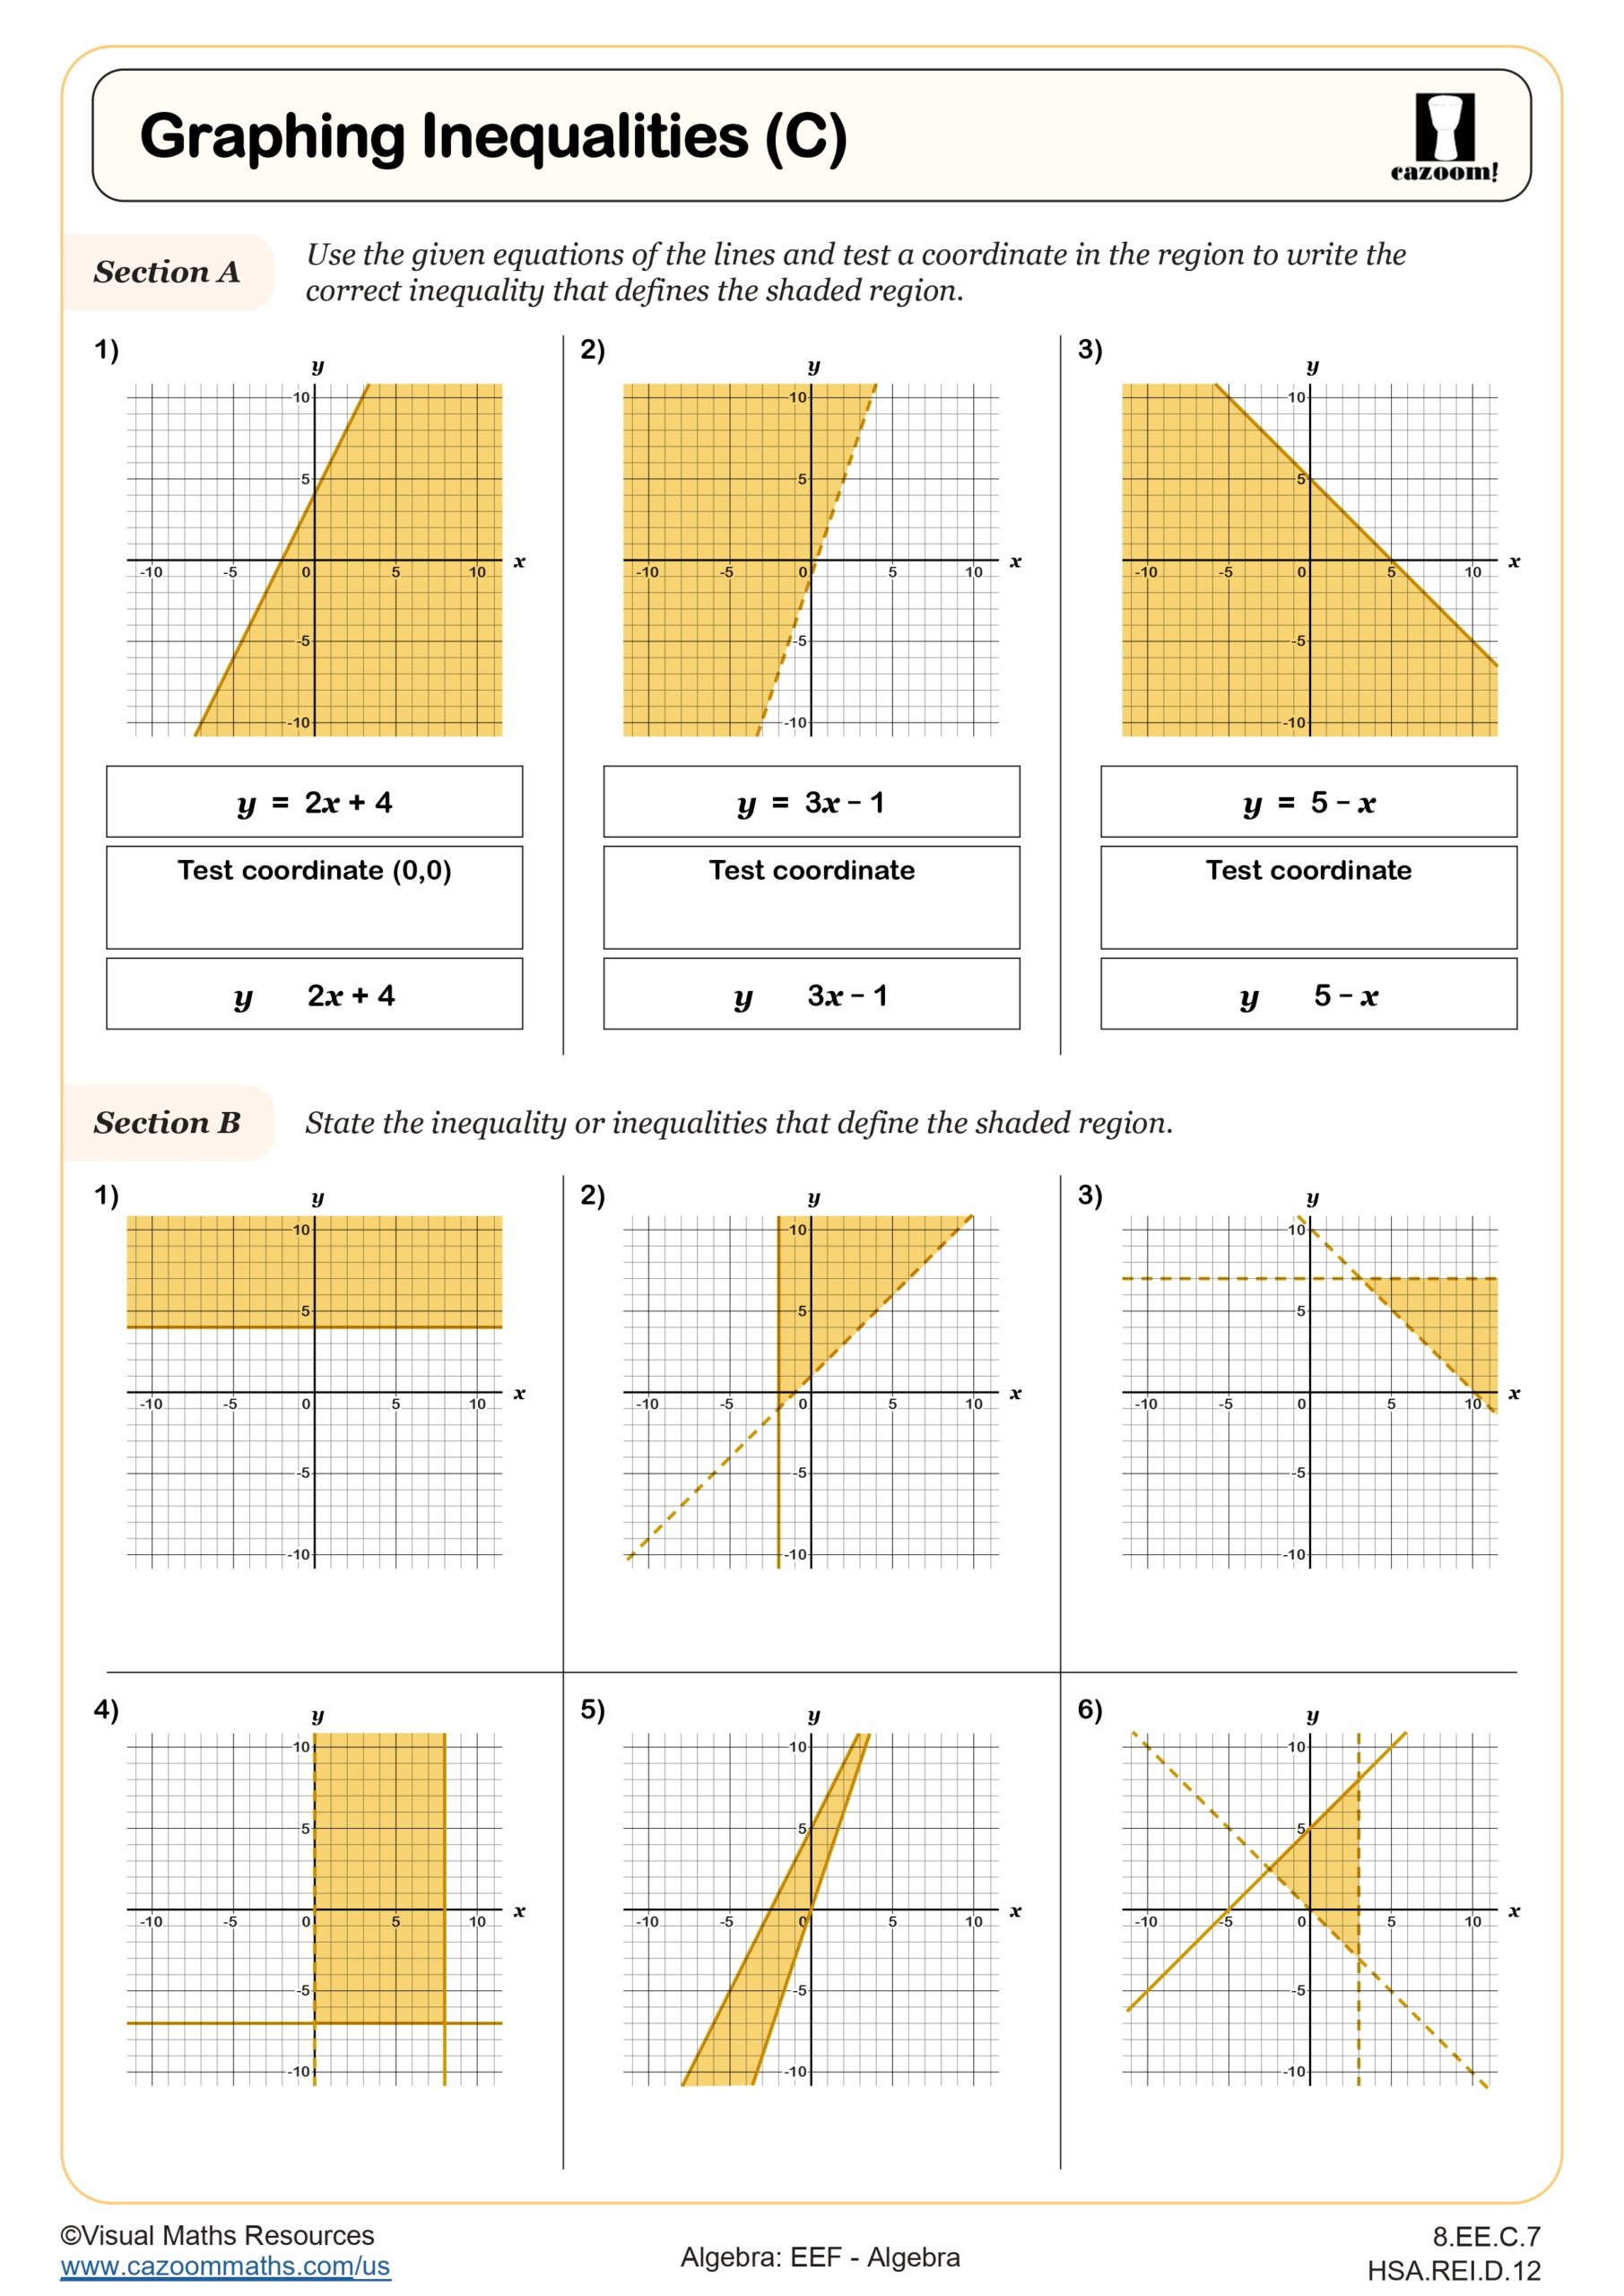
Graphing two-variable inequalities on a coordinate plane requires students to first graph the boundary line (treating the inequality as an equation), then determine which side of that line contains the solutions. Students draw solid lines for inequalities with ≤ or ≥ symbols and dashed lines for < or > symbols, then shade the region that satisfies the inequality. Teachers often notice that students successfully graph the boundary line but struggle with choosing the correct region to shade, making test-point substitution a critical verification step.
This skill connects directly to optimization problems in fields like engineering and economics, where professionals use linear programming to maximize profits or minimize costs within constraints. A manufacturing company might graph inequalities to determine how many of two products to produce given limited materials and labor hours. The shaded feasible region shows all possible production combinations that meet the constraints, demonstrating how abstract mathematical concepts translate into business decisions that affect production schedules and resource allocation.
How can teachers use these inequality worksheets effectively in the classroom?
These worksheets provide structured practice that moves from basic symbol recognition to complex graphing tasks, with each subtopic building on previous skills. The answer keys allow students to self-check their work during independent practice or enable teachers to quickly identify where students need additional support. Teachers can use early worksheets on inequality symbols and number line graphs as formative assessments to gauge student understanding before introducing coordinate plane graphing.
Many teachers assign these worksheets as differentiated homework based on student performance, using simpler number line problems for students who need foundational review while giving coordinate plane tasks to students ready for advanced work. The worksheets work well for paired activities where one student solves the inequality algebraically while their partner graphs the solution, then they verify their answers match. Teachers also pull specific problems for warm-up activities or exit tickets, using the answer keys to provide immediate feedback during whole-class review sessions before quizzes or state assessments.