8th Grade Pie Charts and Bar Charts Worksheets
All worksheets are created by the team of experienced teachers at Cazoom Math.
What's the Difference Between Pie Charts and Bar Charts?
Pie charts display parts of a whole as proportional slices of a circle, showing percentages or fractions that total 100% or one whole. Bar charts use rectangular bars to compare quantities across different categories, making them ideal when values don't need to sum to a total. Both appear regularly in Common Core-aligned assessments at the middle school level, where students must interpret data and justify which representation works best.
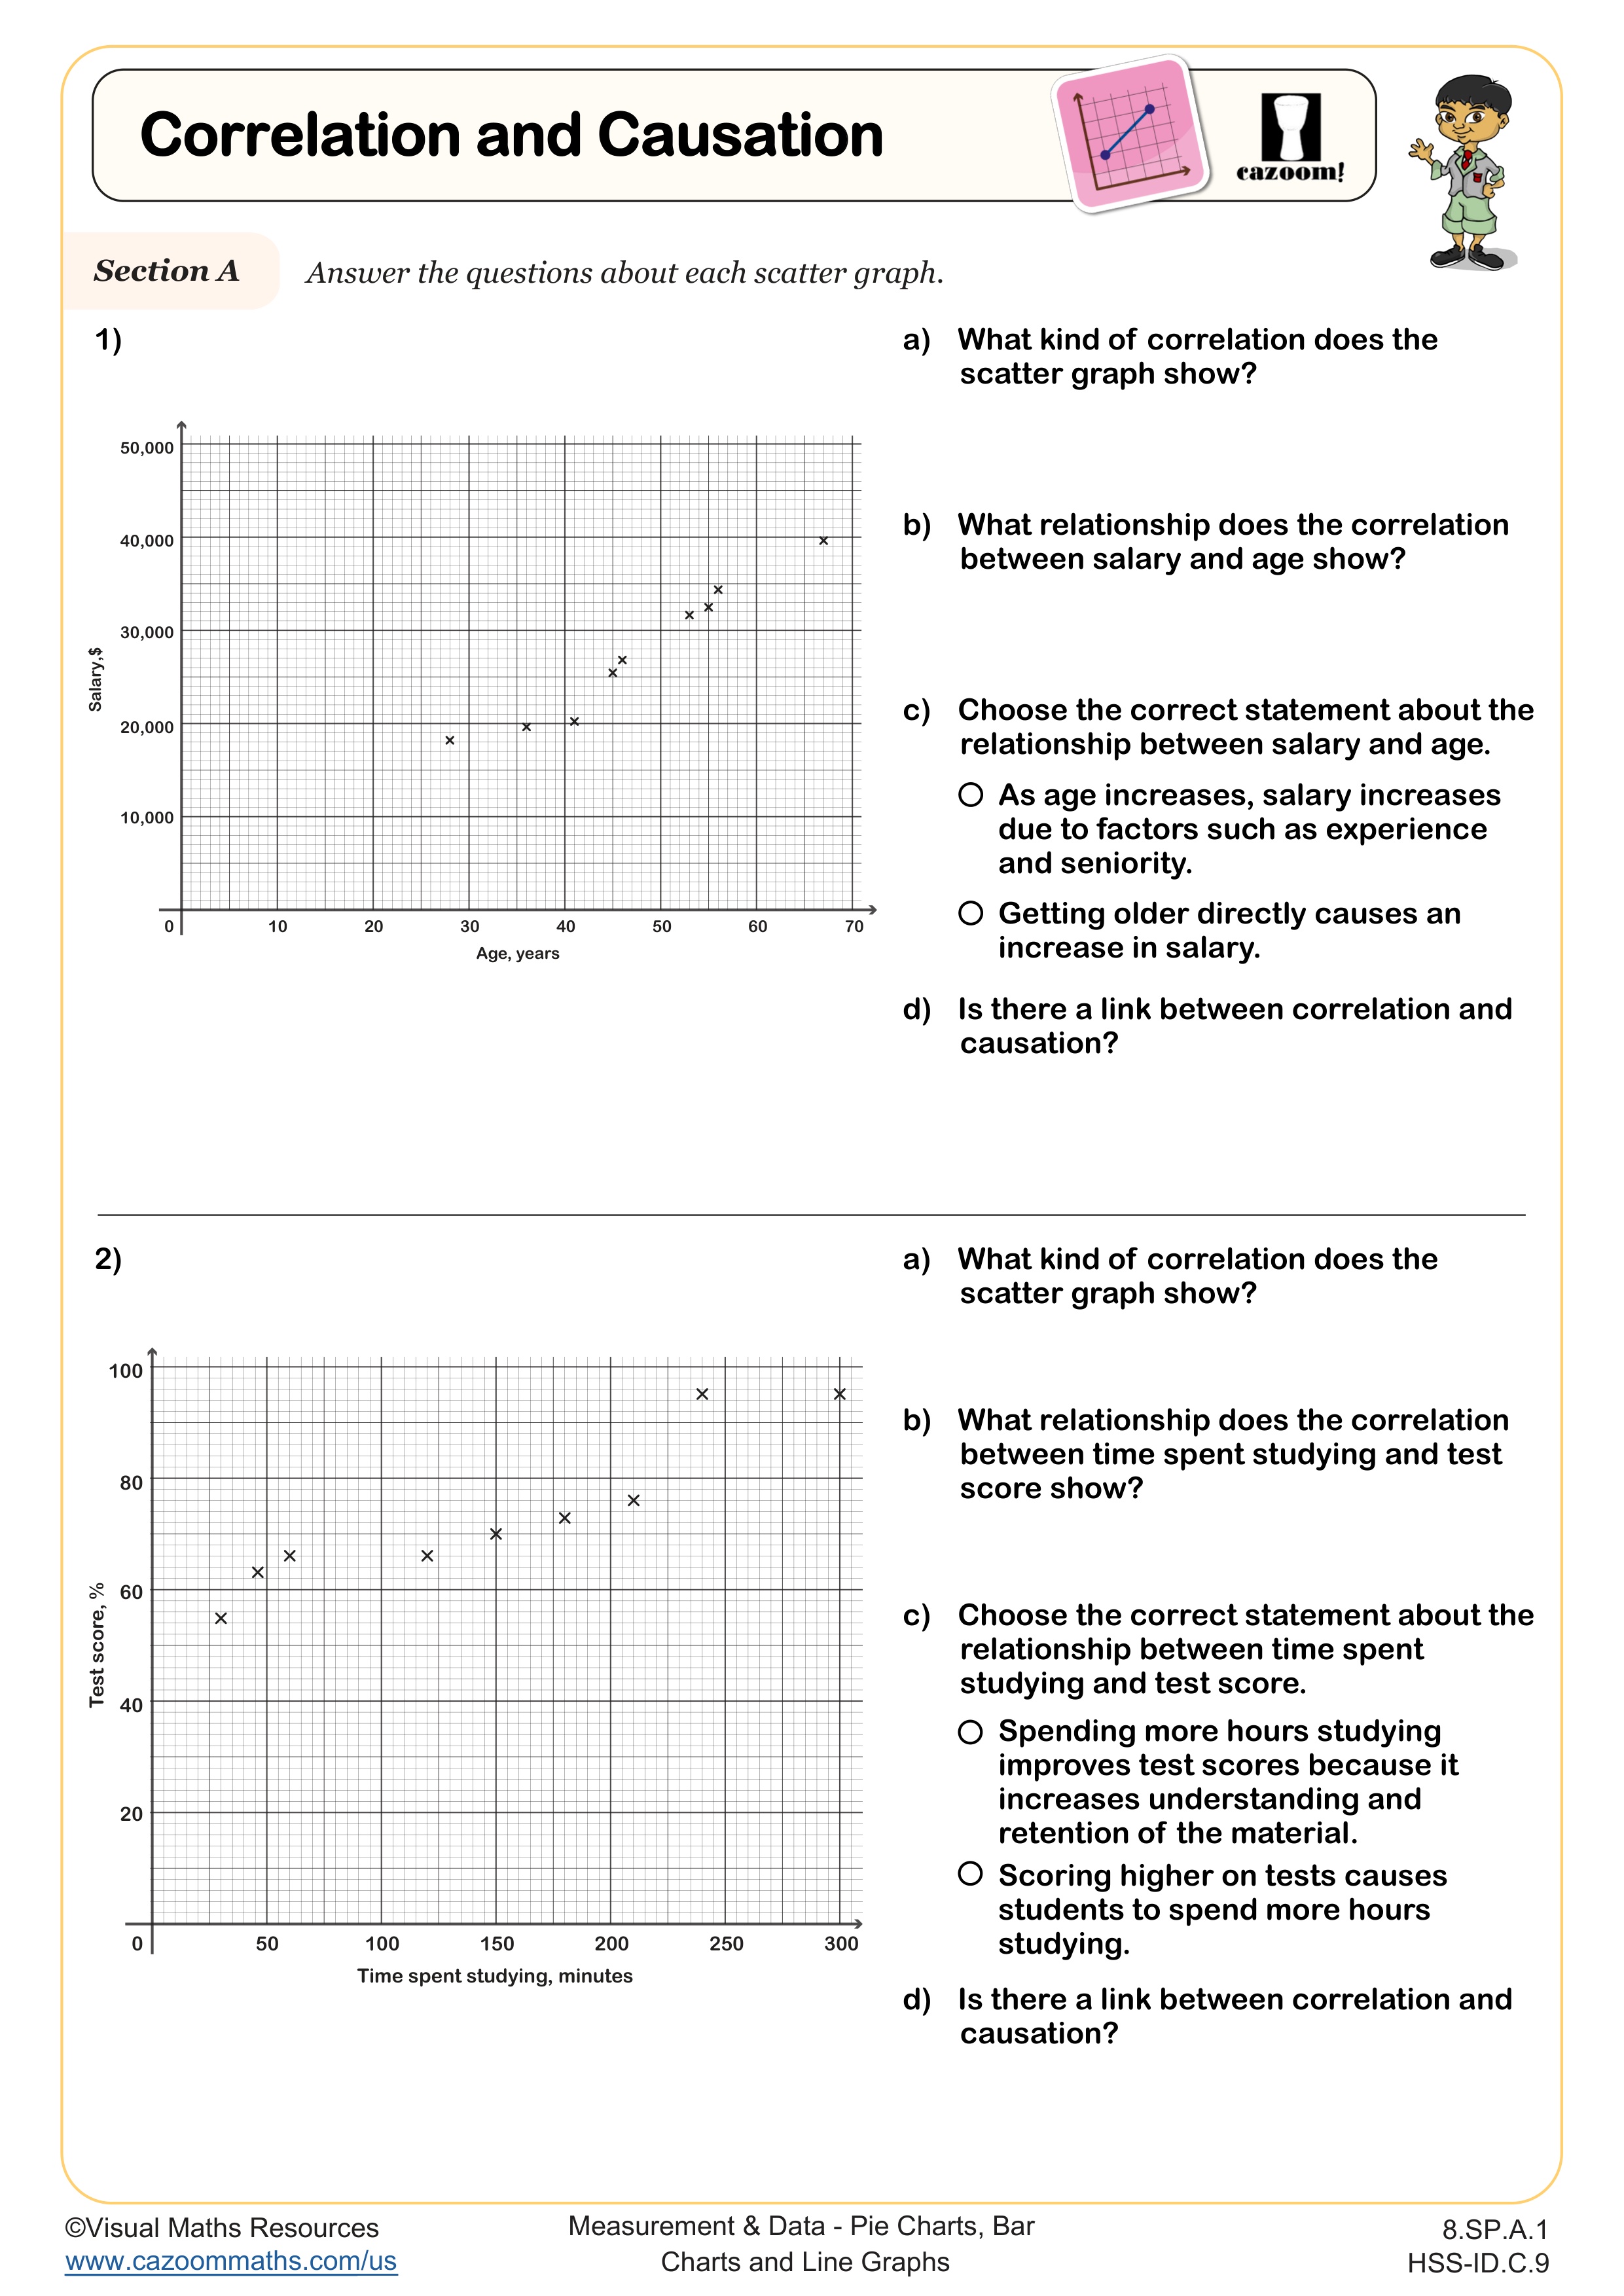
Students often lose points by choosing pie charts when data doesn't represent parts of a whole or when comparing quantities that exceed 100% combined. A classic error involves creating a pie chart for data like "favorite sports" where totals come from overlapping categories (students who play multiple sports). Teachers notice that asking "Does this data show pieces of one whole thing?" helps students select the appropriate graph type and avoid this common pitfall on assessments.
What Grade Level Uses Pie Chart and Bar Chart Worksheets?
These worksheets target eighth grade students in middle school, aligning with standards that require increasingly sophisticated data interpretation and display. At this level, students move beyond simple graph reading to analyzing relationships within data, constructing two-way tables, and defending their choice of graphical representation based on data characteristics and the questions being investigated.
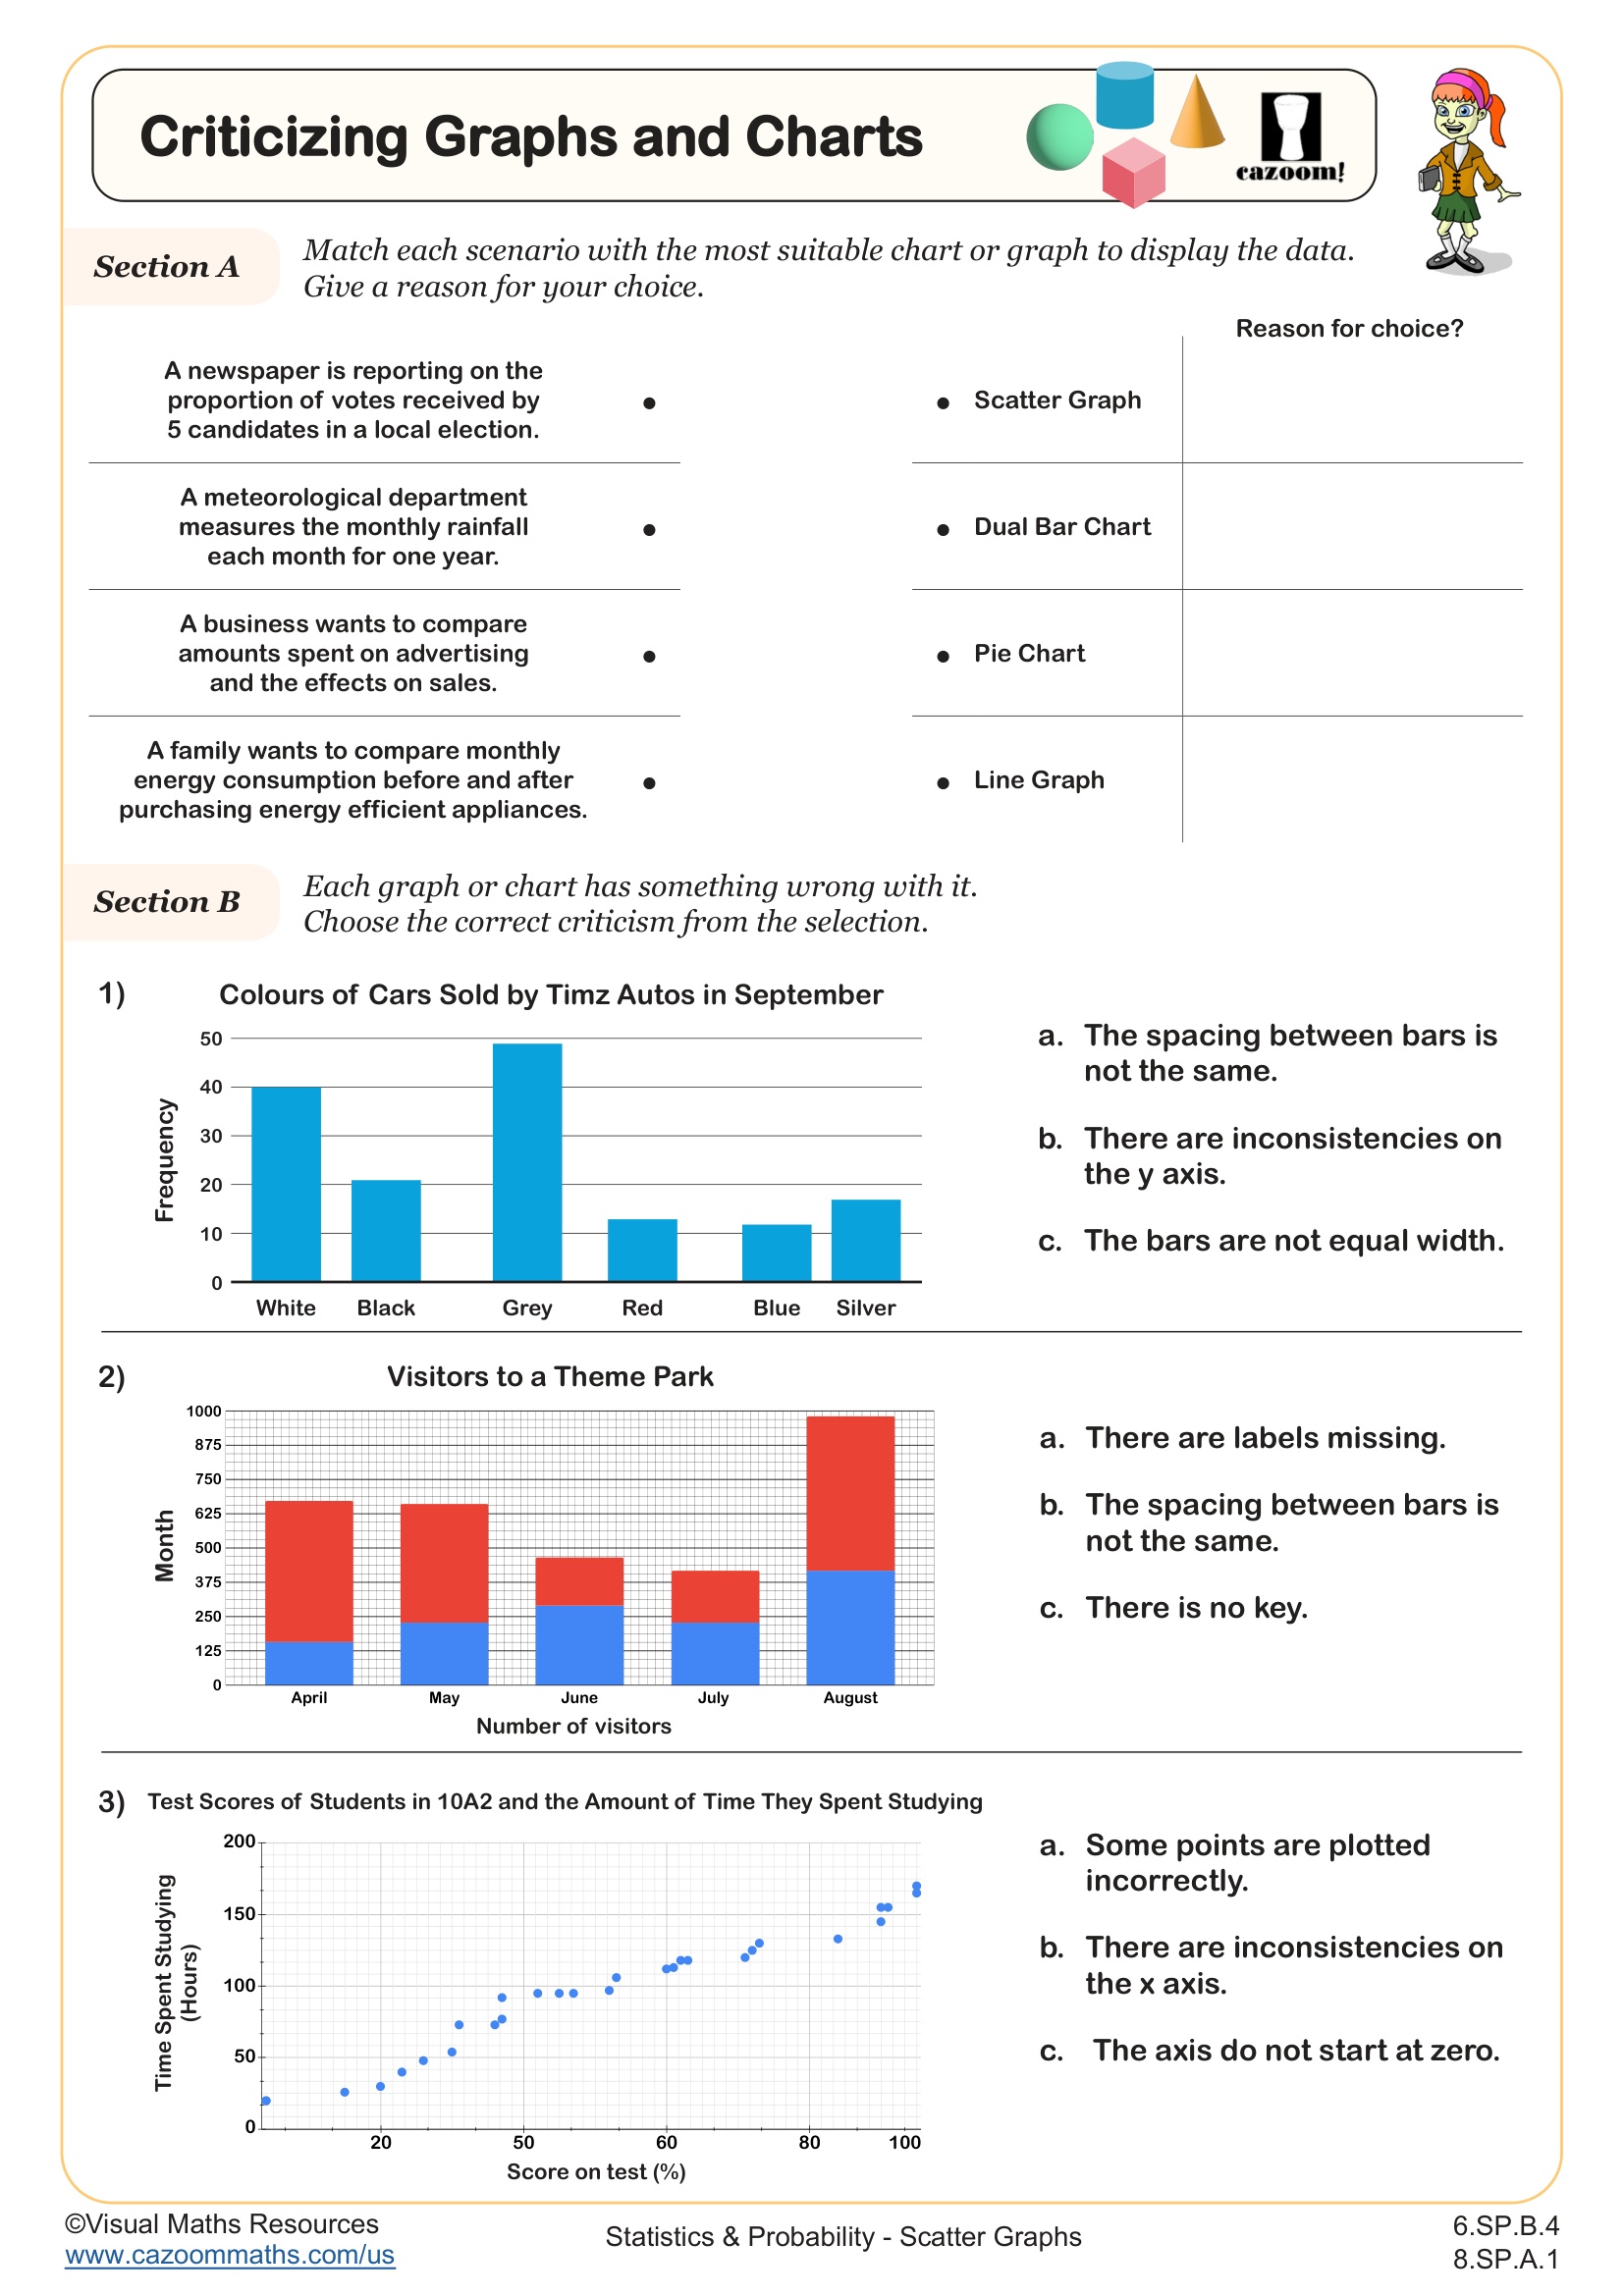
The progression in eighth grade involves working with more complex scales, non-uniform intervals, and composite bar graphs that display multiple data sets simultaneously. Students also encounter block diagrams that require careful attention to proportional spacing. Teachers observe that students who mastered basic bar graph interpretation in earlier grades still need explicit instruction on reading scales that use increments like 2.5 or 250, particularly when extrapolating values that fall between labeled gridlines.
How Do Two-Way Tables Connect to Bar Charts?
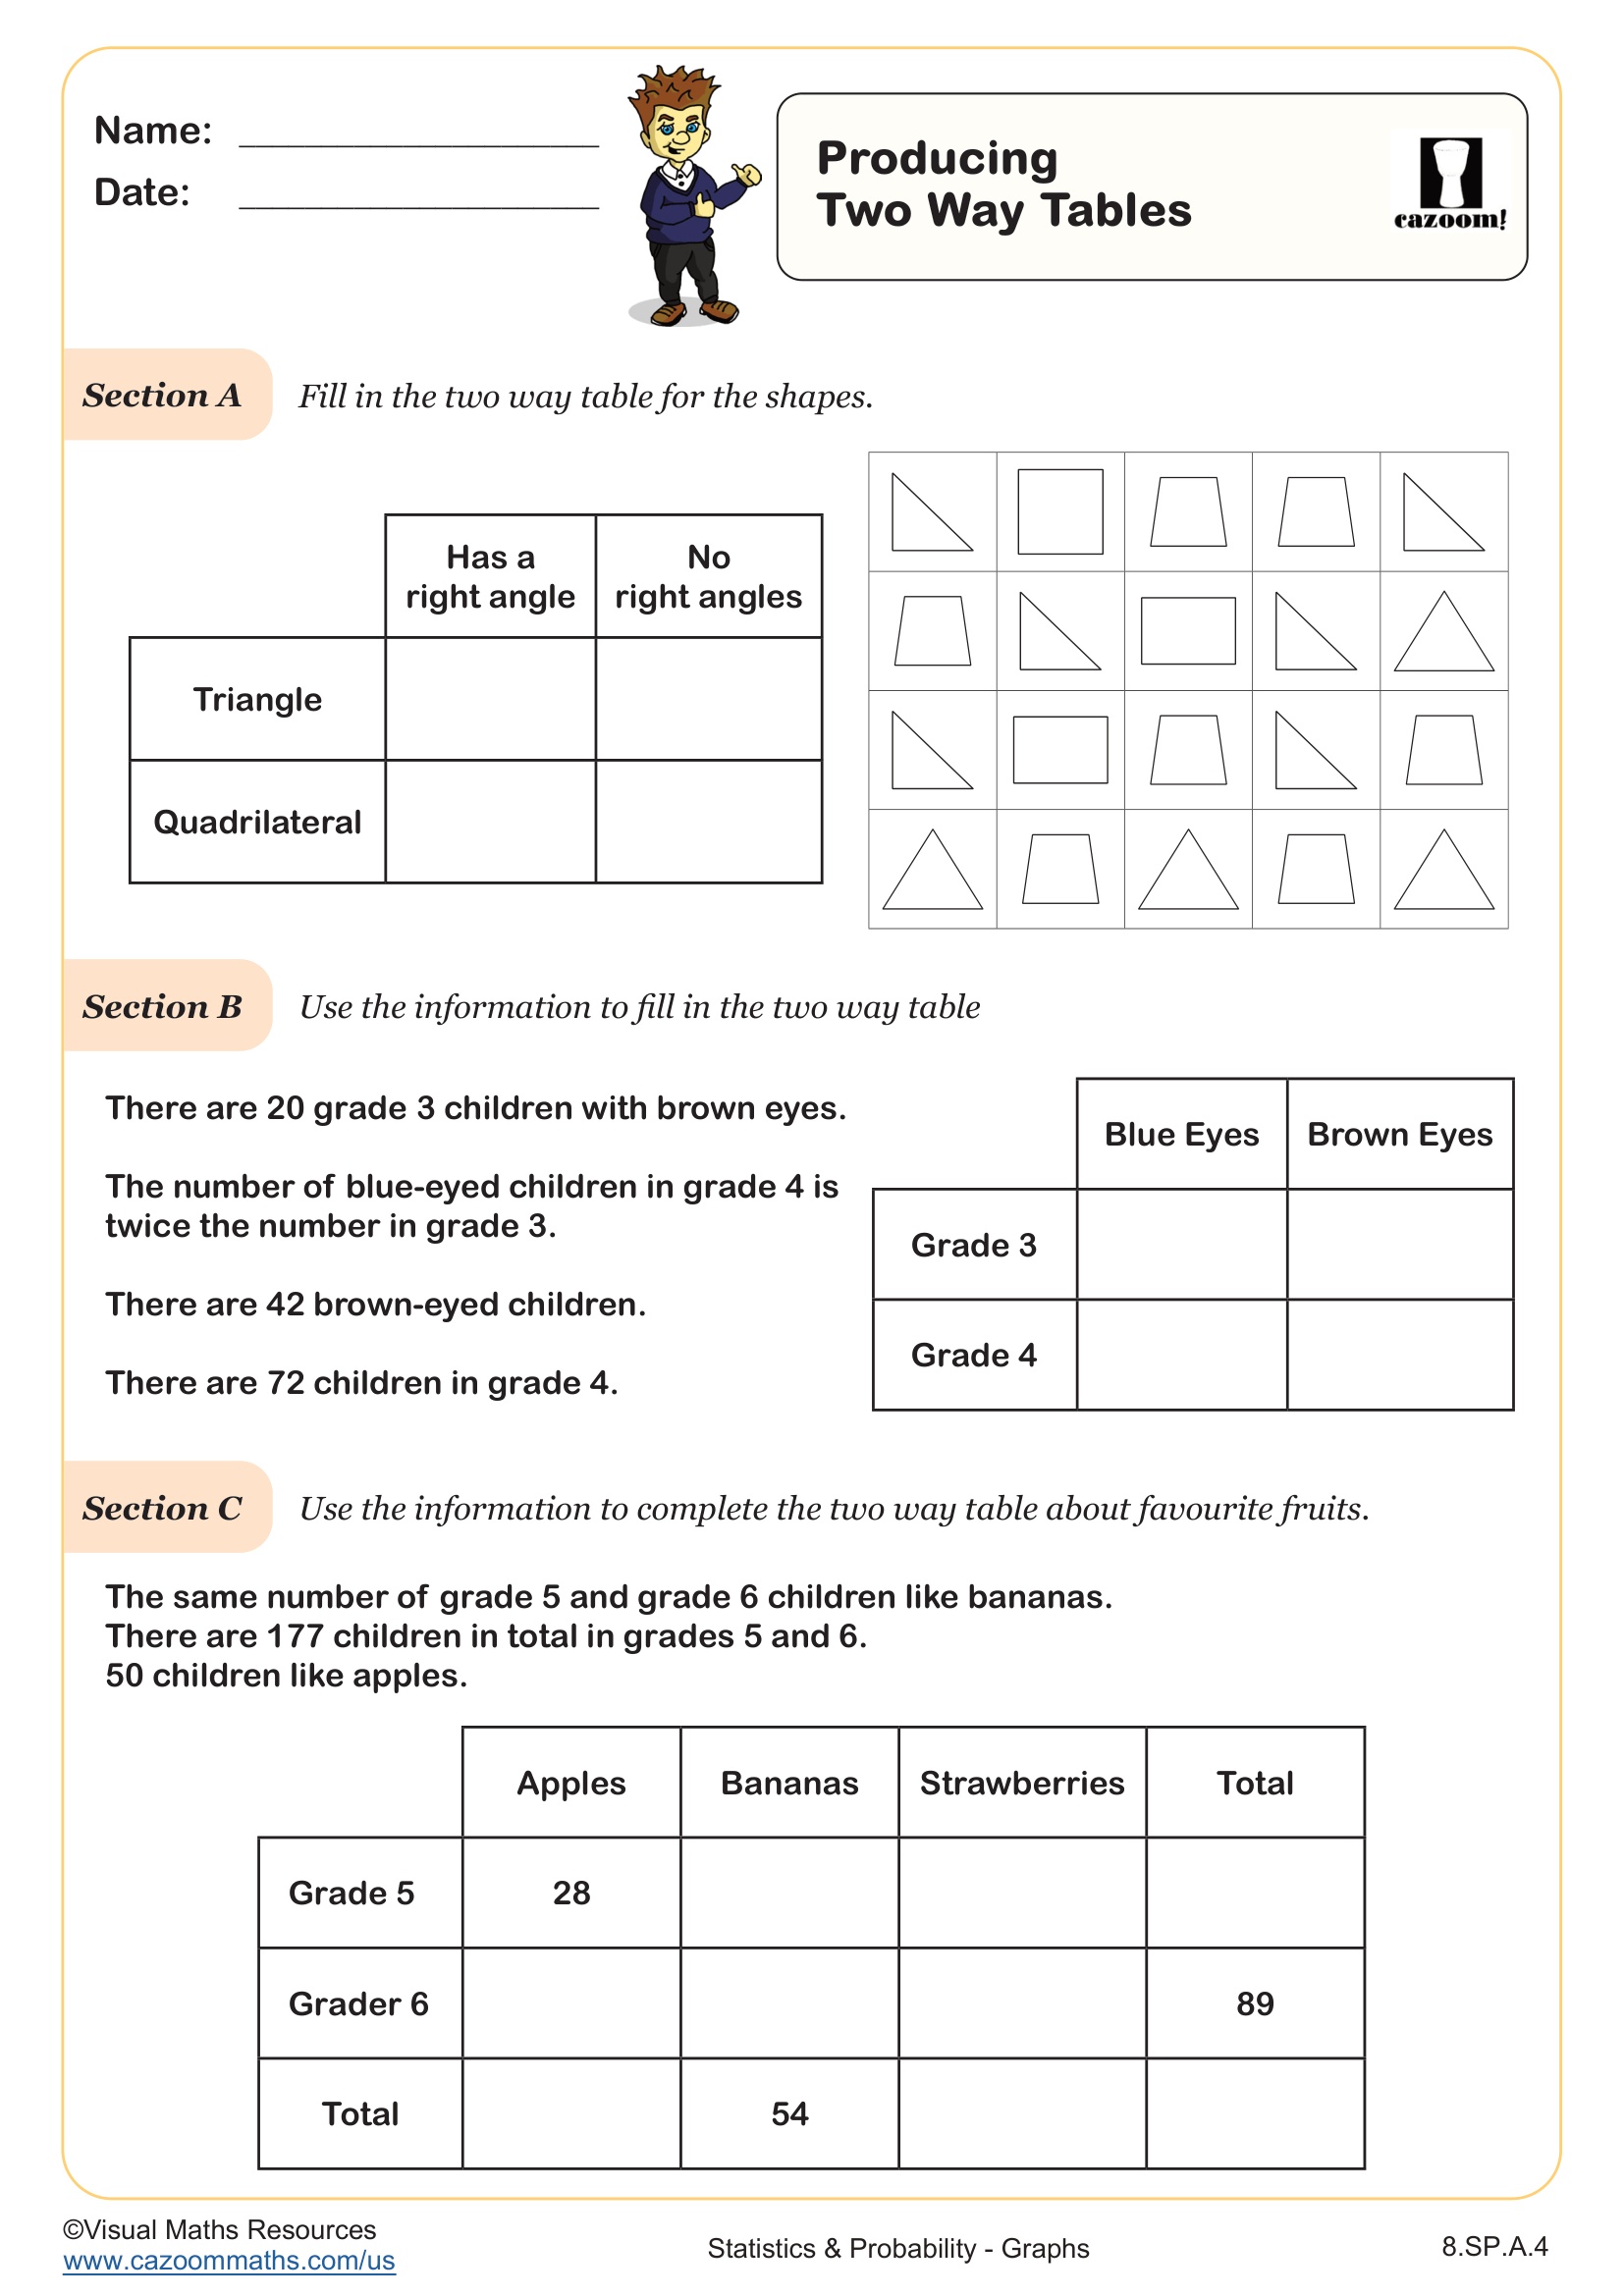
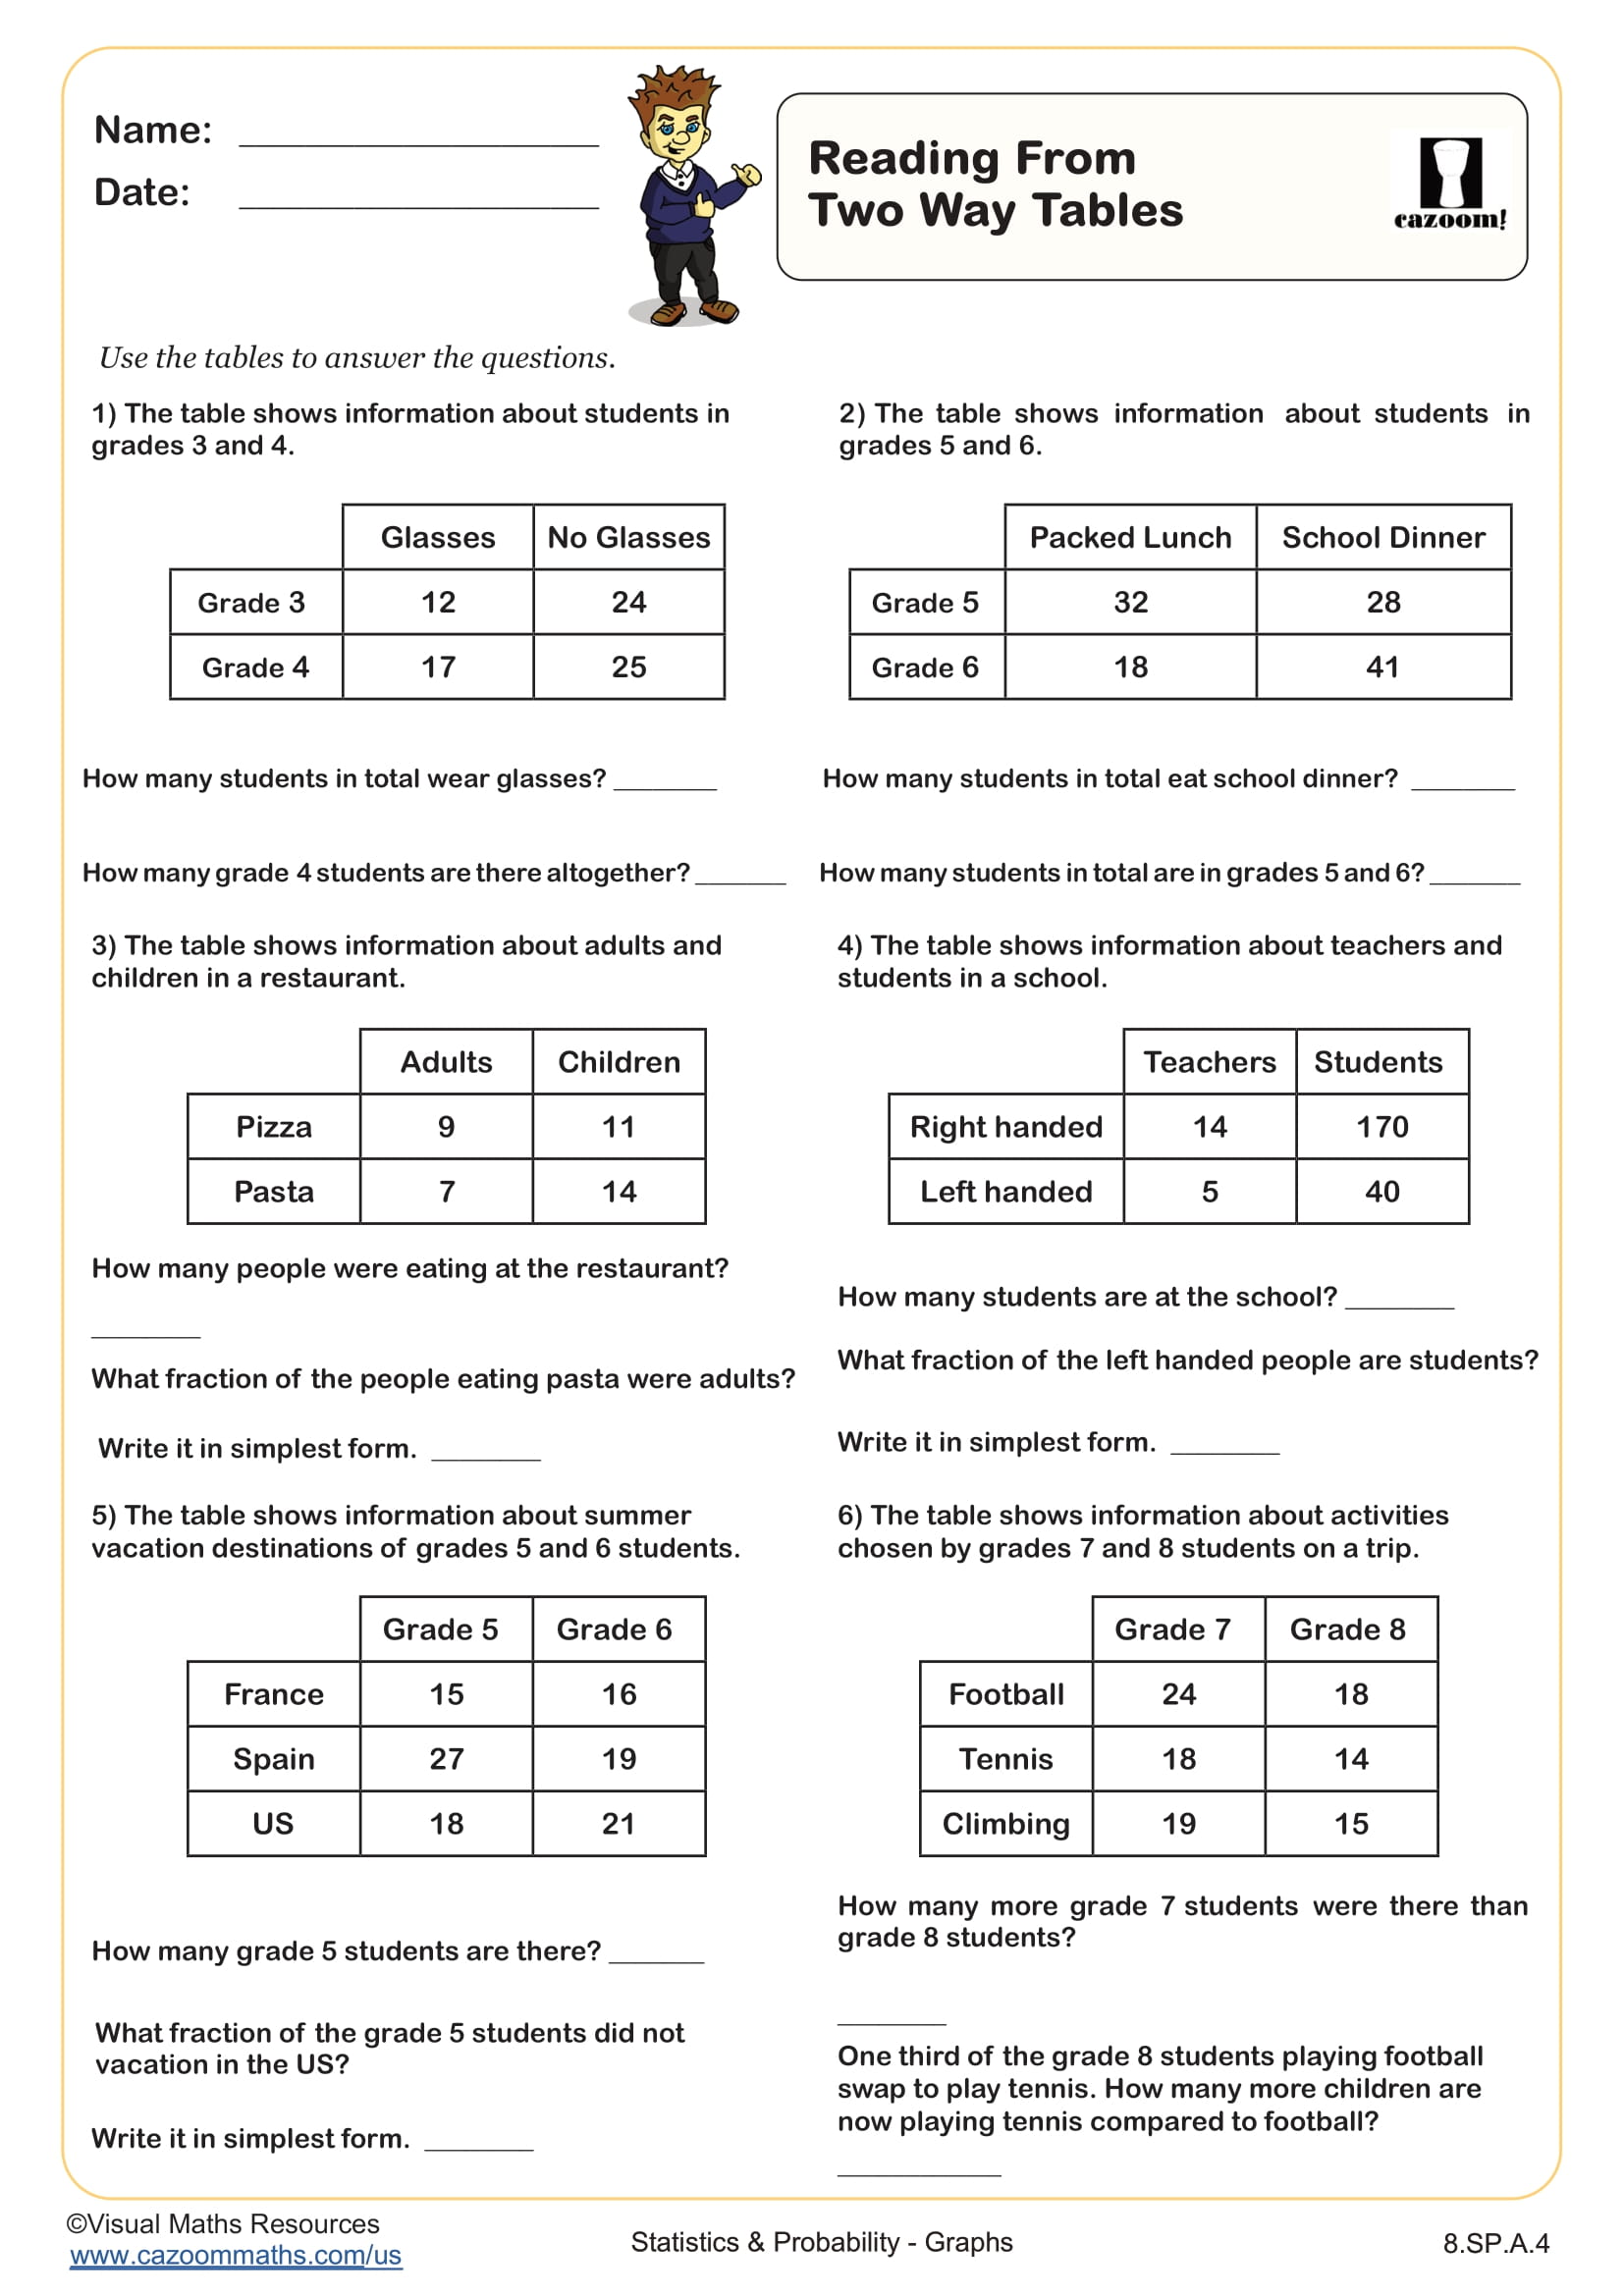
Two-way tables organize categorical data by showing the frequency or count for combinations of two variables, creating a grid structure where rows represent one category and columns represent another. Students learn to extract totals, calculate marginal frequencies, and identify patterns within the table structure. This skill directly supports creating grouped or stacked bar charts that visualize the same relationships graphically.
Data scientists and market researchers use two-way tables extensively when analyzing survey results or consumer behavior patterns. For example, a product development team might use a two-way table showing age groups versus product preferences, then create a grouped bar chart to present findings to stakeholders. Students who master converting between table and graph formats develop the flexibility to choose the clearest representation for their audience, a critical skill in STEM fields where communicating findings matters as much as the analysis itself.
How Should Teachers Use These Pie Chart and Bar Chart Worksheets?
These worksheets provide scaffolded practice that progresses from reading existing graphs to constructing original visualizations and selecting appropriate representations. The answer keys allow students to self-check during independent practice or enable quick verification during small group instruction, helping teachers identify whether errors stem from calculation mistakes, scale misreading, or conceptual misunderstandings about which graph type fits the data.
Many teachers use these worksheets for differentiated intervention, assigning specific subtopics like reading bar graphs to students who struggle with scale interpretation while challenging advanced learners with graph selection problems that require justification. The materials work effectively as homework review before assessment units on statistics, as station activities during data analysis lessons, or as paired work where one student creates a graph and their partner extracts information from it. Teachers report that this reciprocal practice strengthens both construction and interpretation skills simultaneously.