8th Grade Proportion Worksheets
All worksheets are created by the team of experienced teachers at Cazoom Math.
What Are Proportions and Why Do Students Need to Master Them?
Proportions are equations that show two ratios are equivalent, written in the form a/b = c/d. In 8th grade, students move beyond simply finding missing values in proportions to understanding the algebraic structure behind them and recognizing proportional relationships in graphs, tables, and real-world contexts. This topic directly supports Common Core standard 8.EE.B.5, which requires students to graph proportional relationships and interpret the unit rate as the slope of the line.
Students often struggle with setting up proportions correctly, particularly when units differ or when the problem involves inverse relationships rather than direct proportions. A common error appears when students write 3 feet/1 yard = x feet/5 yards instead of recognizing they need consistent unit placement on each side. Teachers notice that students who label their ratios carefully (writing what each number represents) make significantly fewer setup errors than those who rush to cross-multiply without checking their work.
What Should 8th Graders Know About Proportions?
By 8th grade, students should fluently solve proportions using multiple methods including cross-multiplication, scaling up or down, and finding equivalent fractions. They need to recognize proportional relationships in tables by checking for a constant ratio, identify them in graphs as straight lines passing through the origin, and write equations in the form y = kx where k represents the constant of proportionality. Students should also distinguish between proportional and non-proportional relationships, understanding that proportional relationships always have a y-intercept of zero.
This work builds directly on 7th grade ratio and rate reasoning (7.RP.A.2) and prepares students for linear functions and slope concepts in high school algebra. The connection between the constant of proportionality and slope becomes particularly important when students enter Algebra I, where they'll work with y = mx + b. Students who master proportions in 8th grade find direct variation problems in algebra significantly easier because they've already internalized the relationship between two quantities that change at a constant rate.
How Do Conversion Graphs Help Students Understand Proportions?
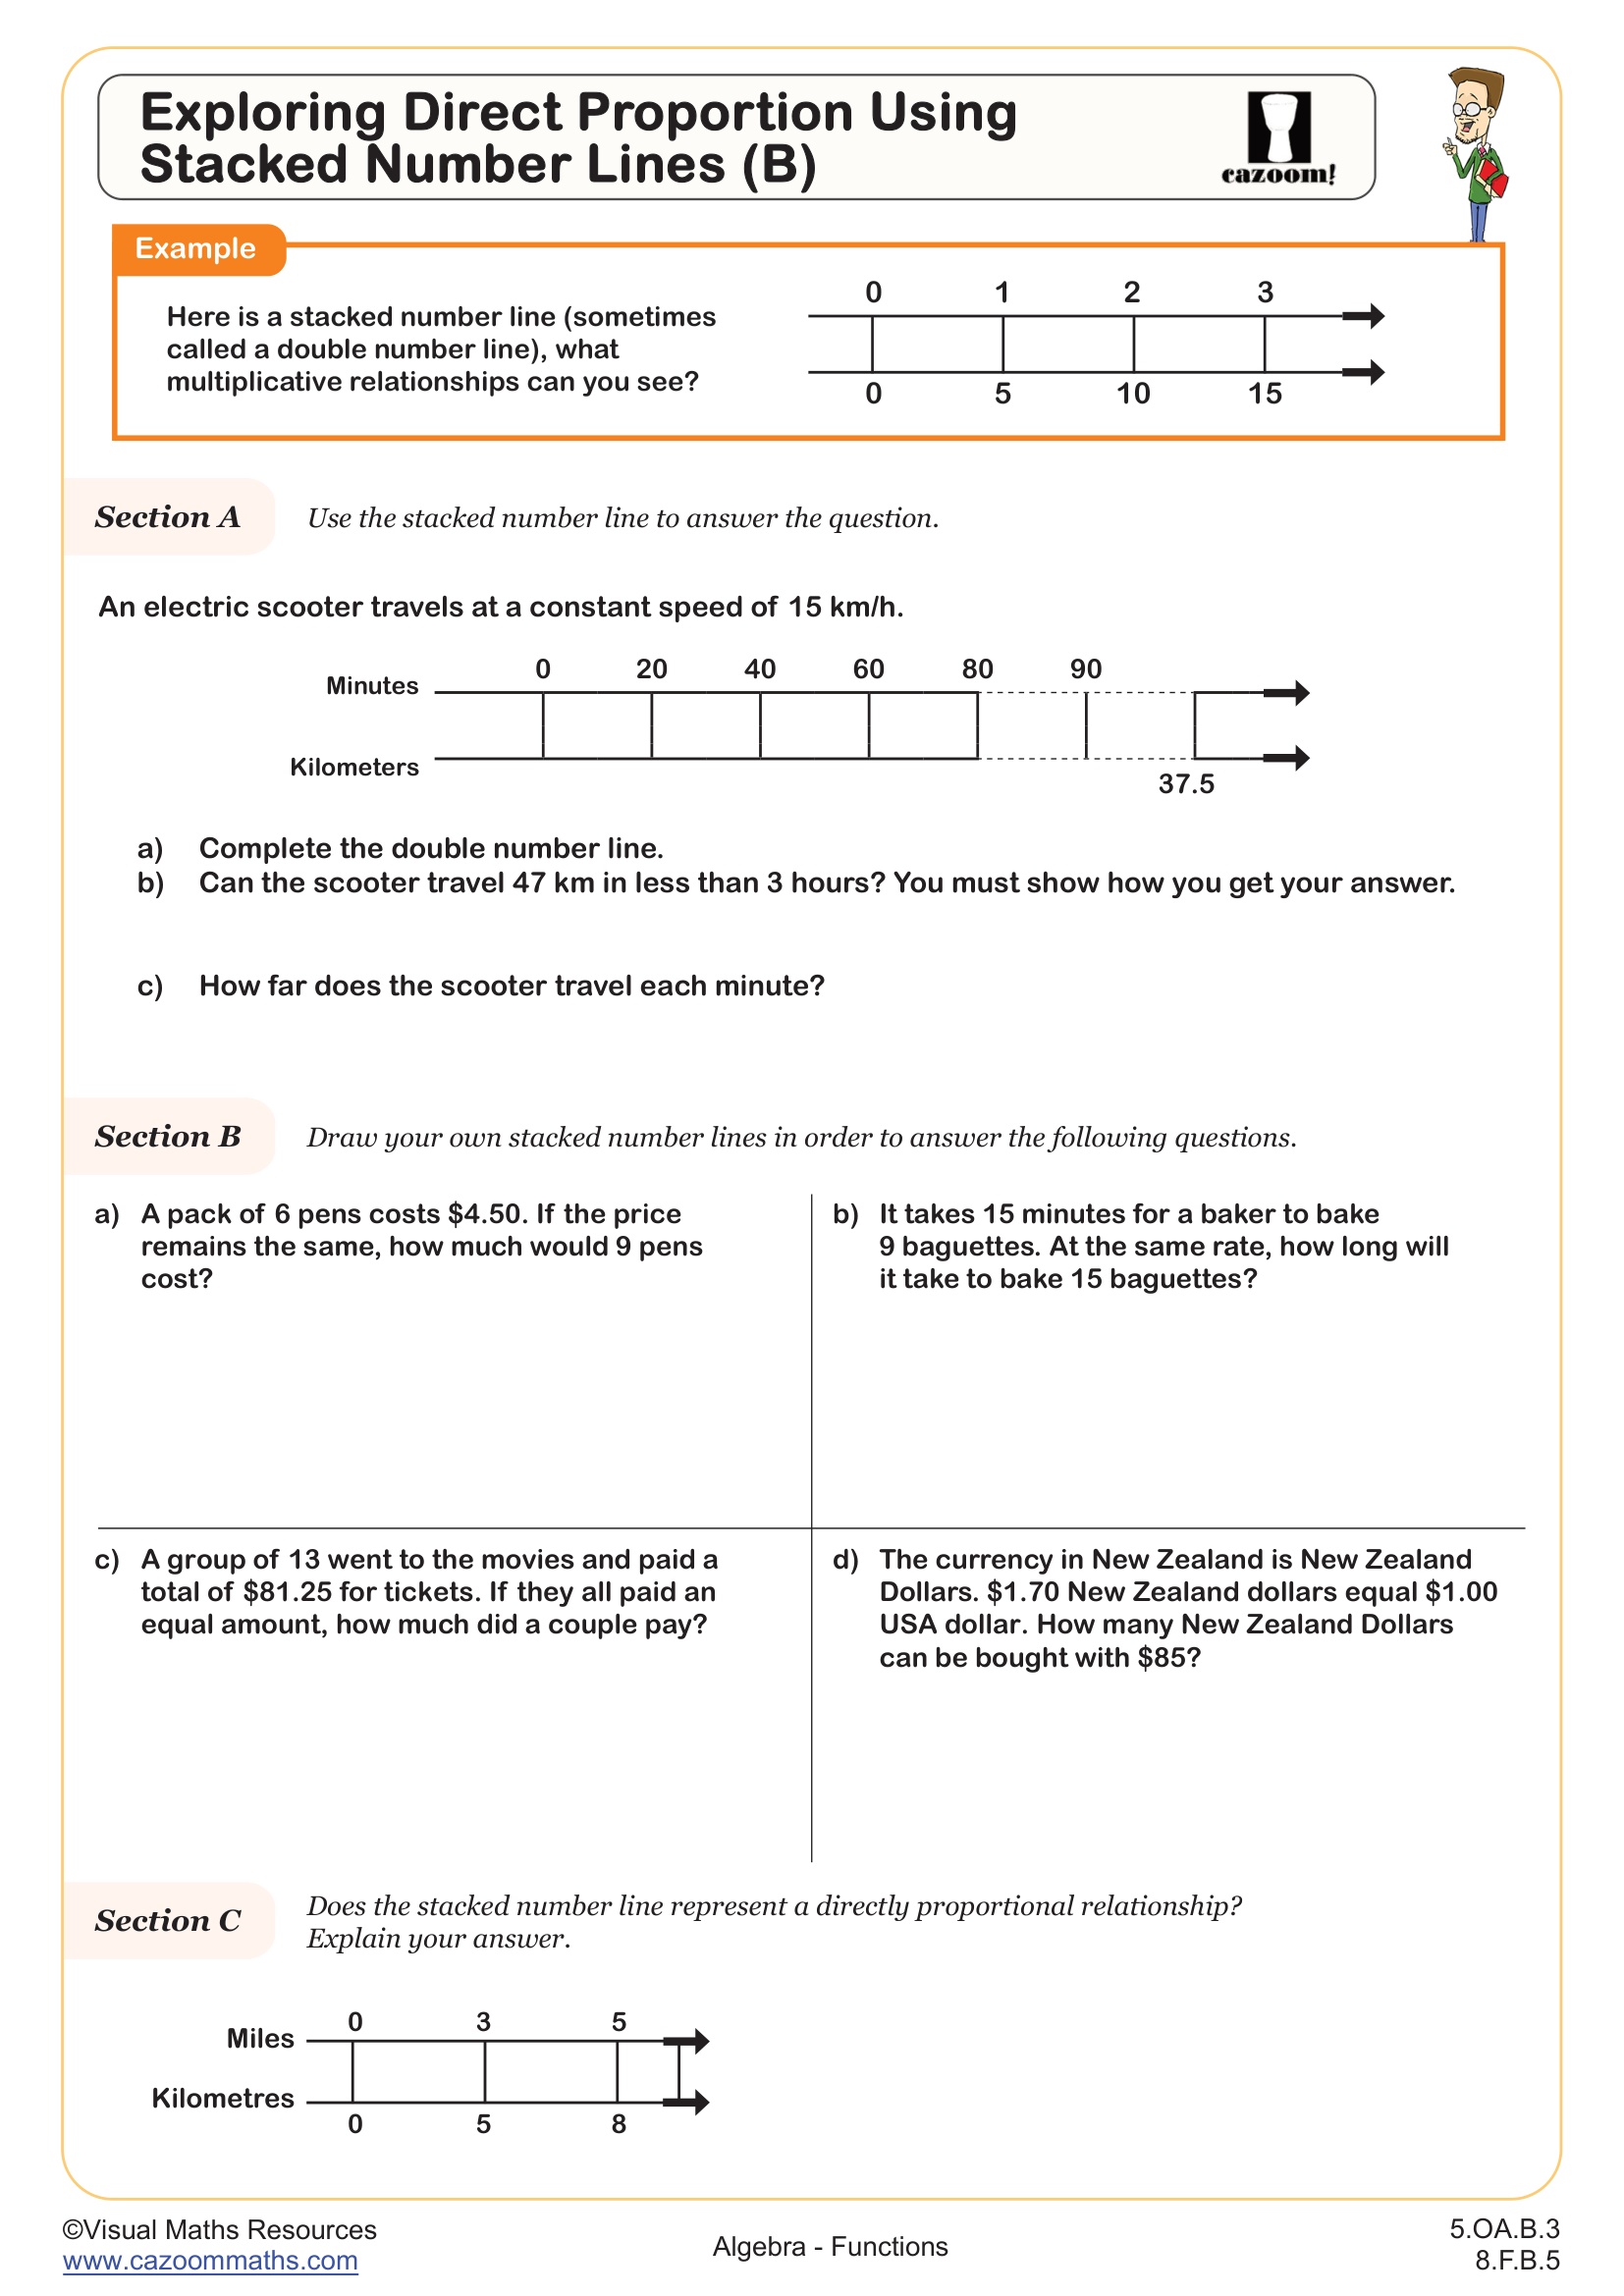
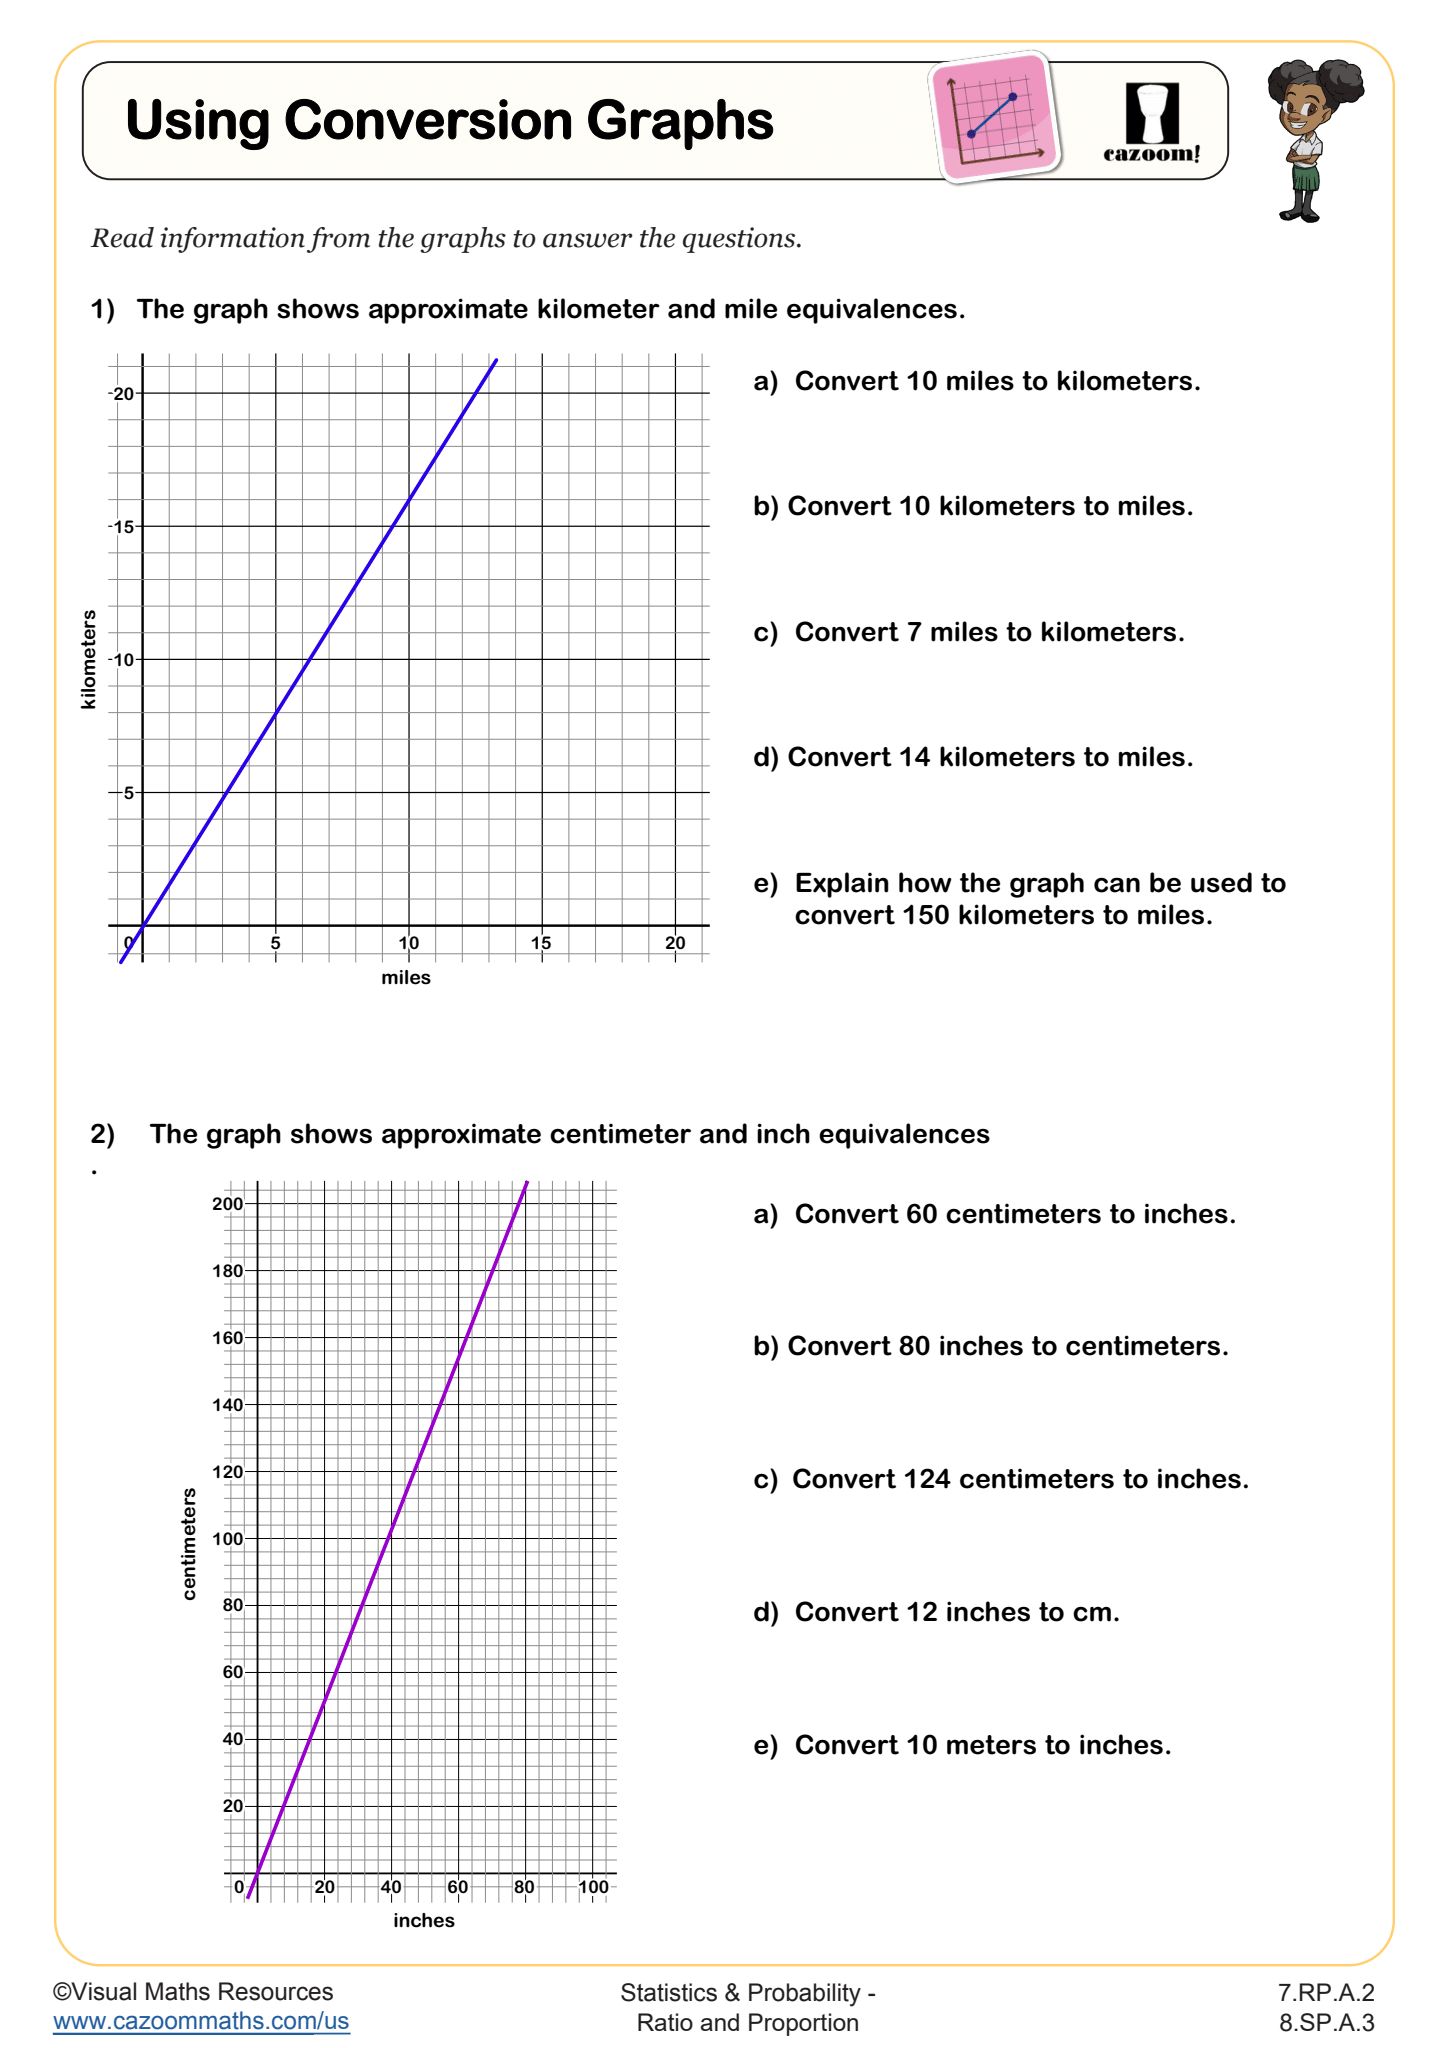
Conversion graphs provide a visual representation of proportional relationships, showing how one quantity changes in relation to another on a coordinate plane. These graphs always form straight lines through the origin, with the slope representing the conversion factor or constant of proportionality. Students learn to read values directly from the graph, interpolate between marked points, and extrapolate beyond the given data using the linear pattern. Teachers observe that students who work with conversion graphs develop stronger intuition about whether their calculated answers make sense in context.
Conversion graphs connect directly to science and engineering applications, where students need to convert between measurement systems or analyze relationships between variables. For example, converting between Celsius and Fahrenheit temperatures, calculating currency exchange rates, or determining fuel efficiency all involve proportional reasoning that can be represented graphically. In physics classes, students use these same skills when analyzing distance-time graphs or exploring relationships between force and acceleration, making proportion work an essential foundation for STEM coursework throughout high school.
How Can Teachers Use These Proportion Worksheets Most Effectively?
These worksheets offer different entry points into proportion work, allowing teachers to select materials based on where students need support. The stacked number line approach helps visual learners see the multiplicative relationship between quantities, while the algebraic solving worksheet reinforces procedural fluency with cross-multiplication and equation solving. Conversion graphs bridge concrete visual reasoning and abstract algebraic thinking. Teachers can use the varied formats to differentiate instruction, assigning visual models to students who need concrete representations while challenging advanced students with multi-step proportion problems.
Many teachers use these worksheets during small group instruction to address specific gaps, particularly when reviewing for state assessments where proportion problems consistently appear. The complete answer keys make them practical for homework assignments where students need immediate feedback, or for self-paced learning stations where students check their own work. Paired practice works particularly well with proportion worksheets, as students can verify their cross-multiplication steps with a partner before solving, catching setup errors before they lead to incorrect answers.