8th Grade Statistics and Probability Worksheets
All worksheets are created by the team of experienced teachers at Cazoom Math.
What topics do statistics and probability worksheets cover for 8th graders?
Statistics and probability worksheet collections for 8th grade align with Common Core standards 8.SP.1 through 8.SP.4, covering bivariate data analysis, scatter plots, lines of best fit, and two-way tables. Students work with measures of central tendency, create and interpret various graph types, and analyze patterns in data sets that connect to real-world contexts like sports statistics or scientific experiments.
Teachers report that students often make calculation errors when finding mean, median, and mode from frequency tables, particularly when the data is presented in grouped intervals rather than individual values. The probability worksheet 8th grade sections focus heavily on compound events, helping students distinguish between situations that require multiplication versus addition rules.
How do 8th grade statistics concepts build on earlier math skills?
Middle school statistics worksheets pdf format allows teachers to see how 8th grade concepts extend 7th grade work with single data sets to comparing two data sets and examining relationships between variables. Students move from basic bar graphs and histograms to scatter plots and trend analysis, requiring stronger algebraic thinking and proportional reasoning skills.
The progression becomes evident when students struggle with interpreting correlation versus causation in scatter plots. Teachers notice this misconception appears most frequently when students work with data sets showing strong correlations, like height and shoe size, where they incorrectly assume one variable directly causes changes in the other.
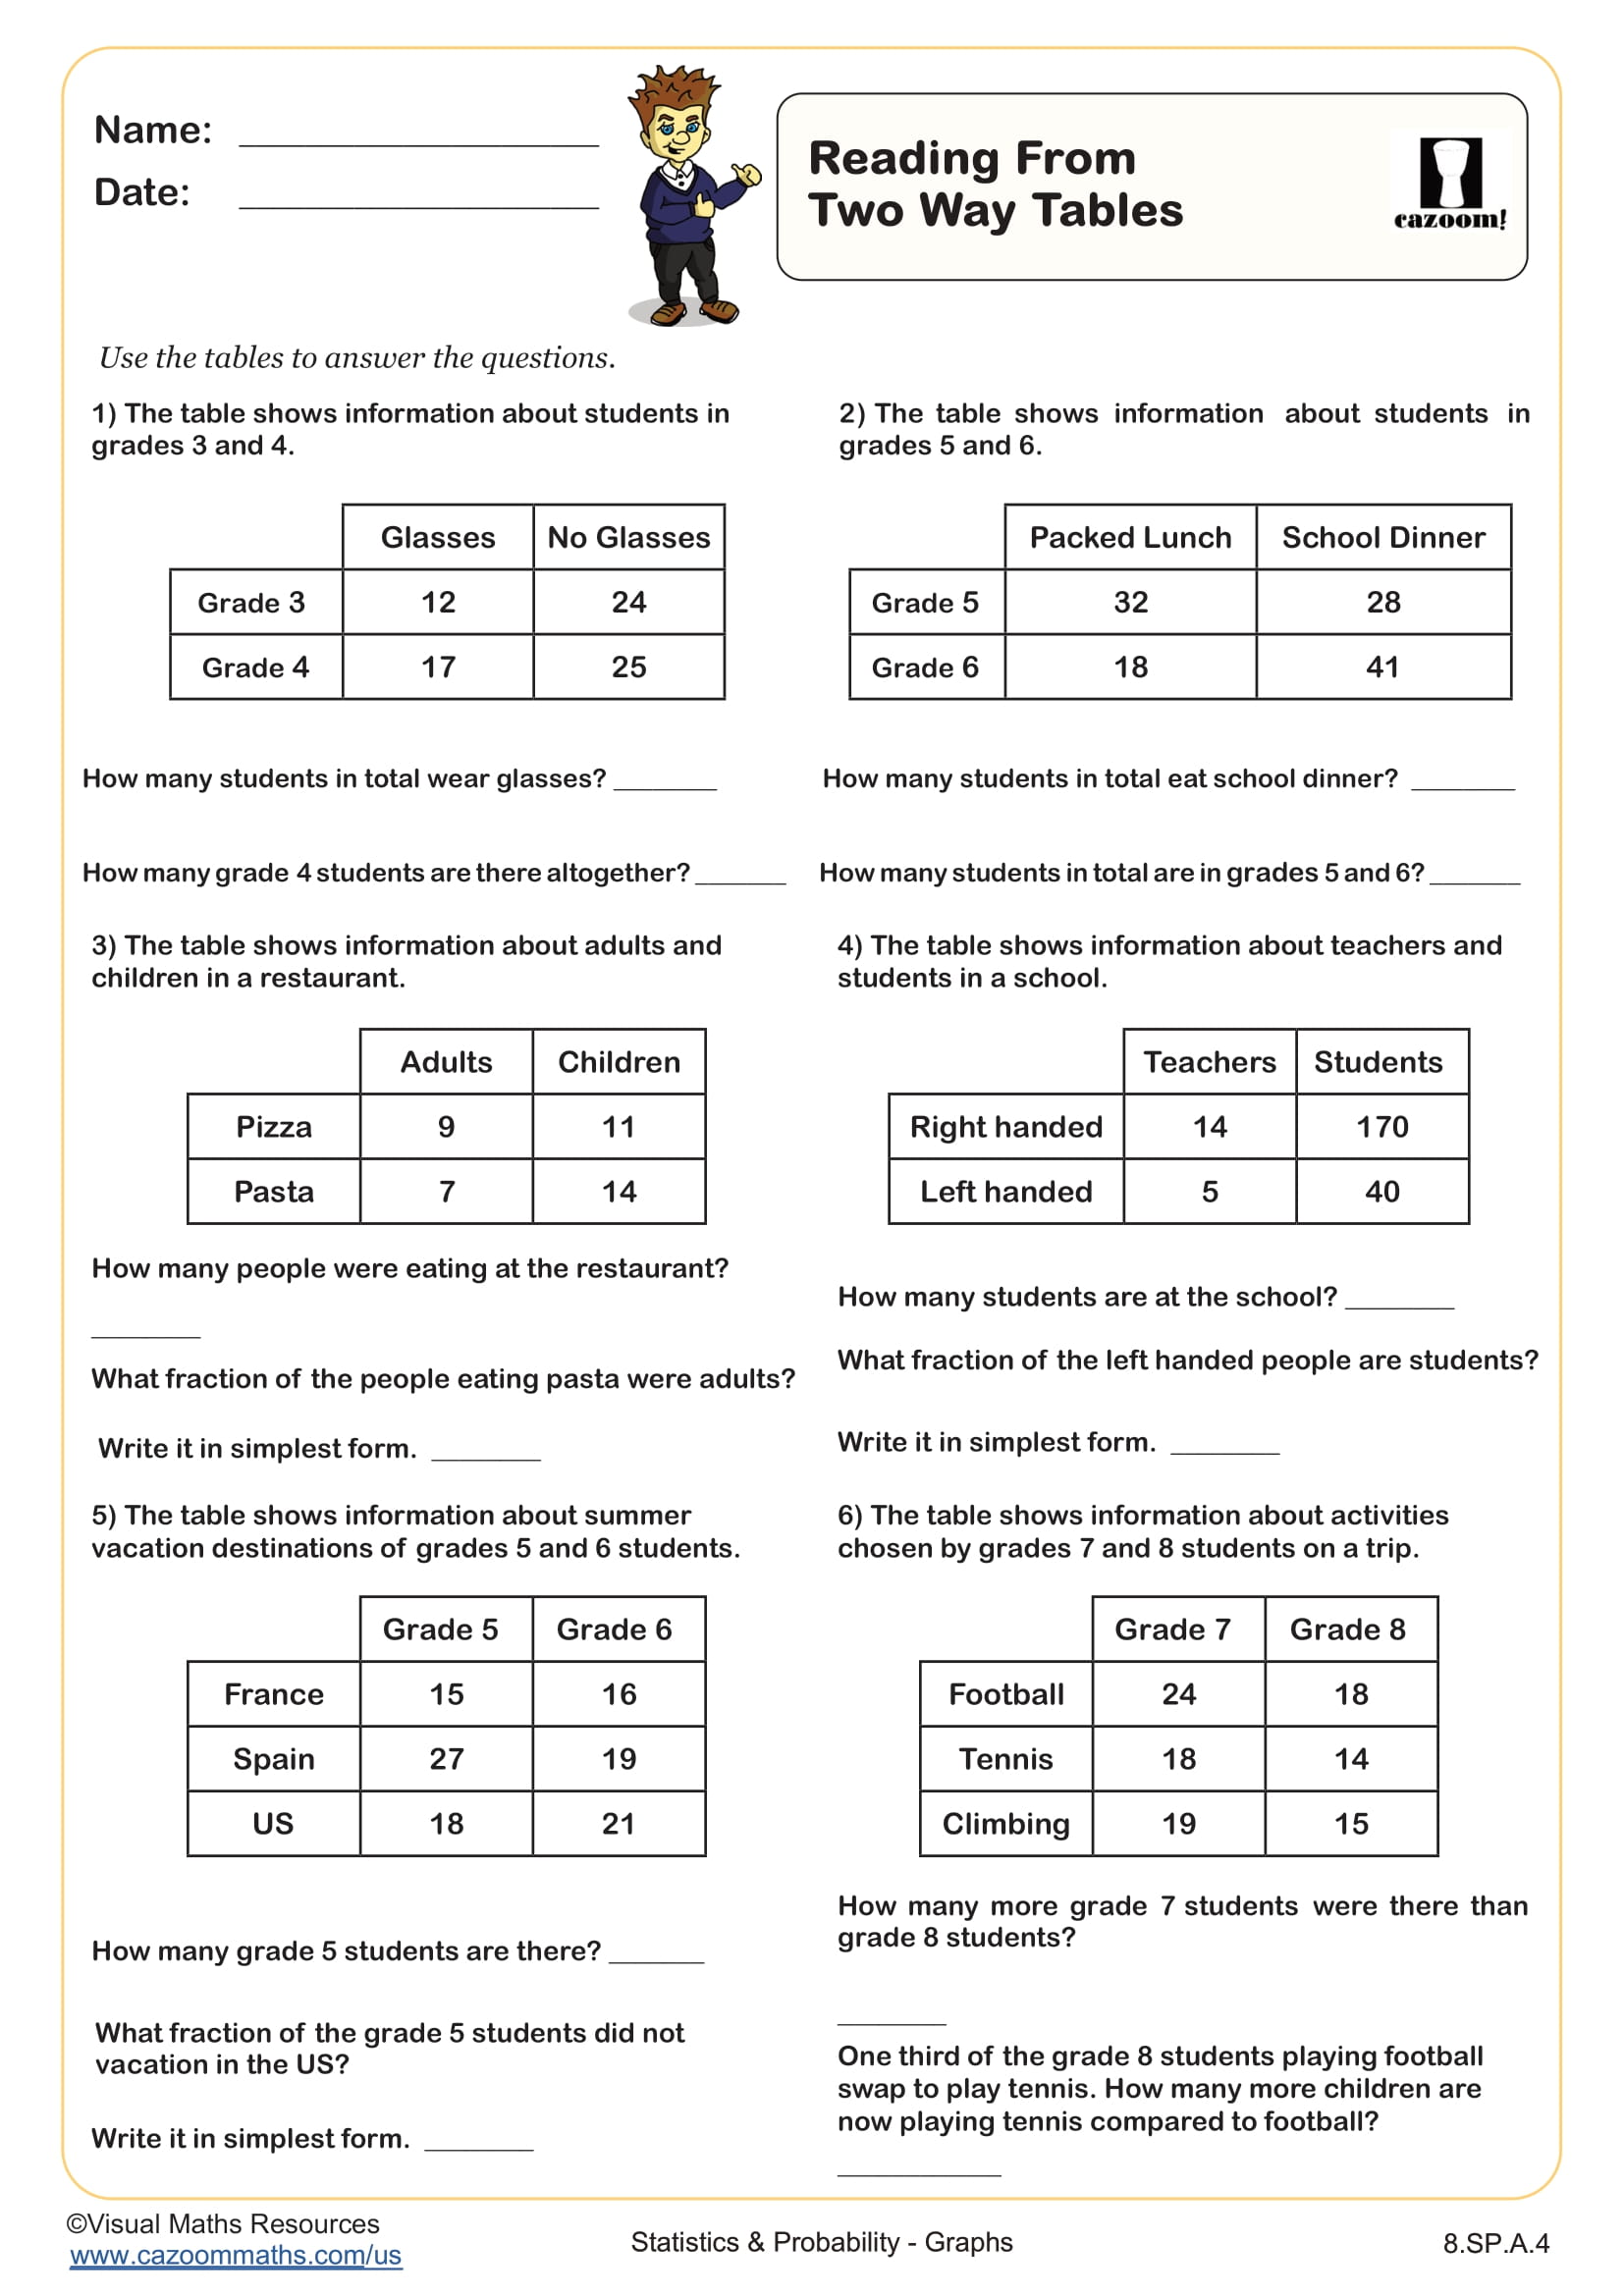
What makes two-way tables challenging for 8th grade students?
Two-way tables require students to organize categorical data and calculate relative frequencies, which combines their understanding of fractions, decimals, and percentages with logical reasoning. The 8th grade statistics curriculum emphasizes interpreting these tables to make conclusions about associations between two categorical variables, such as survey data comparing age groups and preferences.
Students frequently lose points by calculating frequencies incorrectly when finding conditional probabilities from two-way tables. Teachers observe that students often add across rows when they should be finding totals within specific categories, leading to probability calculations greater than 1, which signals the need for immediate correction and re-teaching.
How can teachers effectively use these worksheets in their statistics instruction?
Statistics 8th grade instruction benefits from using worksheets as formative assessment tools rather than just practice sheets. Teachers can assign different problems to small groups and have students present their solutions, revealing misconceptions about data interpretation that might not surface during individual work. The answer keys allow for quick verification during peer discussions.
Many teachers find success using these worksheets alongside real data collection projects, where students gather information from their school or community and then apply worksheet techniques to analyze their findings. This approach helps students see connections between classroom math and careers in data science, market research, or quality control in manufacturing.