Algebra I Functions Worksheets
All worksheets are created by the team of experienced teachers at Cazoom Math.
What Function Concepts Do Algebra I Students Learn?
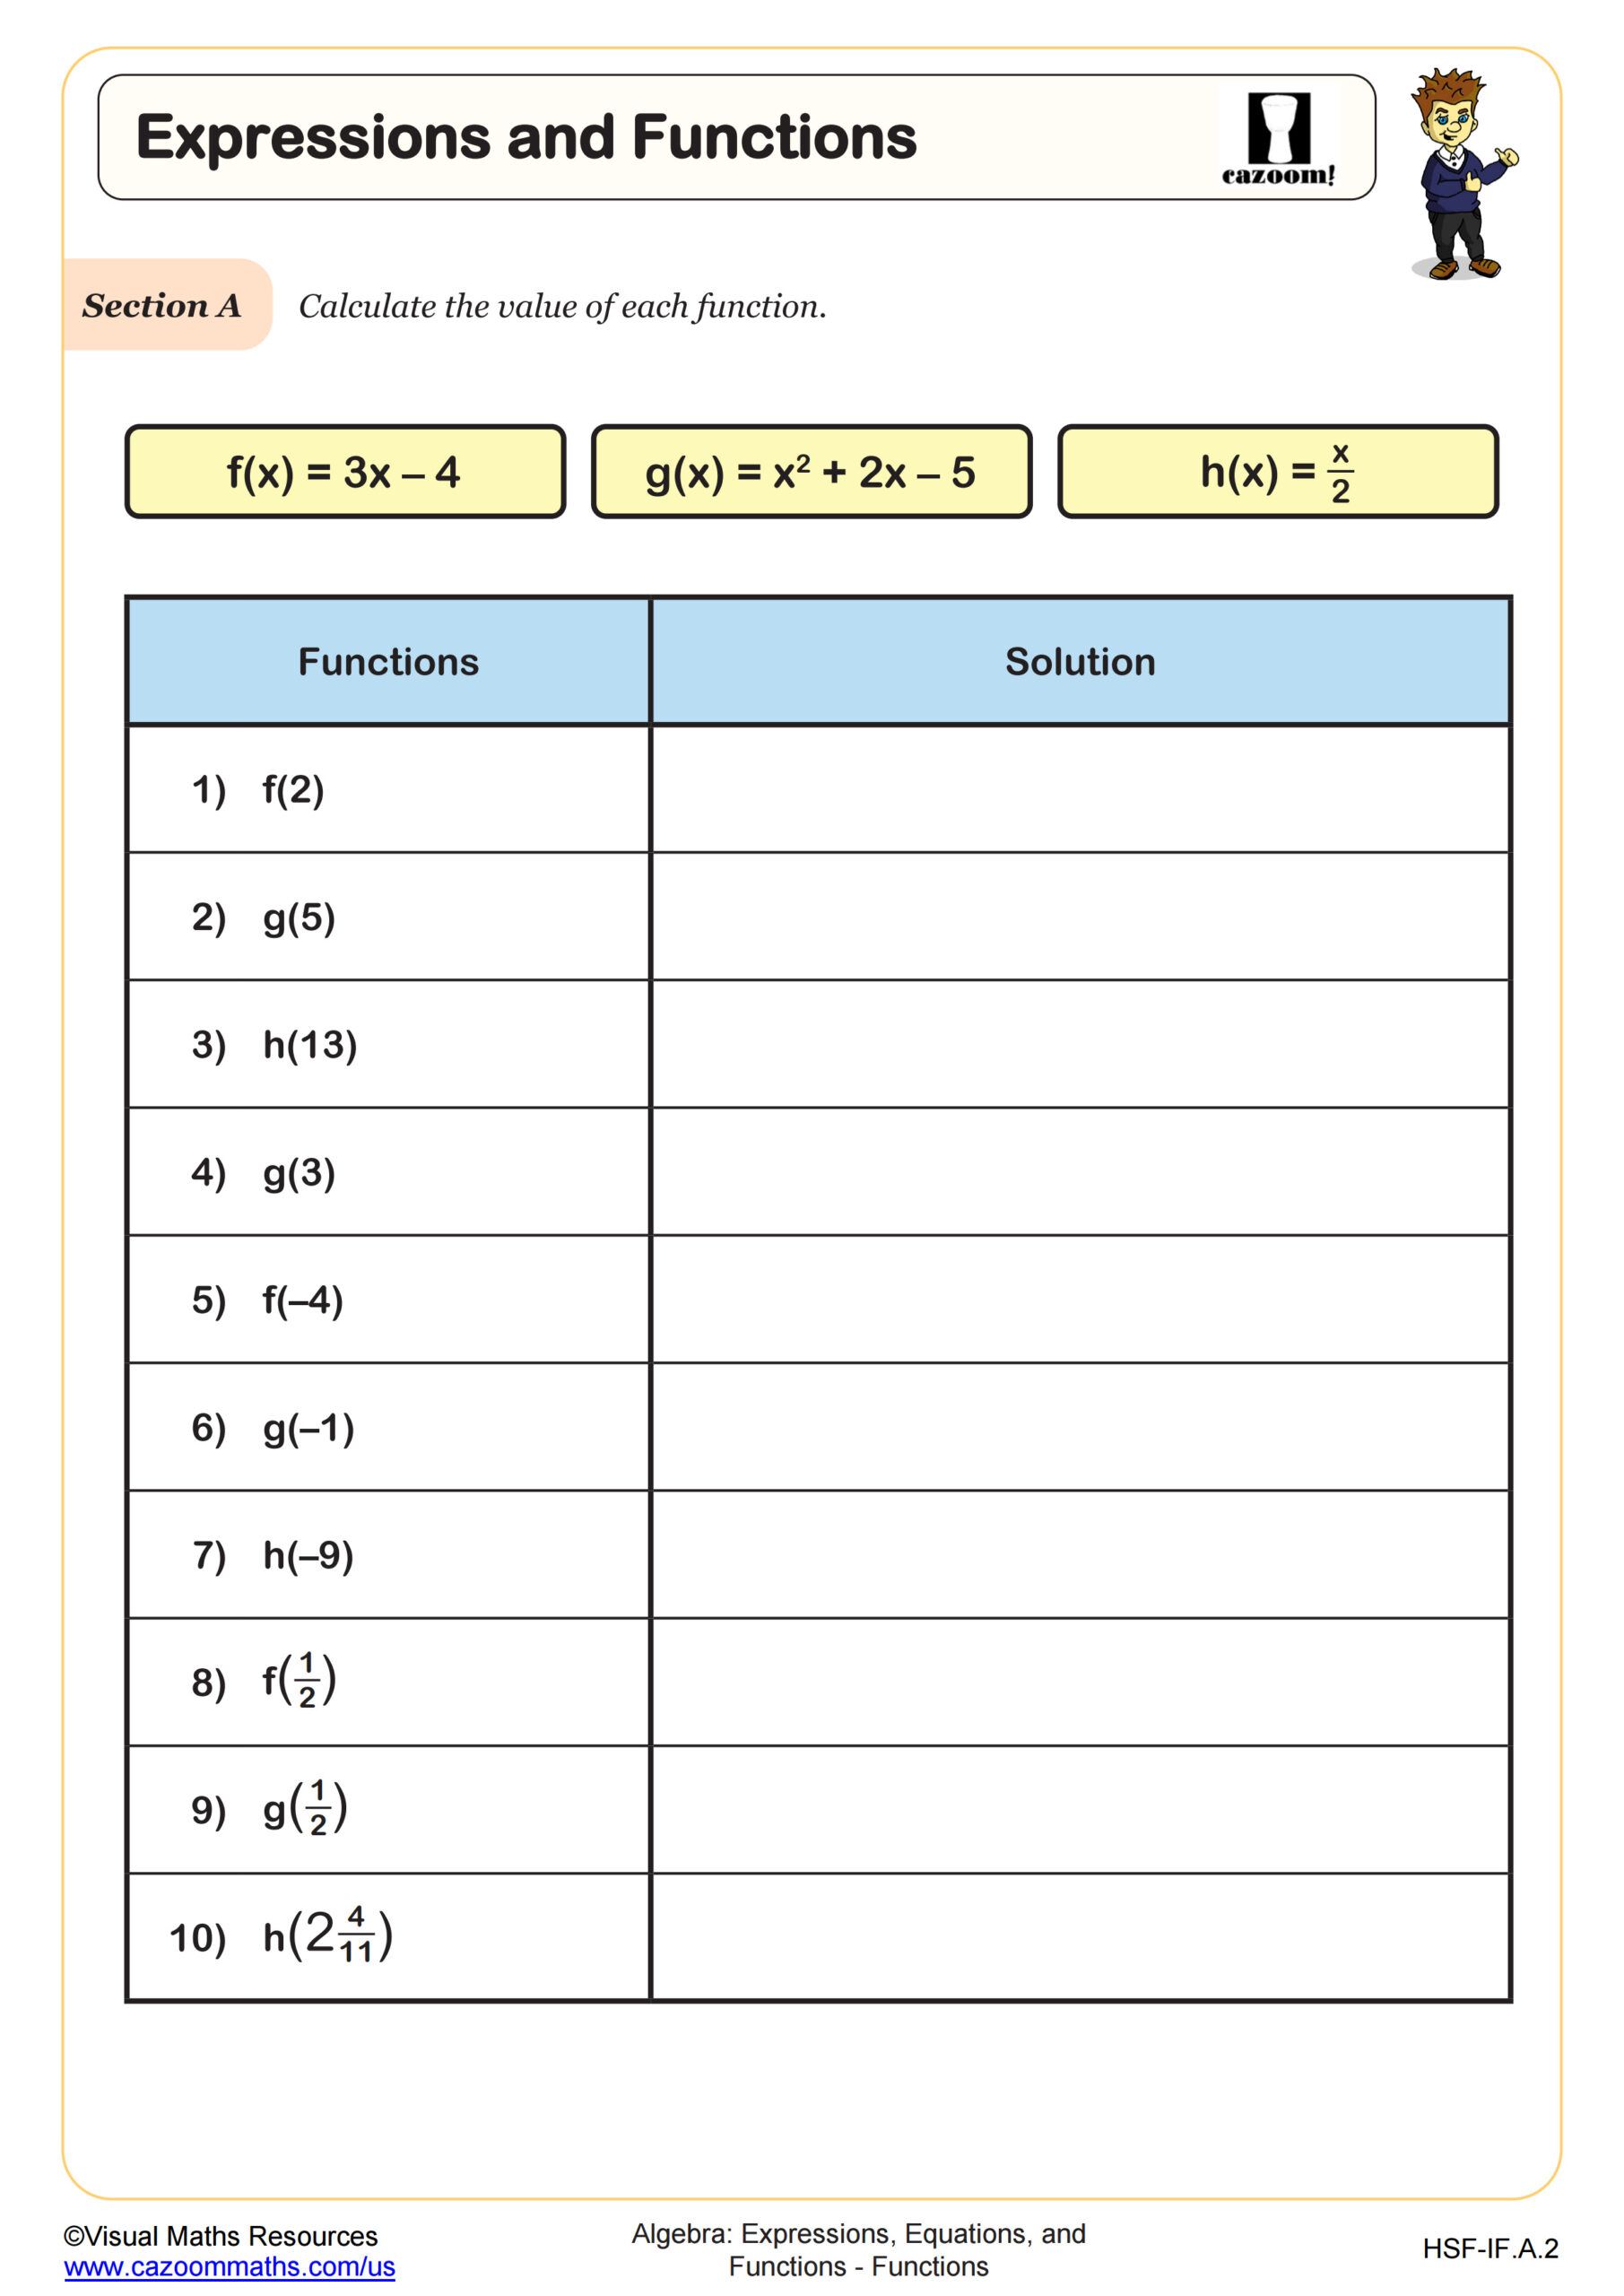
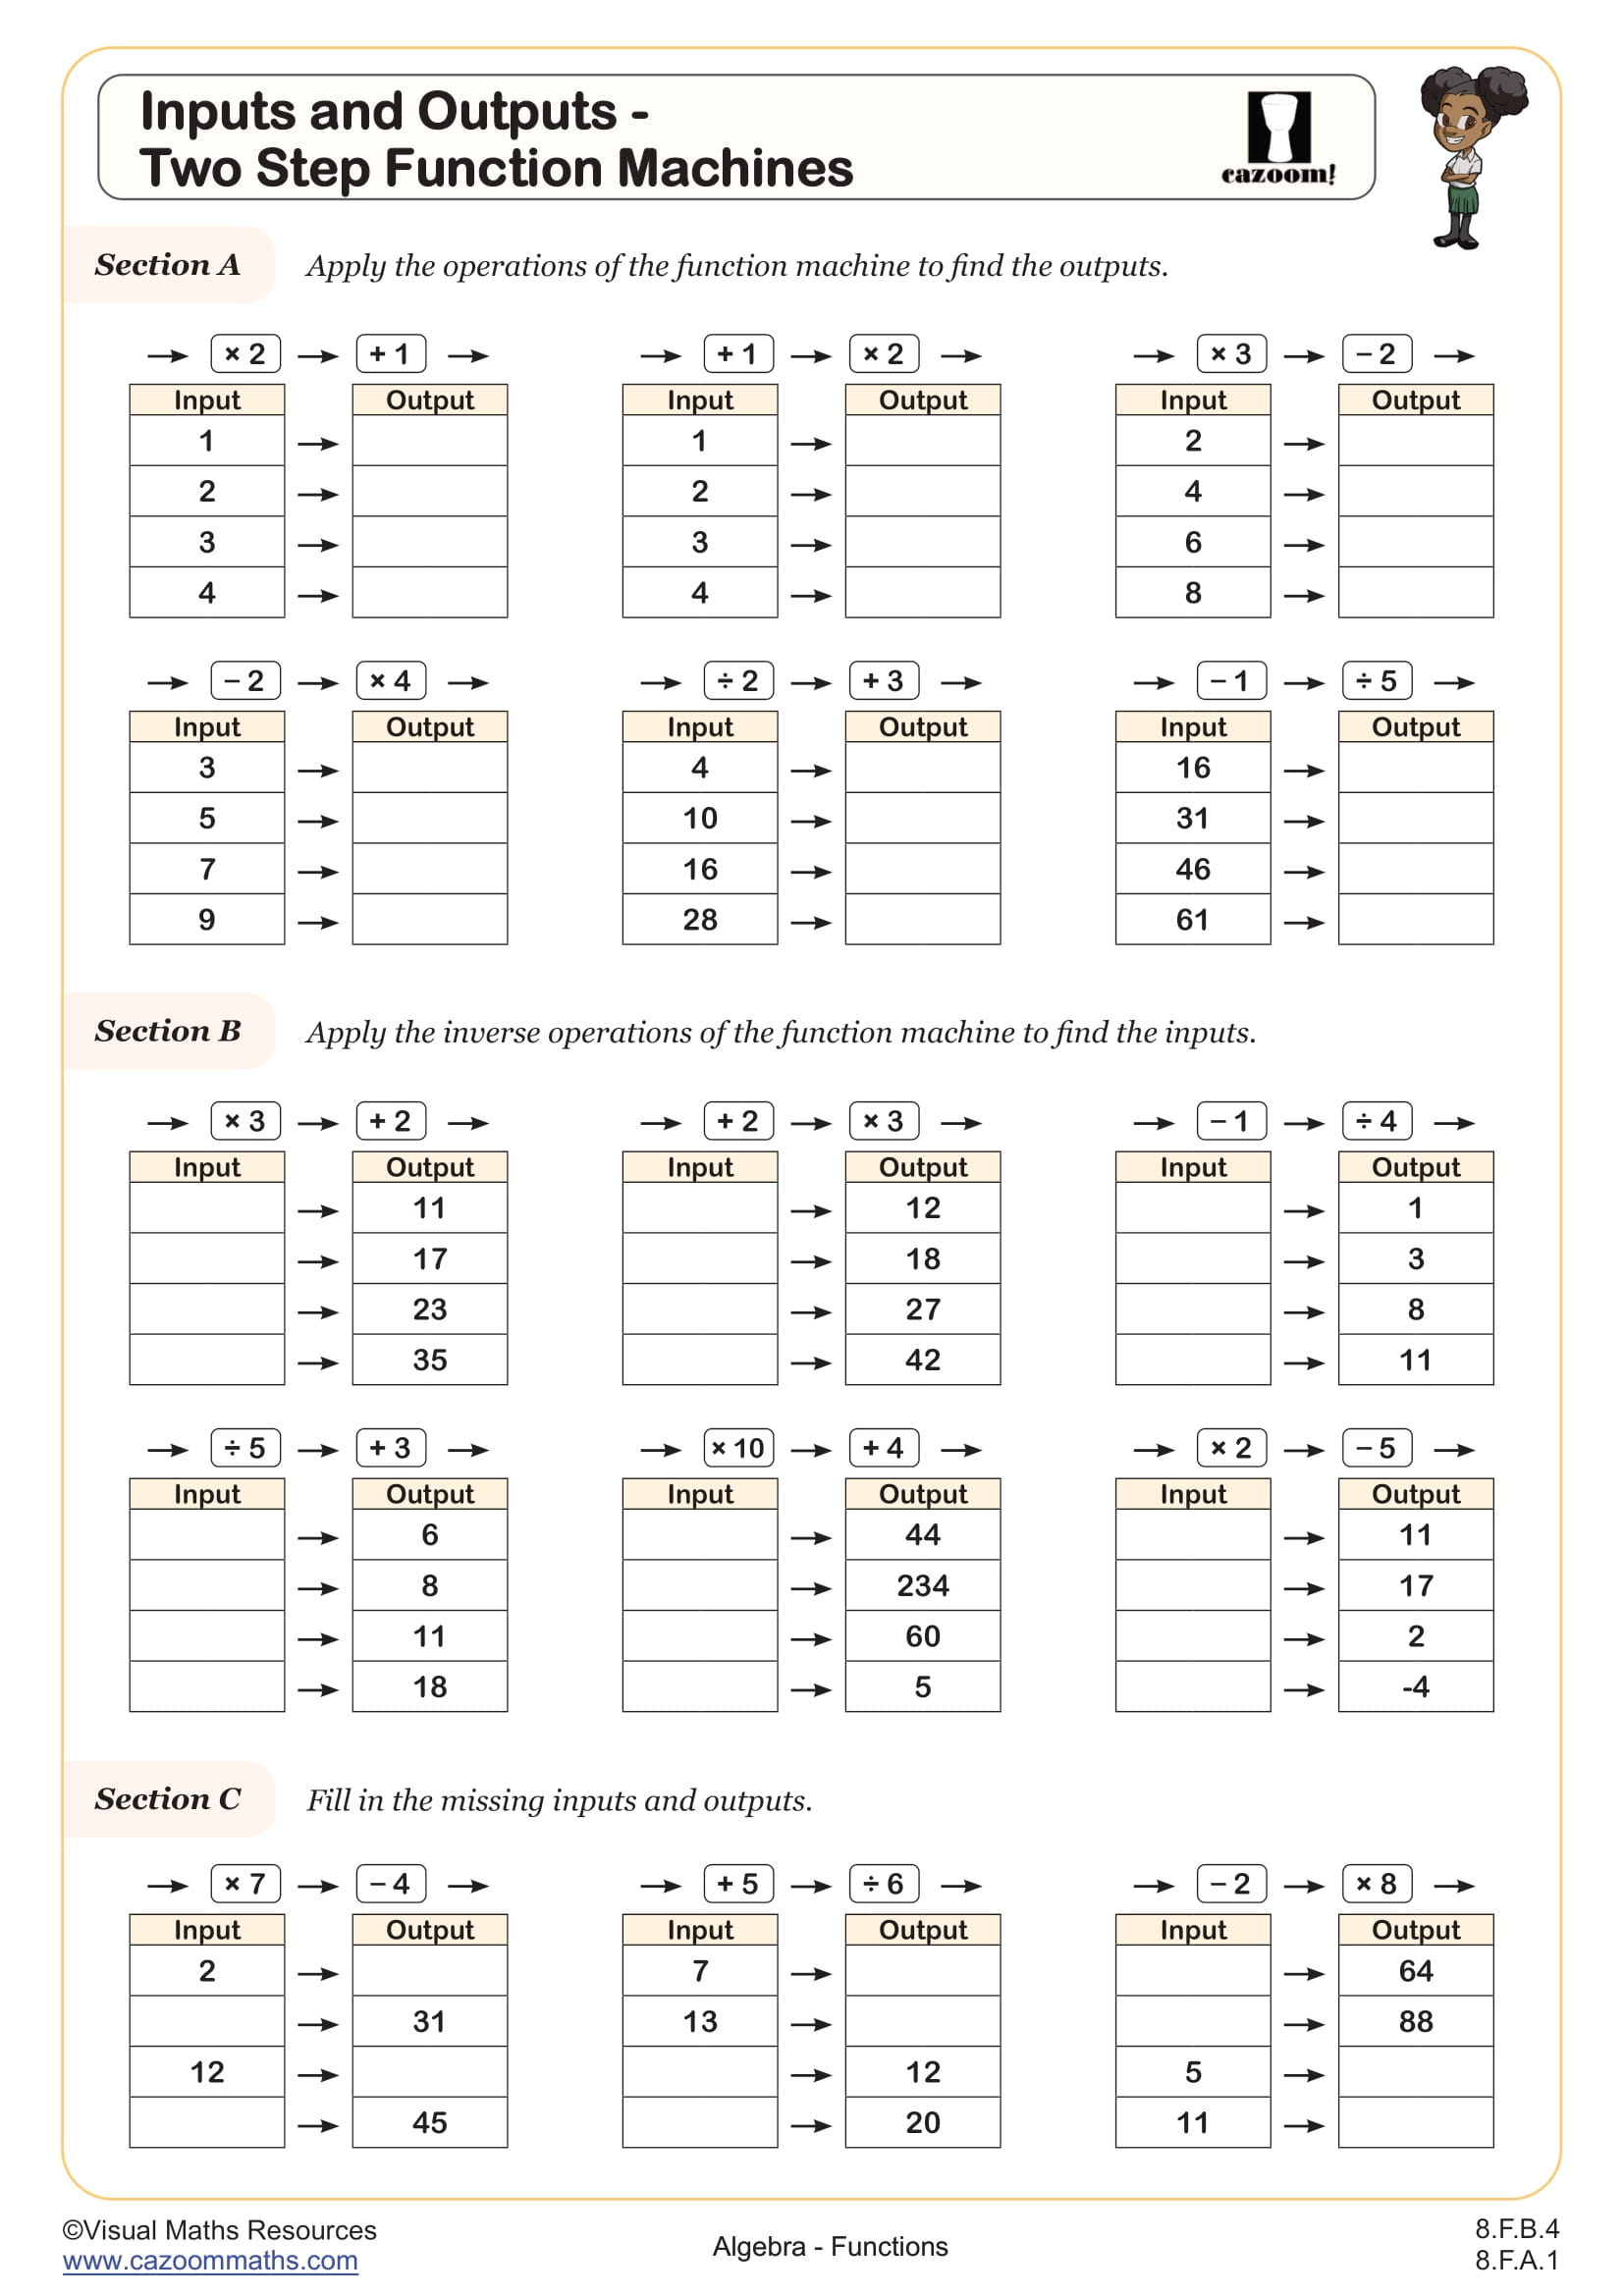
Algebra I introduces functions as relationships where each input corresponds to exactly one output, establishing notation like f(x), identifying domain and range, evaluating functions algebraically and graphically, and graphing linear functions. Students work with function machines that apply operations to inputs, interpret graphs to find function values, and transition from coordinate pairs to function notation. The Common Core State Standards emphasize functions as a unifying theme connecting algebra to geometry and statistics.
A common stumbling block occurs when students evaluate functions at specific values. Many students write f(2) = x + 5 instead of f(2) = 2 + 5 = 7, forgetting to substitute the input value throughout the expression. Teachers find that function machine worksheets with clear input-output tables help students visualize this substitution process before moving to abstract notation.
How Are Functions Tested on the SAT and State Assessments?
Standardized tests assess functions through multiple formats: evaluating f(a) for given values, finding inputs that produce specific outputs, interpreting function graphs to determine values or characteristics, and identifying whether relationships represent functions. The SAT includes function questions in both calculator and non-calculator sections, often embedding them within word problems or asking students to analyze graphs. State assessments typically require students to demonstrate understanding of domain and range, vertical line test applications, and function transformations.
Students lose points when they confuse independent and dependent variables on graphs or fail to recognize that a function graph passes the vertical line test. Another frequent error appears when tests ask for the value of x when f(x) = 4, and students incorrectly solve for f(4) instead. Practice reading function values from graphs builds the visual reasoning skills these assessments demand.
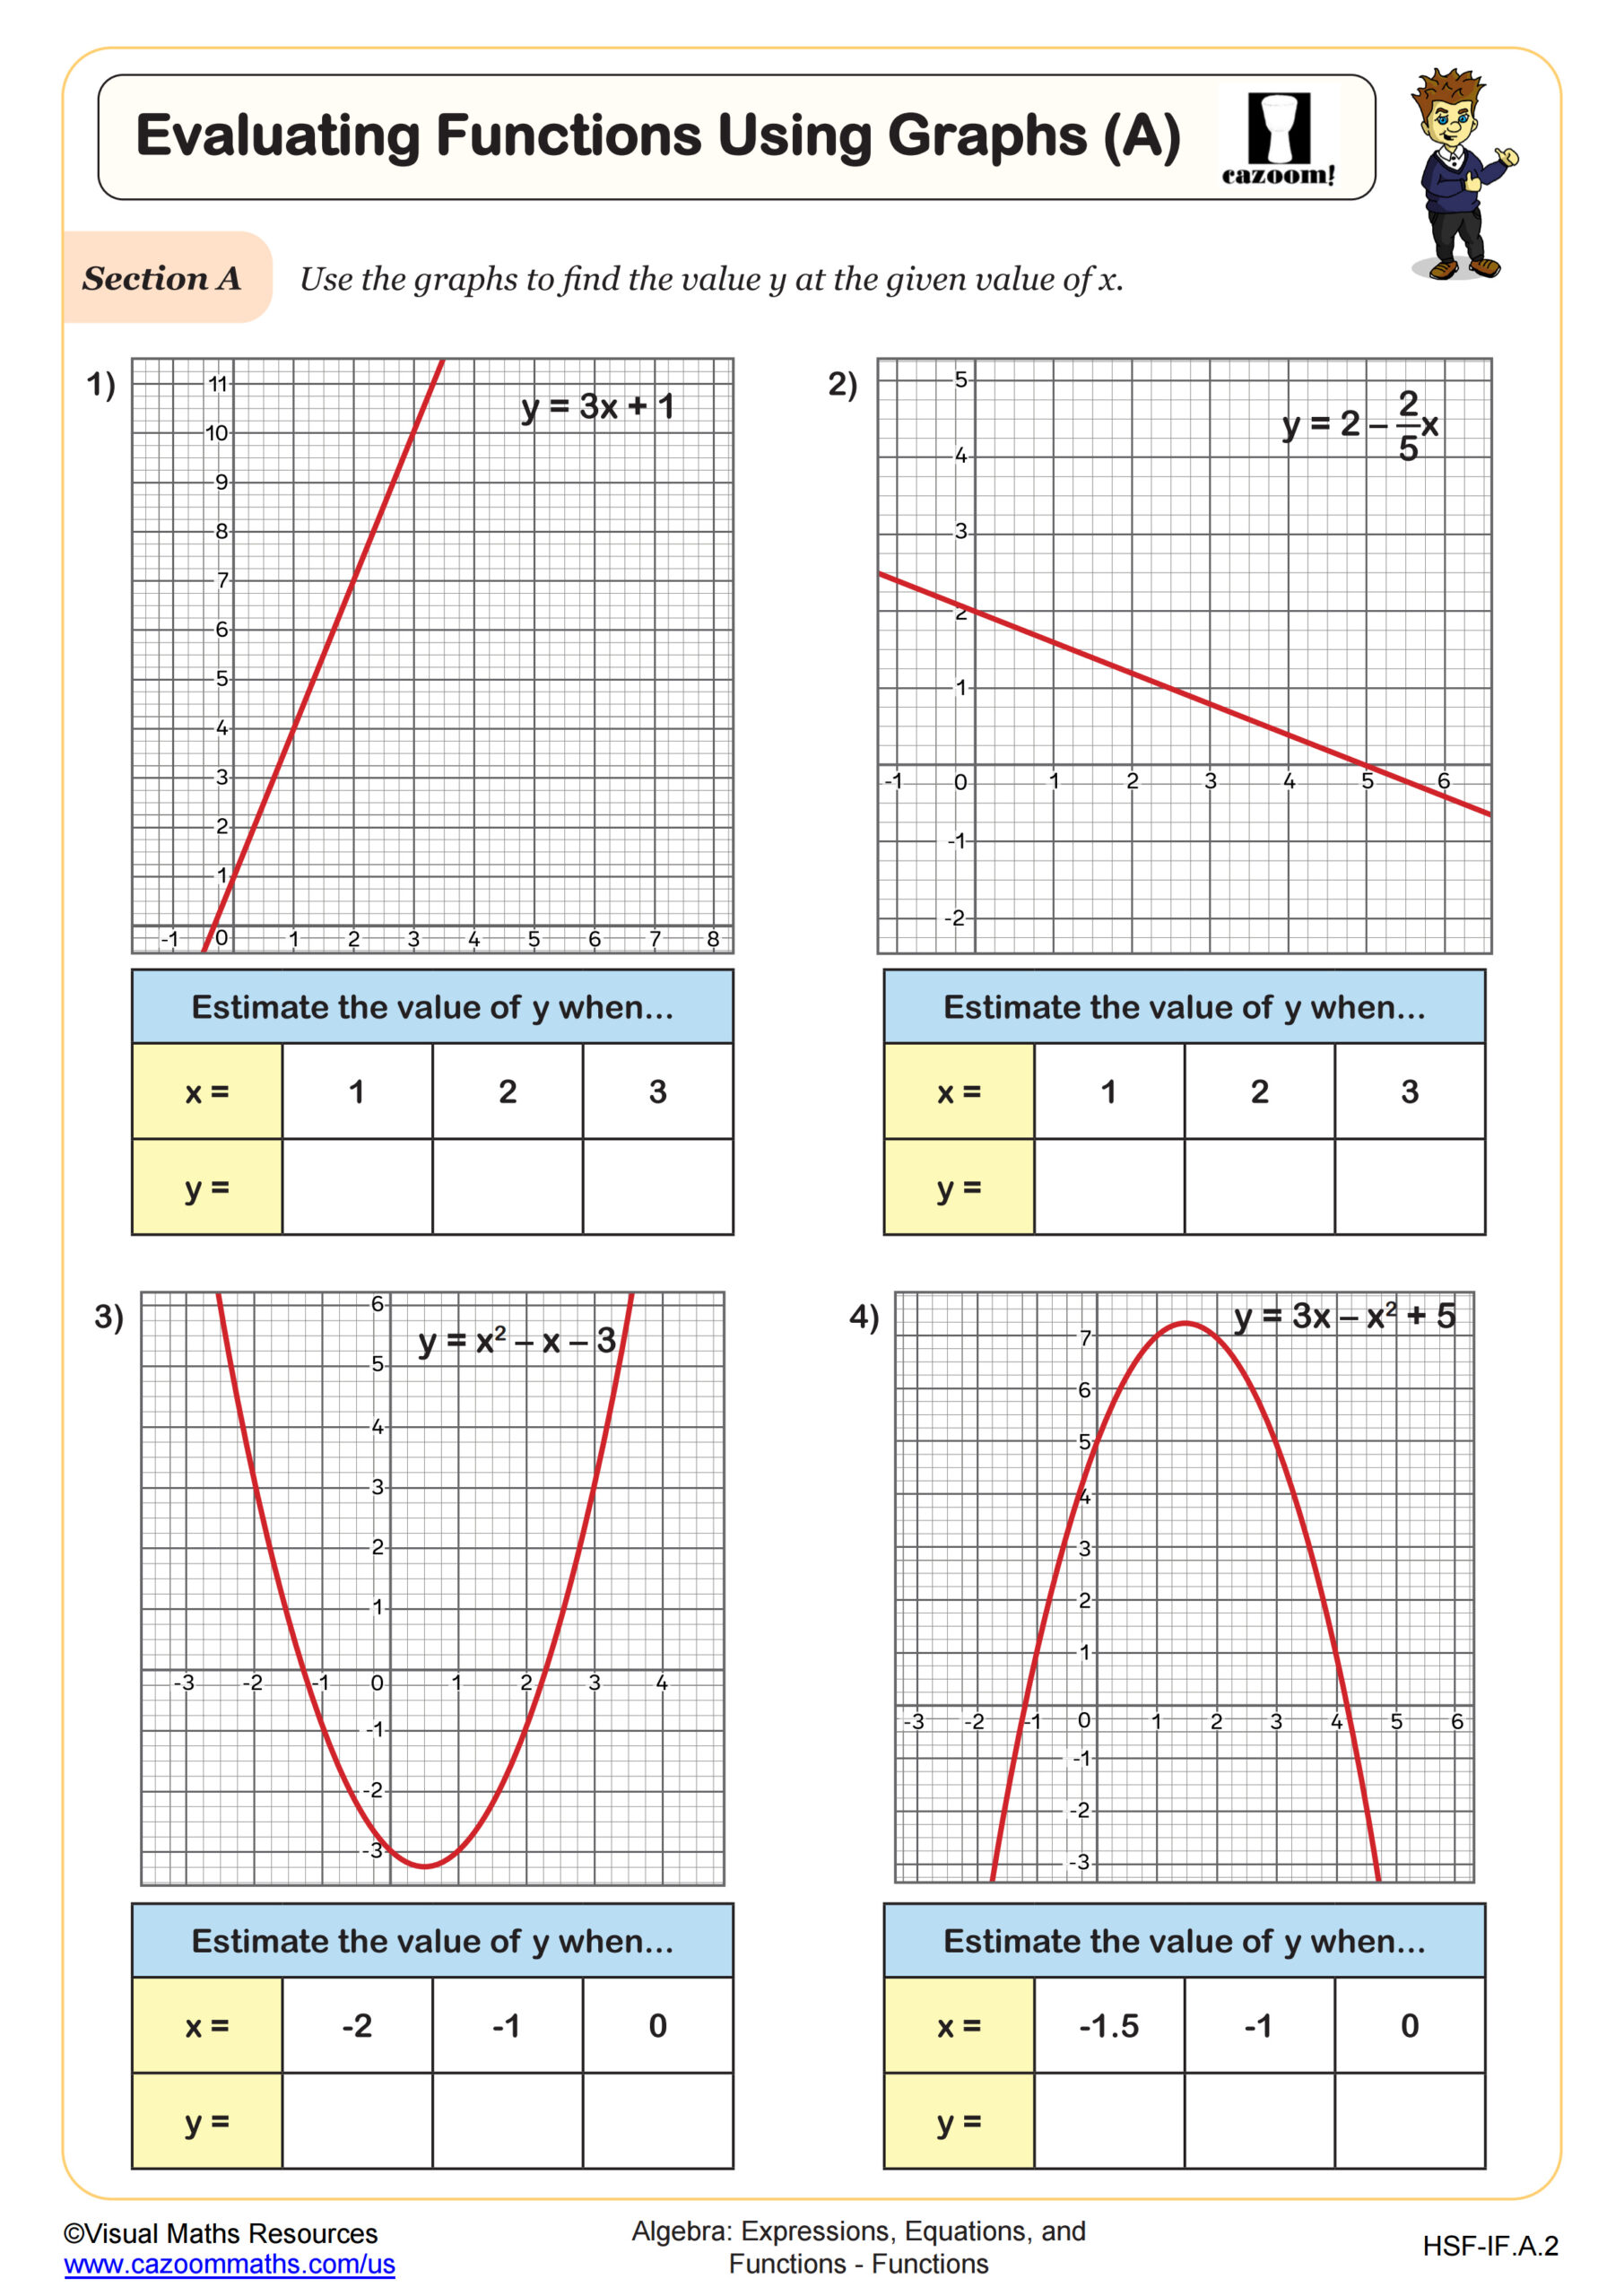
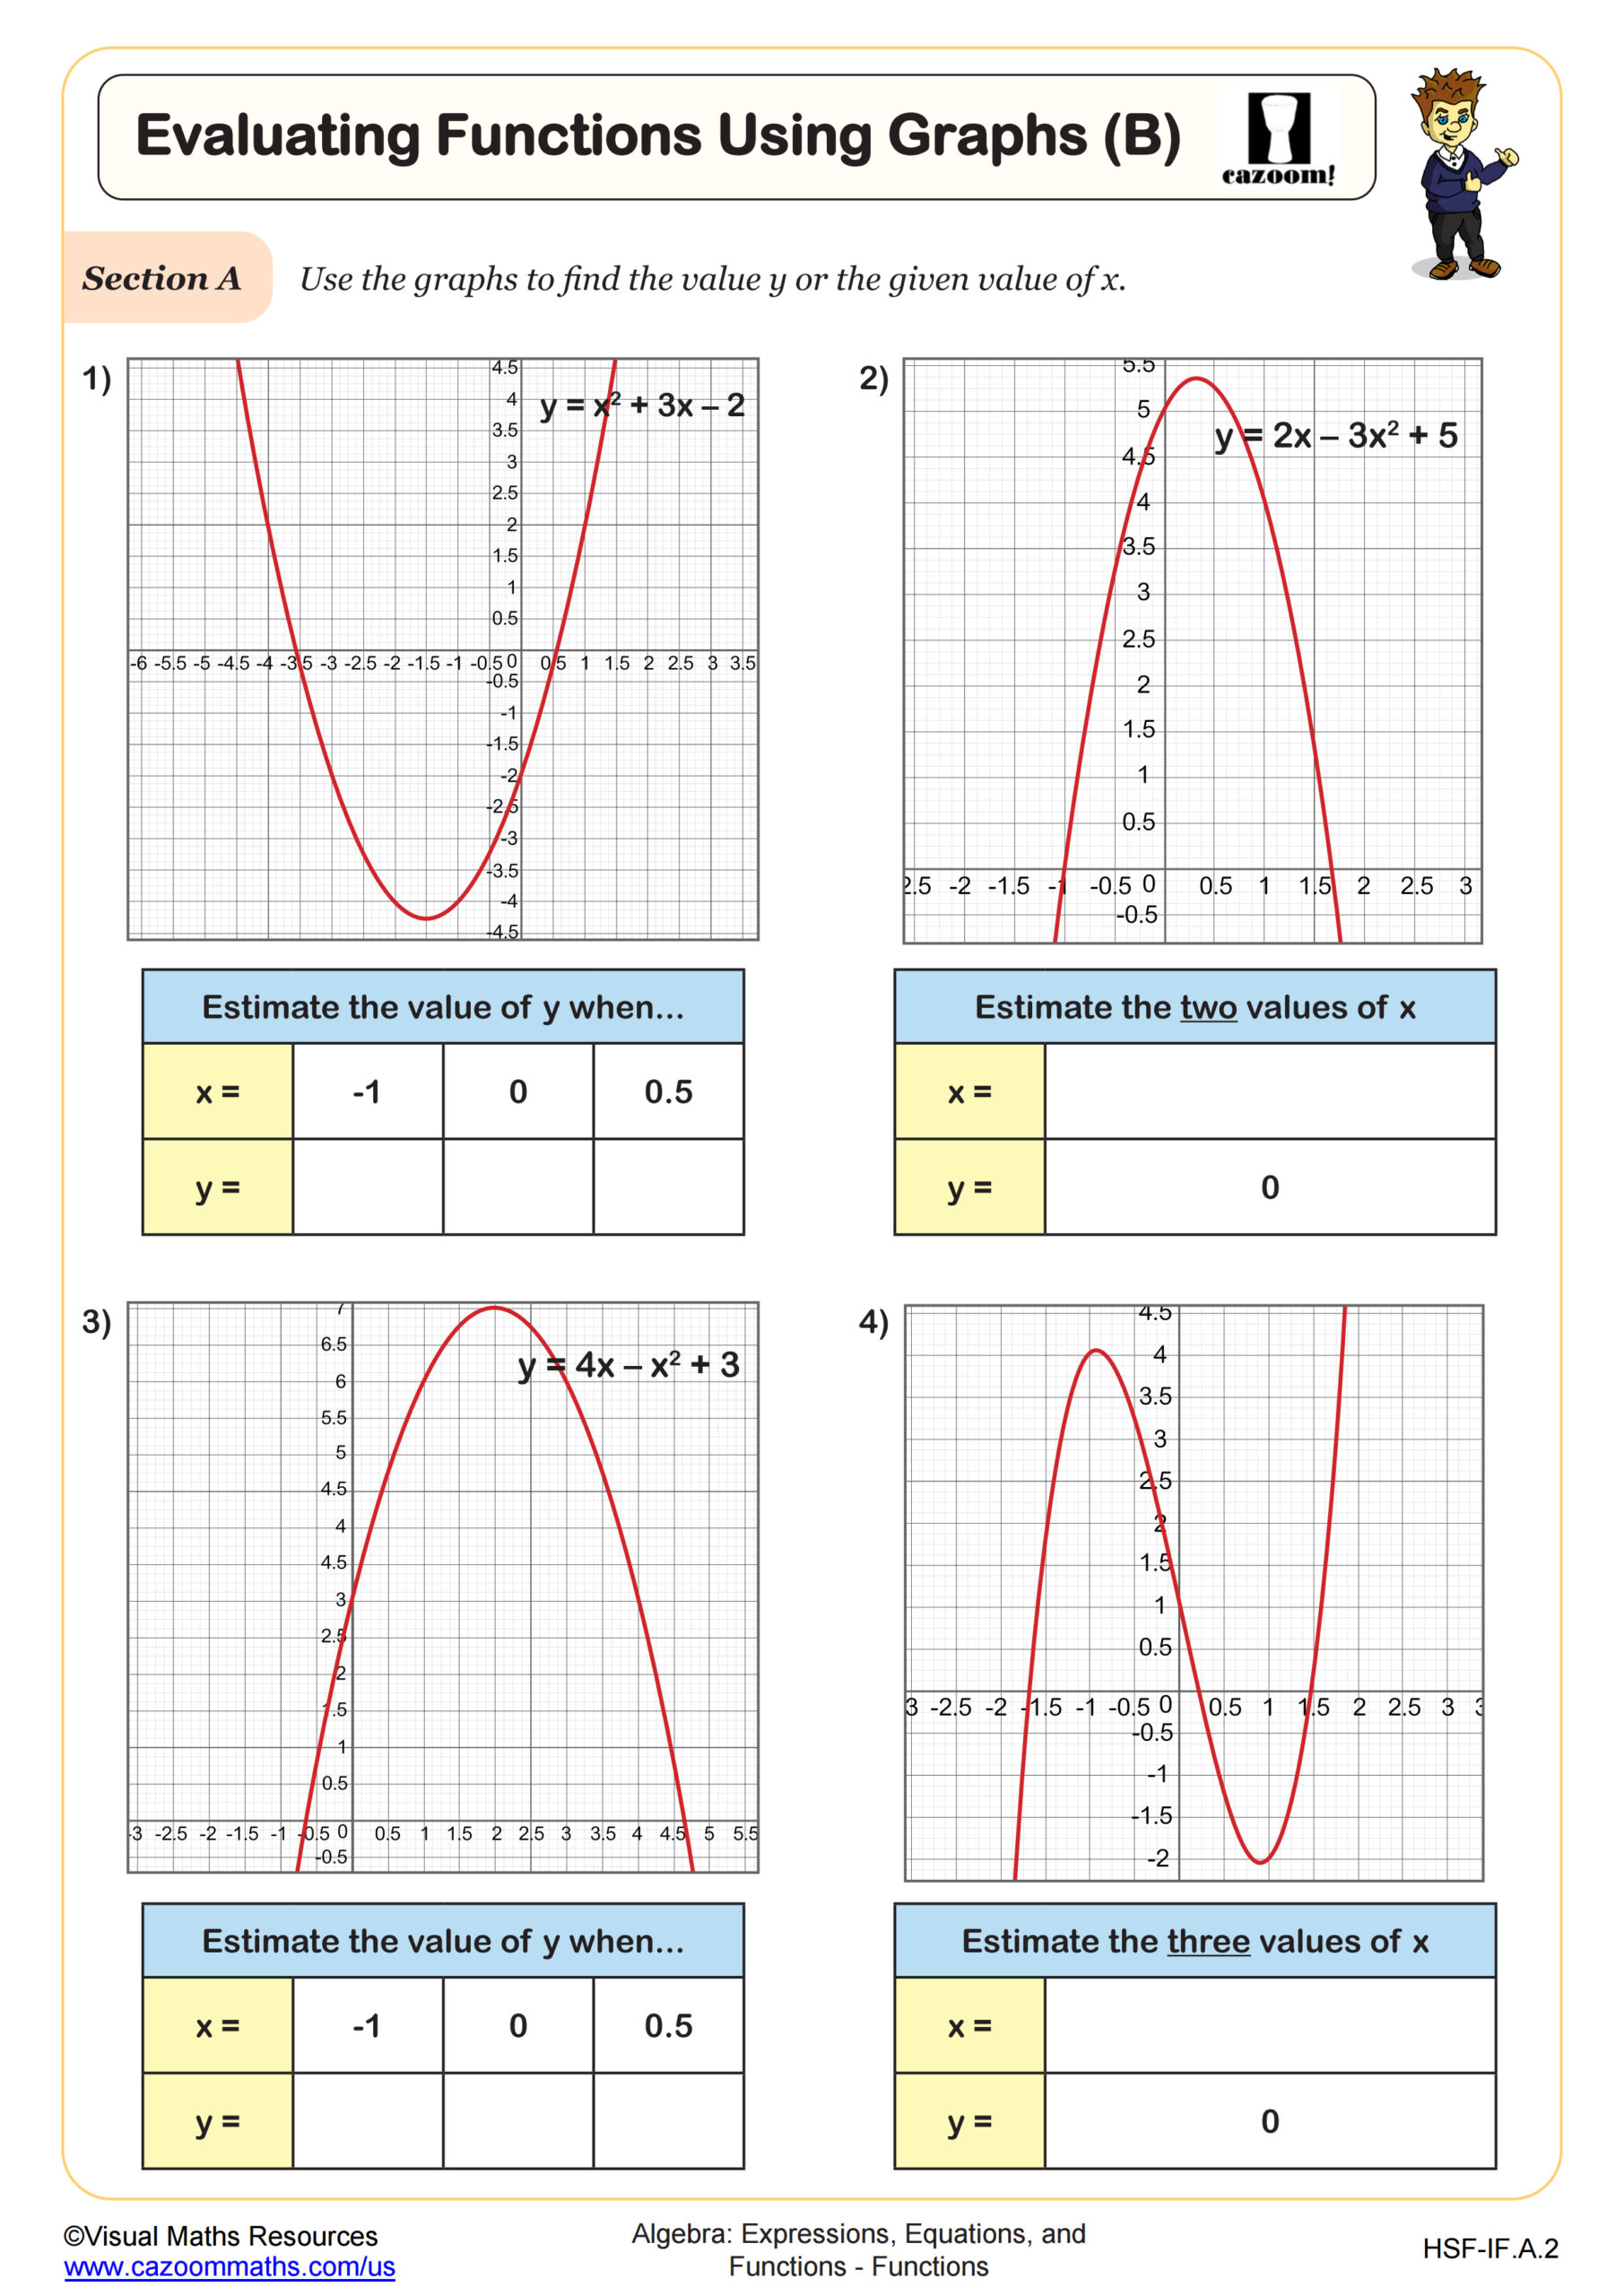
Why Is Evaluating Functions from Graphs Important?
Evaluating functions from graphs teaches students to extract numerical information from visual representations, a skill that connects algebraic thinking with graphical analysis. Students locate an input value on the x-axis, trace vertically to the function curve, then read horizontally to find the corresponding output on the y-axis. This process reinforces that functions map inputs to outputs and prepares students for analyzing more complex graphs in Algebra II and Pre-Calculus. Teachers notice that students who master graphical evaluation develop stronger intuition about function behavior and discontinuities.
This skill appears throughout STEM fields where professionals interpret data visualizations, engineering specifications, and experimental results. Scientists evaluate temperature functions from climate graphs, engineers read stress-strain curves to determine material properties, and economists analyze supply-demand functions from market data. Building comfort with graphical interpretation in Algebra I establishes foundation skills for college STEM coursework and technical careers.
How Should Teachers Use These Function Worksheets?
These worksheets scaffold function concepts from concrete function machines through abstract notation and graphing applications. The progression moves from two-step function machines with clear input-output patterns to evaluating functions from graphs at varying difficulty levels, then advances to graphing linear functions and working with expressions. Teachers report that starting with function machines helps students who struggle with abstract f(x) notation by providing a mechanical model of the input-output process before introducing formal symbols.
The worksheets work well as differentiated practice during units on functions, with easier versions supporting students who need additional foundation work while challenging versions extend learning for advanced students. Many teachers use the graphing worksheets for paired activities where one student creates a function table and the other graphs it, then they verify answers together. The complete answer keys allow for self-checking during independent practice or quick assessment scoring during test preparation reviews before unit exams or standardized tests.