Algebra I Mean Median Mode Worksheets
All worksheets are created by the team of experienced teachers at Cazoom Math.
What Do Algebra I Students Learn About Mean, Median, and Mode?
In Algebra I, students move beyond basic calculations to analyze which measure of central tendency best represents a data set. They calculate mean, median, mode, and range while learning to recognize how outliers affect each measure differently. The curriculum emphasizes comparing data sets using these statistics and understanding when each measure provides the most meaningful summary.
Teachers frequently observe that students initially believe mean is always the "correct" answer, particularly when analyzing income data or test scores. A breakthrough happens when students realize that median better represents housing prices in neighborhoods with a few mansions, or that mode matters most when identifying the most common shoe size to stock. This conceptual understanding separates procedural calculation from statistical thinking.
How Do Standardized Tests Assess Mean, Median, and Mode?
The SAT and ACT regularly include questions requiring students to calculate measures of central tendency from data sets, frequency tables, or dot plots. State assessments often present real-world scenarios where students must determine which measure best describes the data and explain their reasoning. Tests expect students to understand how adding or removing data points affects each measure, particularly when outliers are involved.
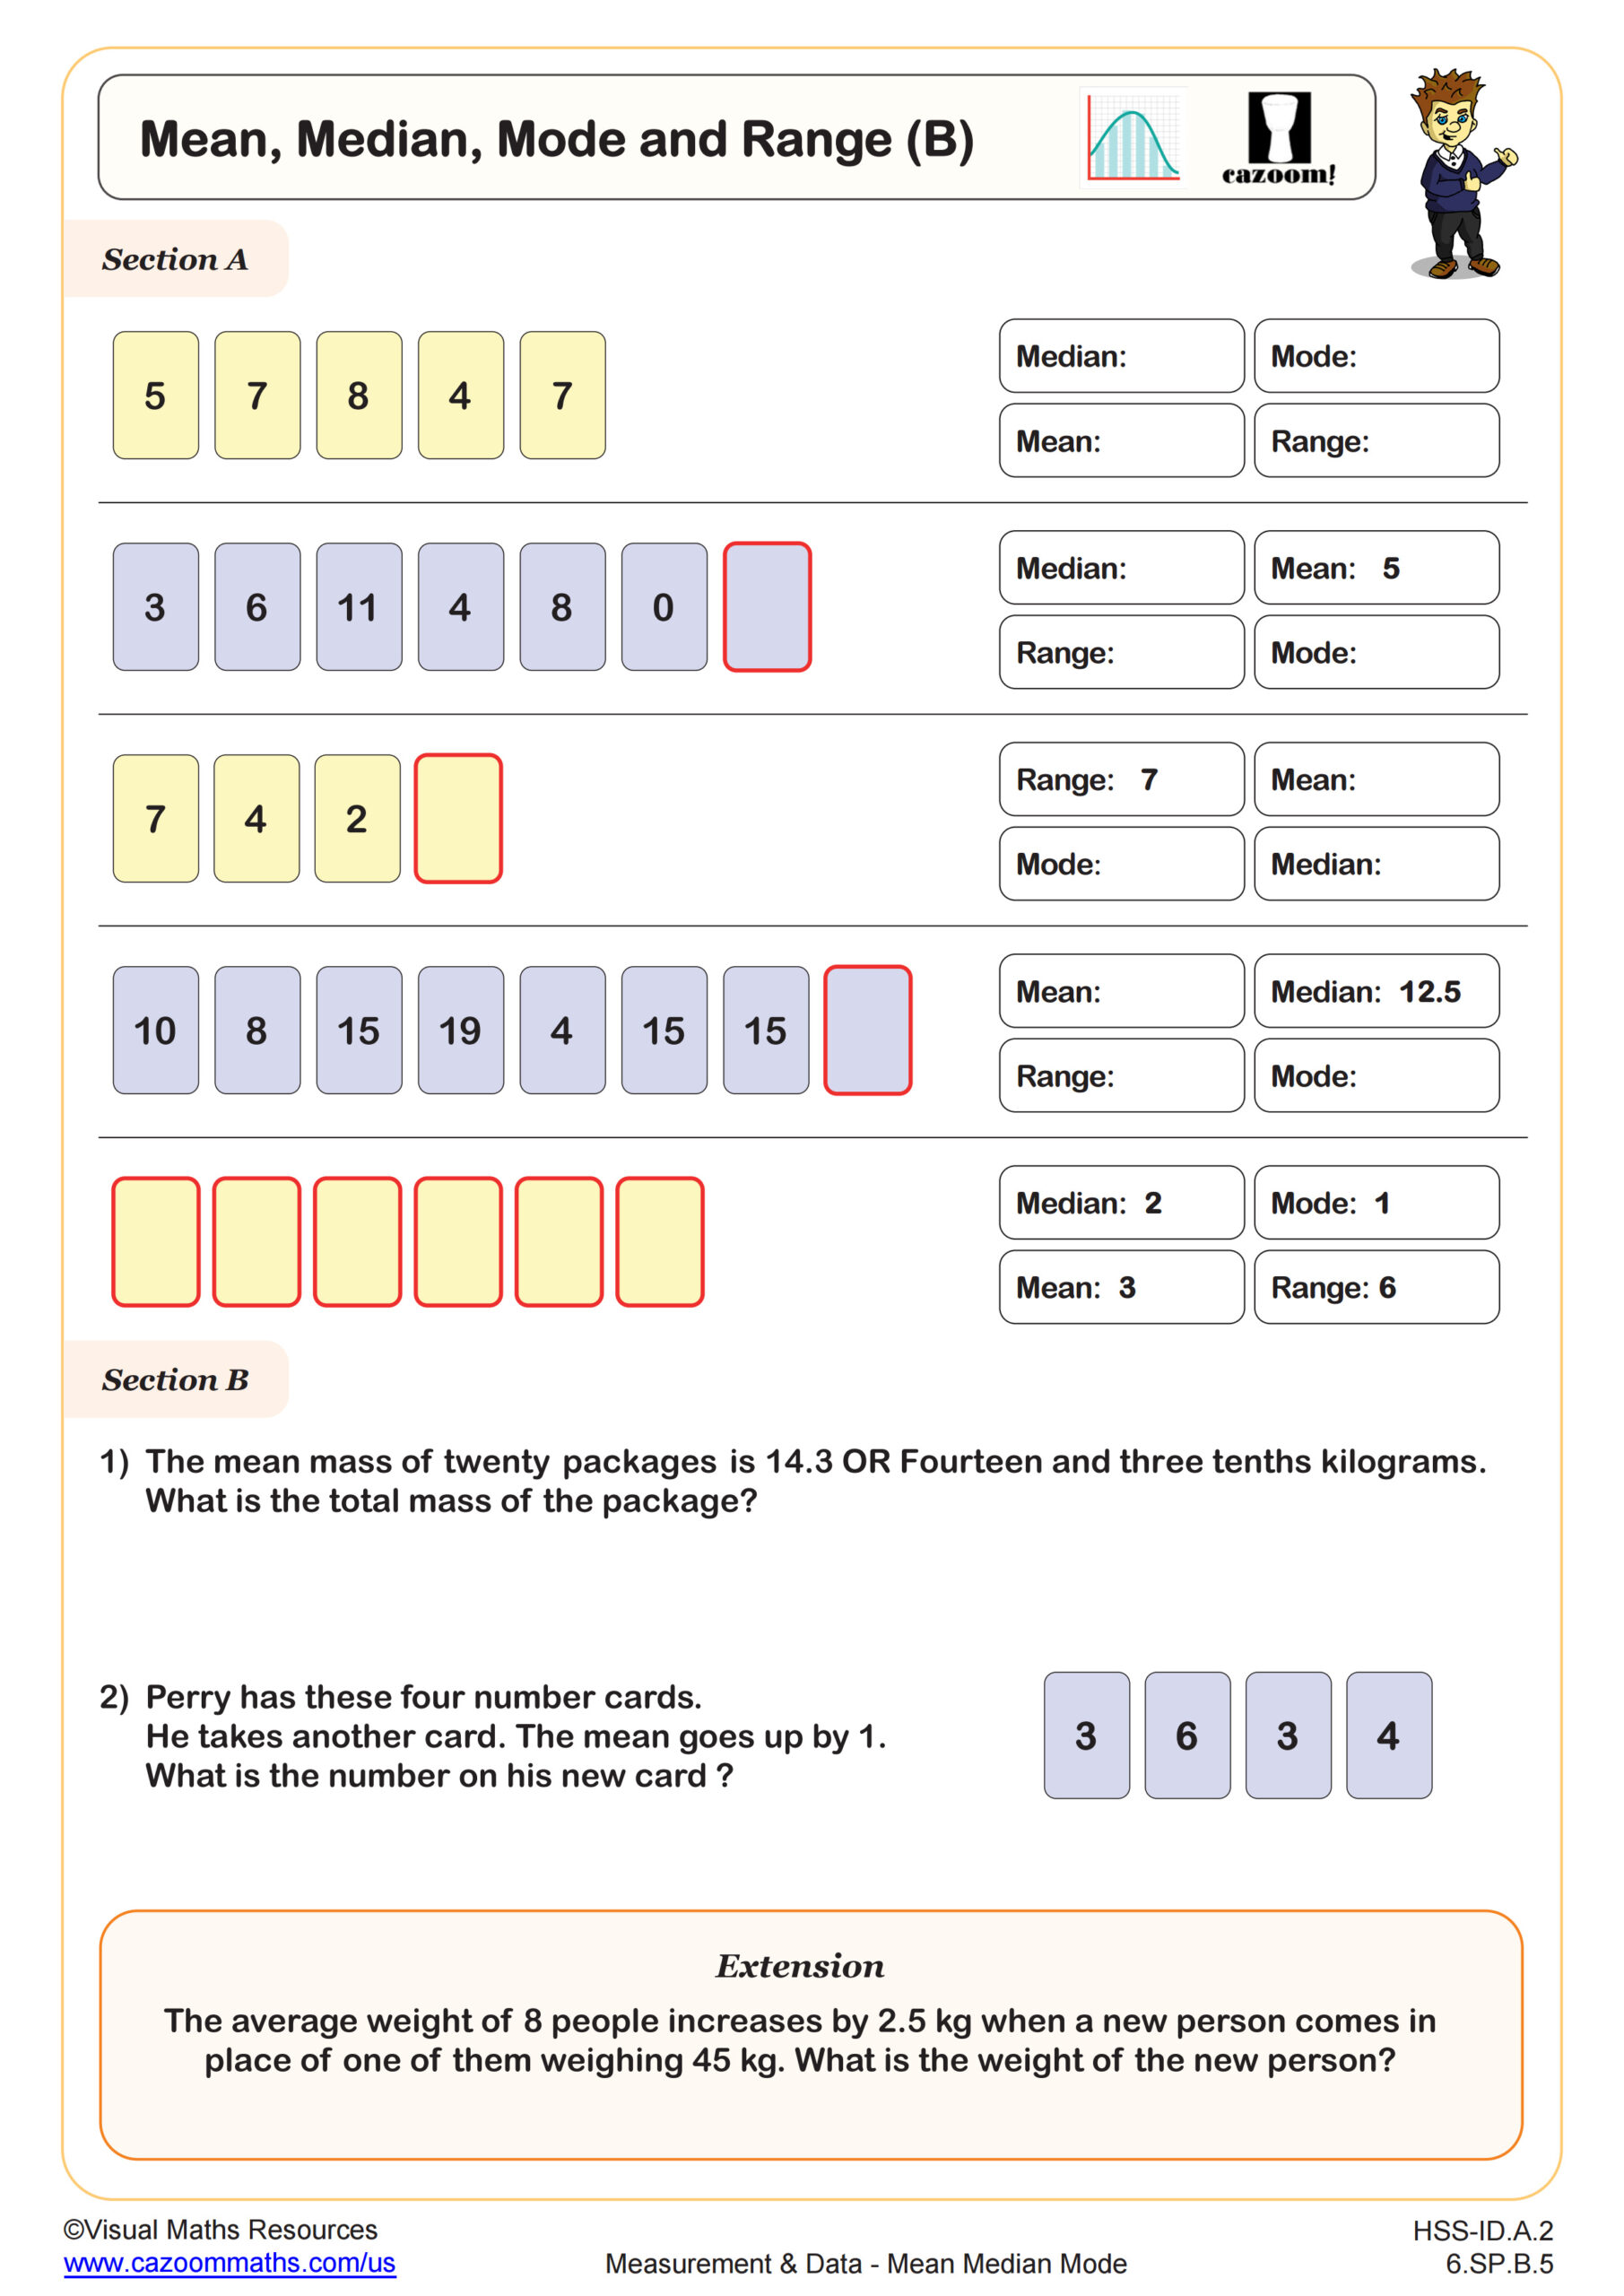
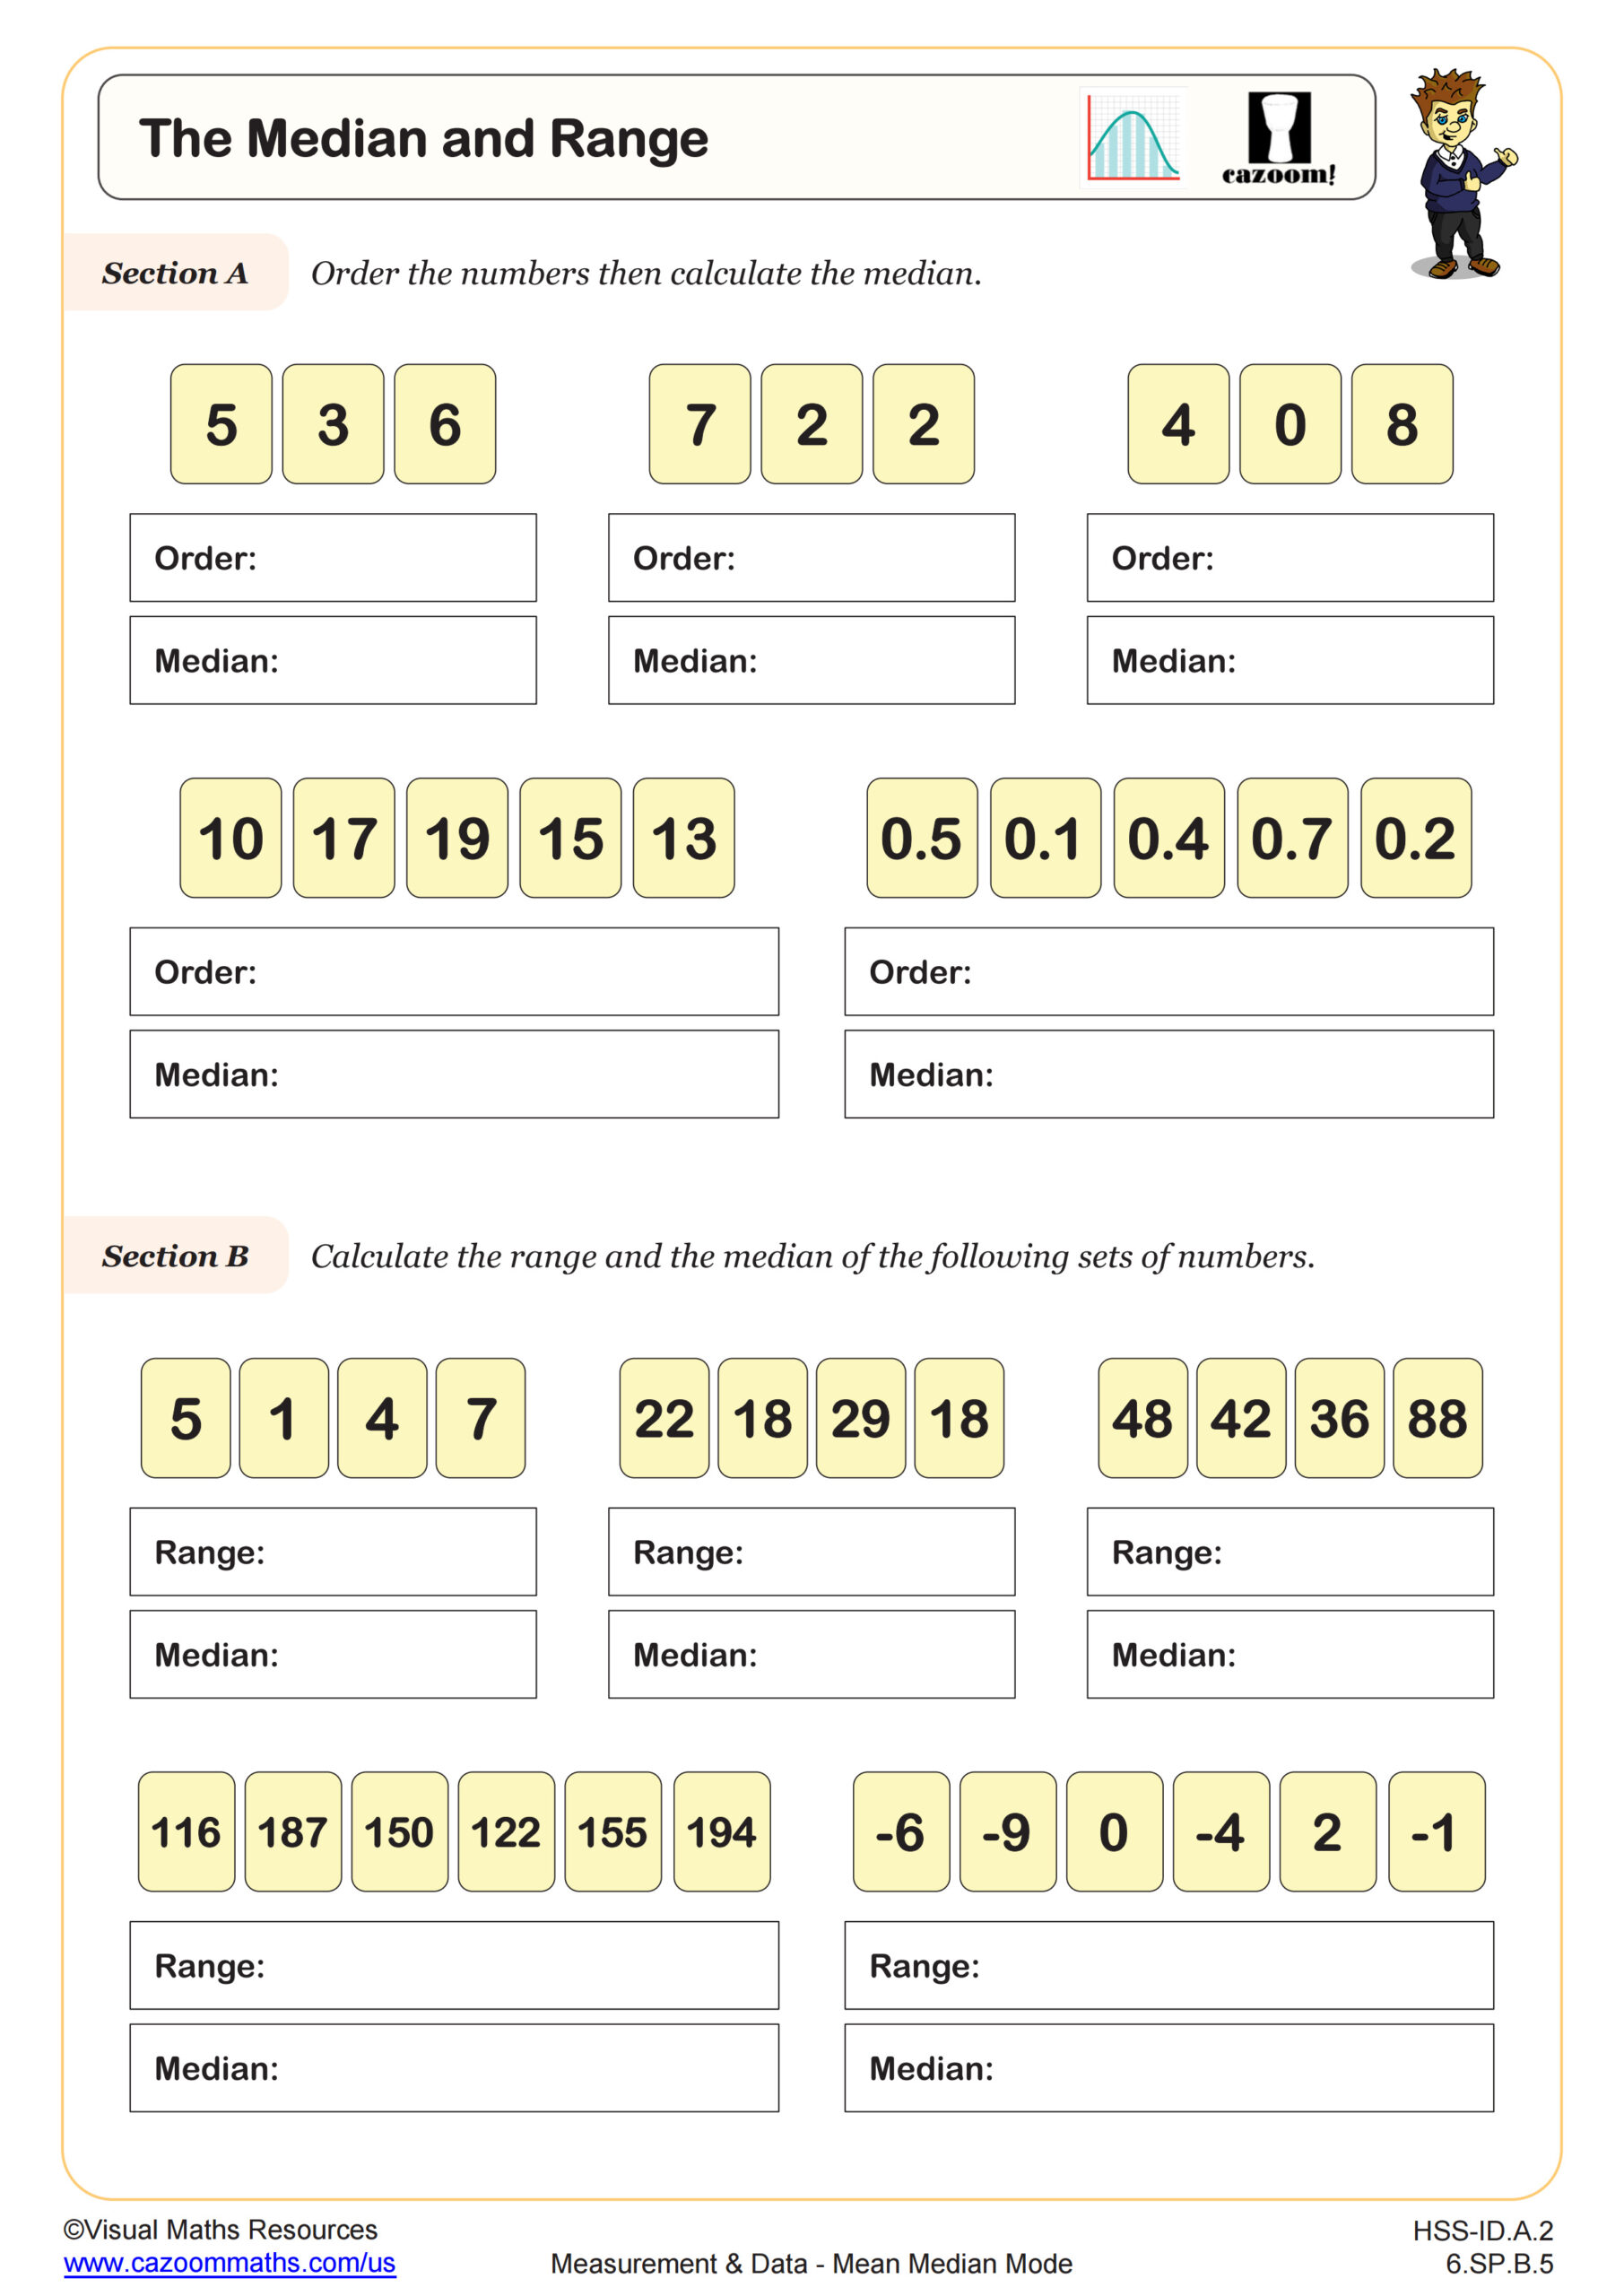
Students lose points when they confuse median with mean or fail to order data before finding the median. Another common error occurs when interpreting which measure changed when a data value is added. Many students also struggle with questions asking them to find a missing value when given the mean, requiring them to work backward using the sum of all values divided by the count.
Why Is Choosing the Best Measure Important for Data Analysis?
Understanding when to use mean versus median versus mode represents genuine statistical literacy. The mean works well for symmetrical distributions without outliers, median resists the influence of extreme values, and mode identifies the most frequent occurrence. Students develop critical thinking skills by evaluating data characteristics before selecting an appropriate measure. This decision-making process appears throughout upper-level math courses and science classes where data interpretation matters.
This skill connects directly to STEM careers and informed citizenship. Data scientists choose median household income over mean because billionaires skew the average. Epidemiologists track the mode of symptom onset to identify disease patterns. Quality control engineers monitor the mean and range of product measurements. College-bound students encounter these concepts in introductory statistics courses, making Algebra I the foundation for quantitative reasoning across disciplines.
How Can Teachers Use These Worksheets for Algebra I Instruction?
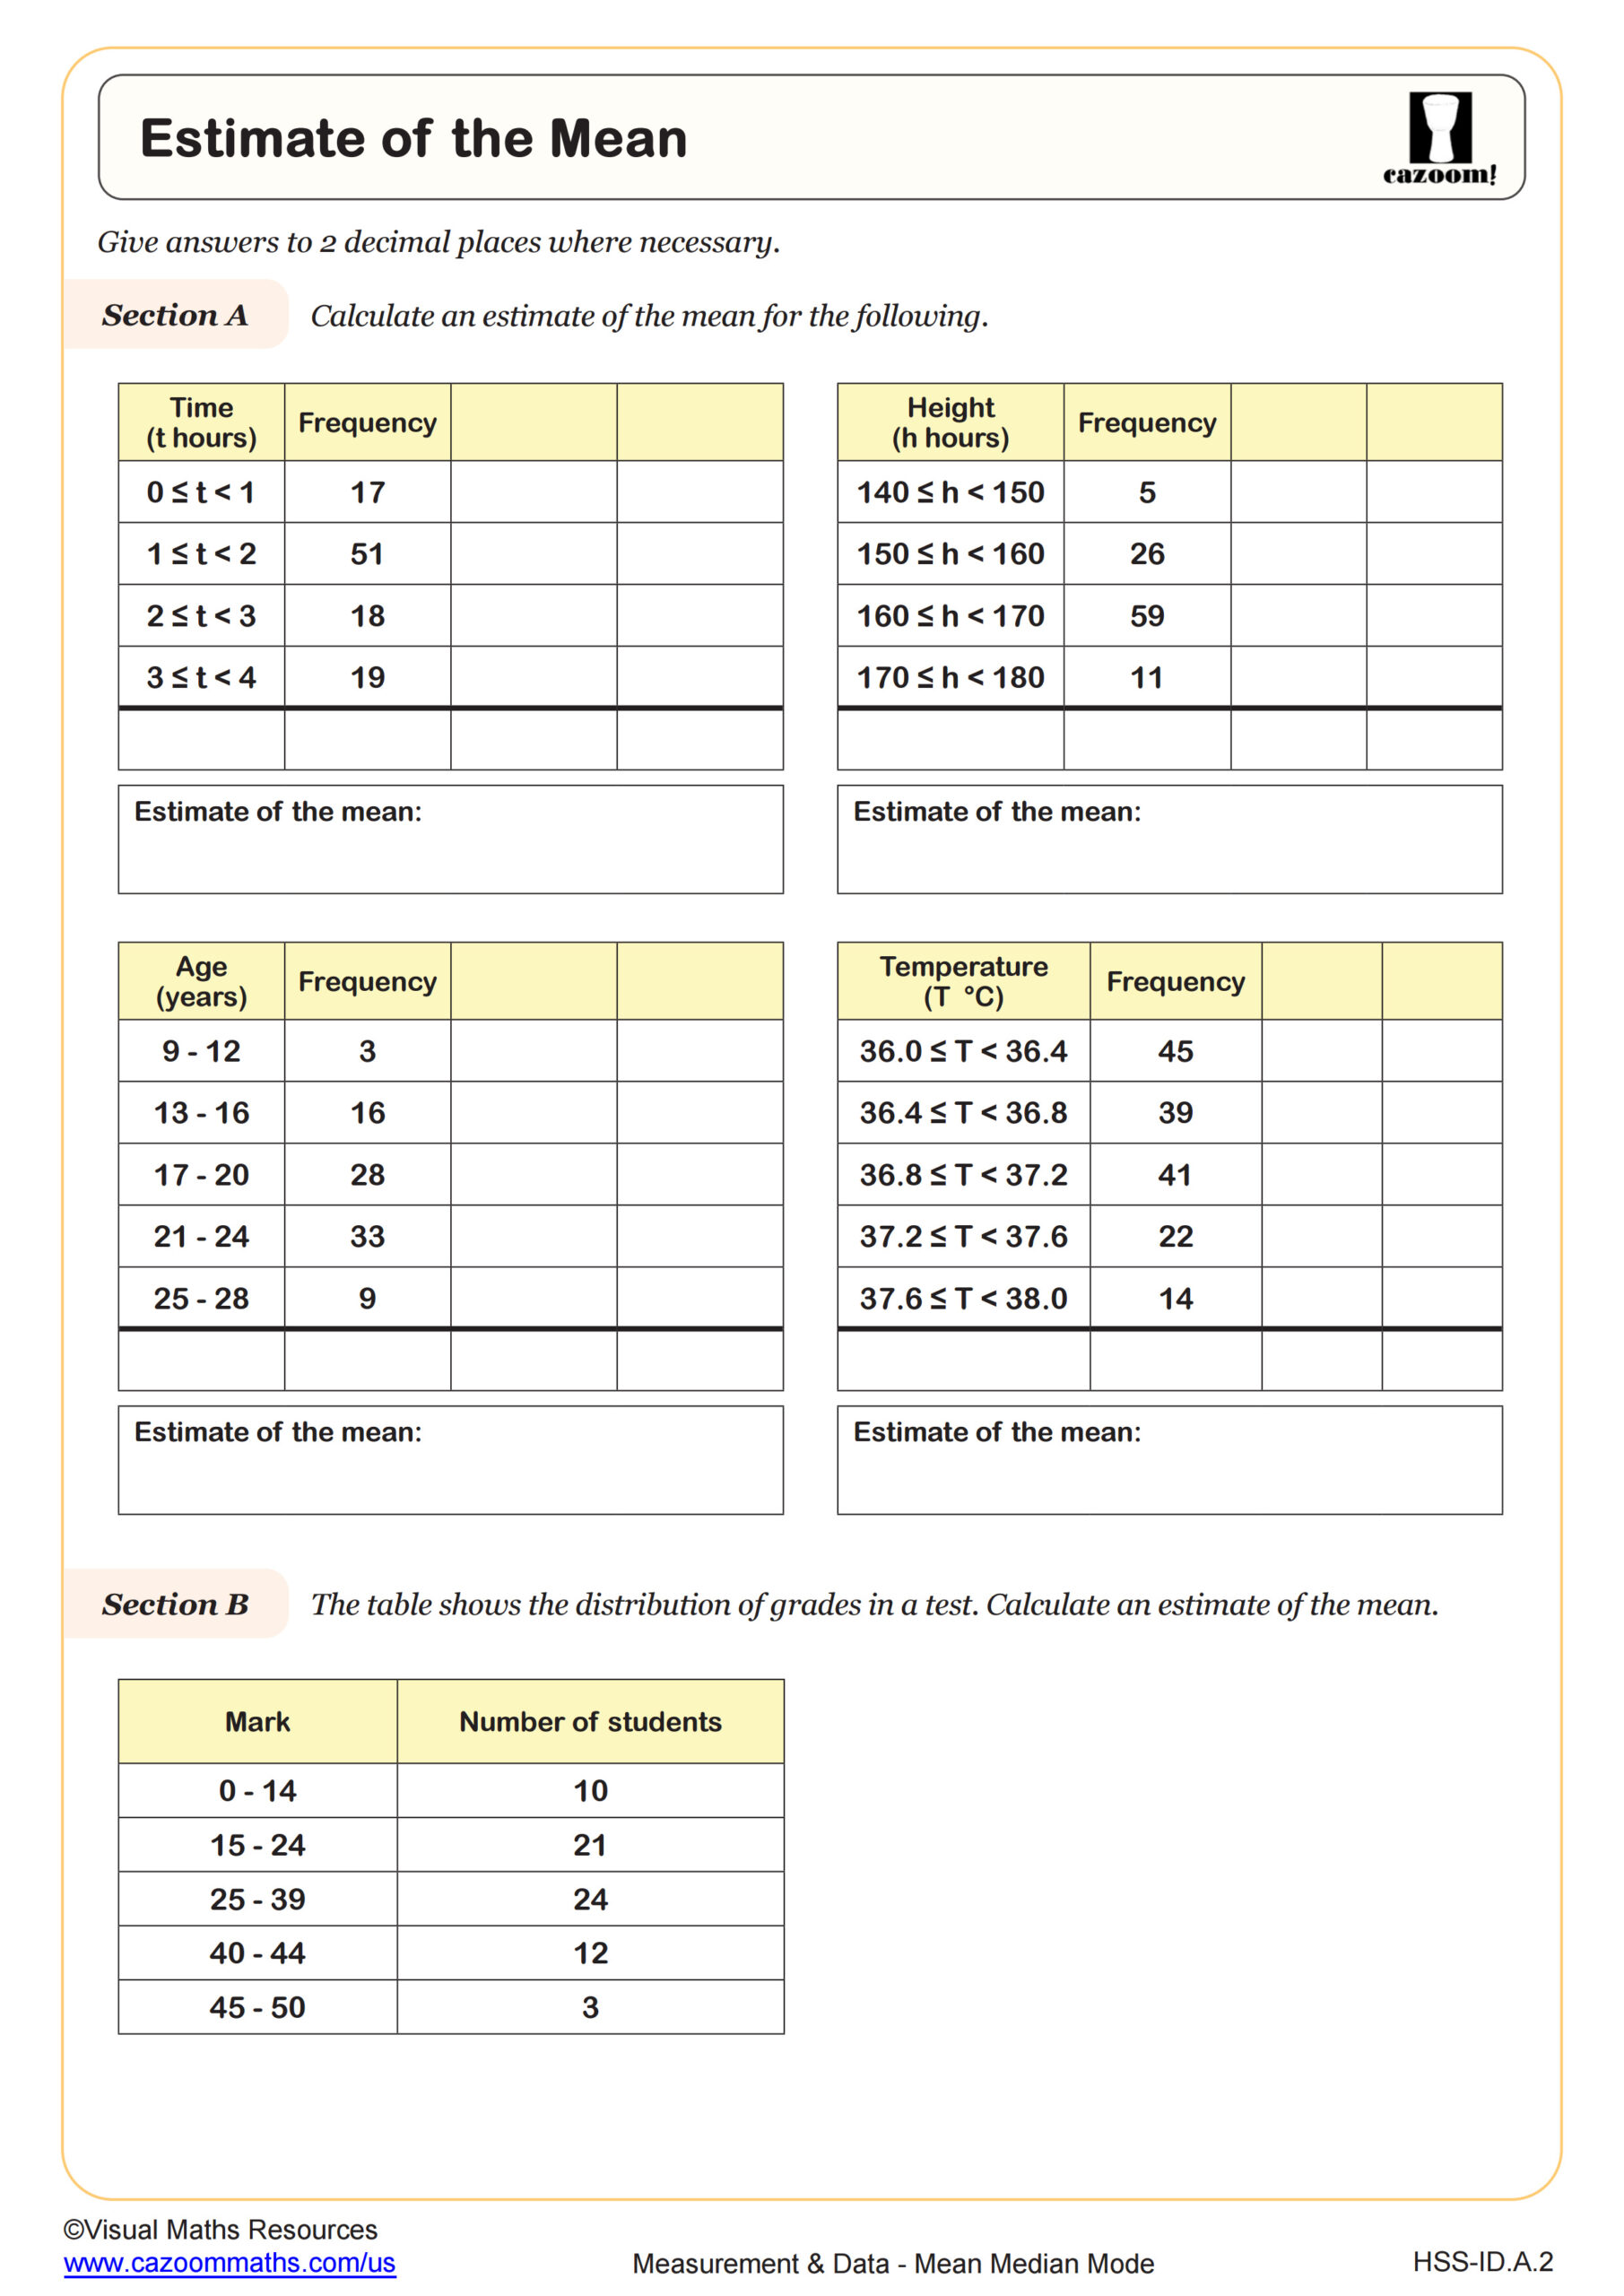
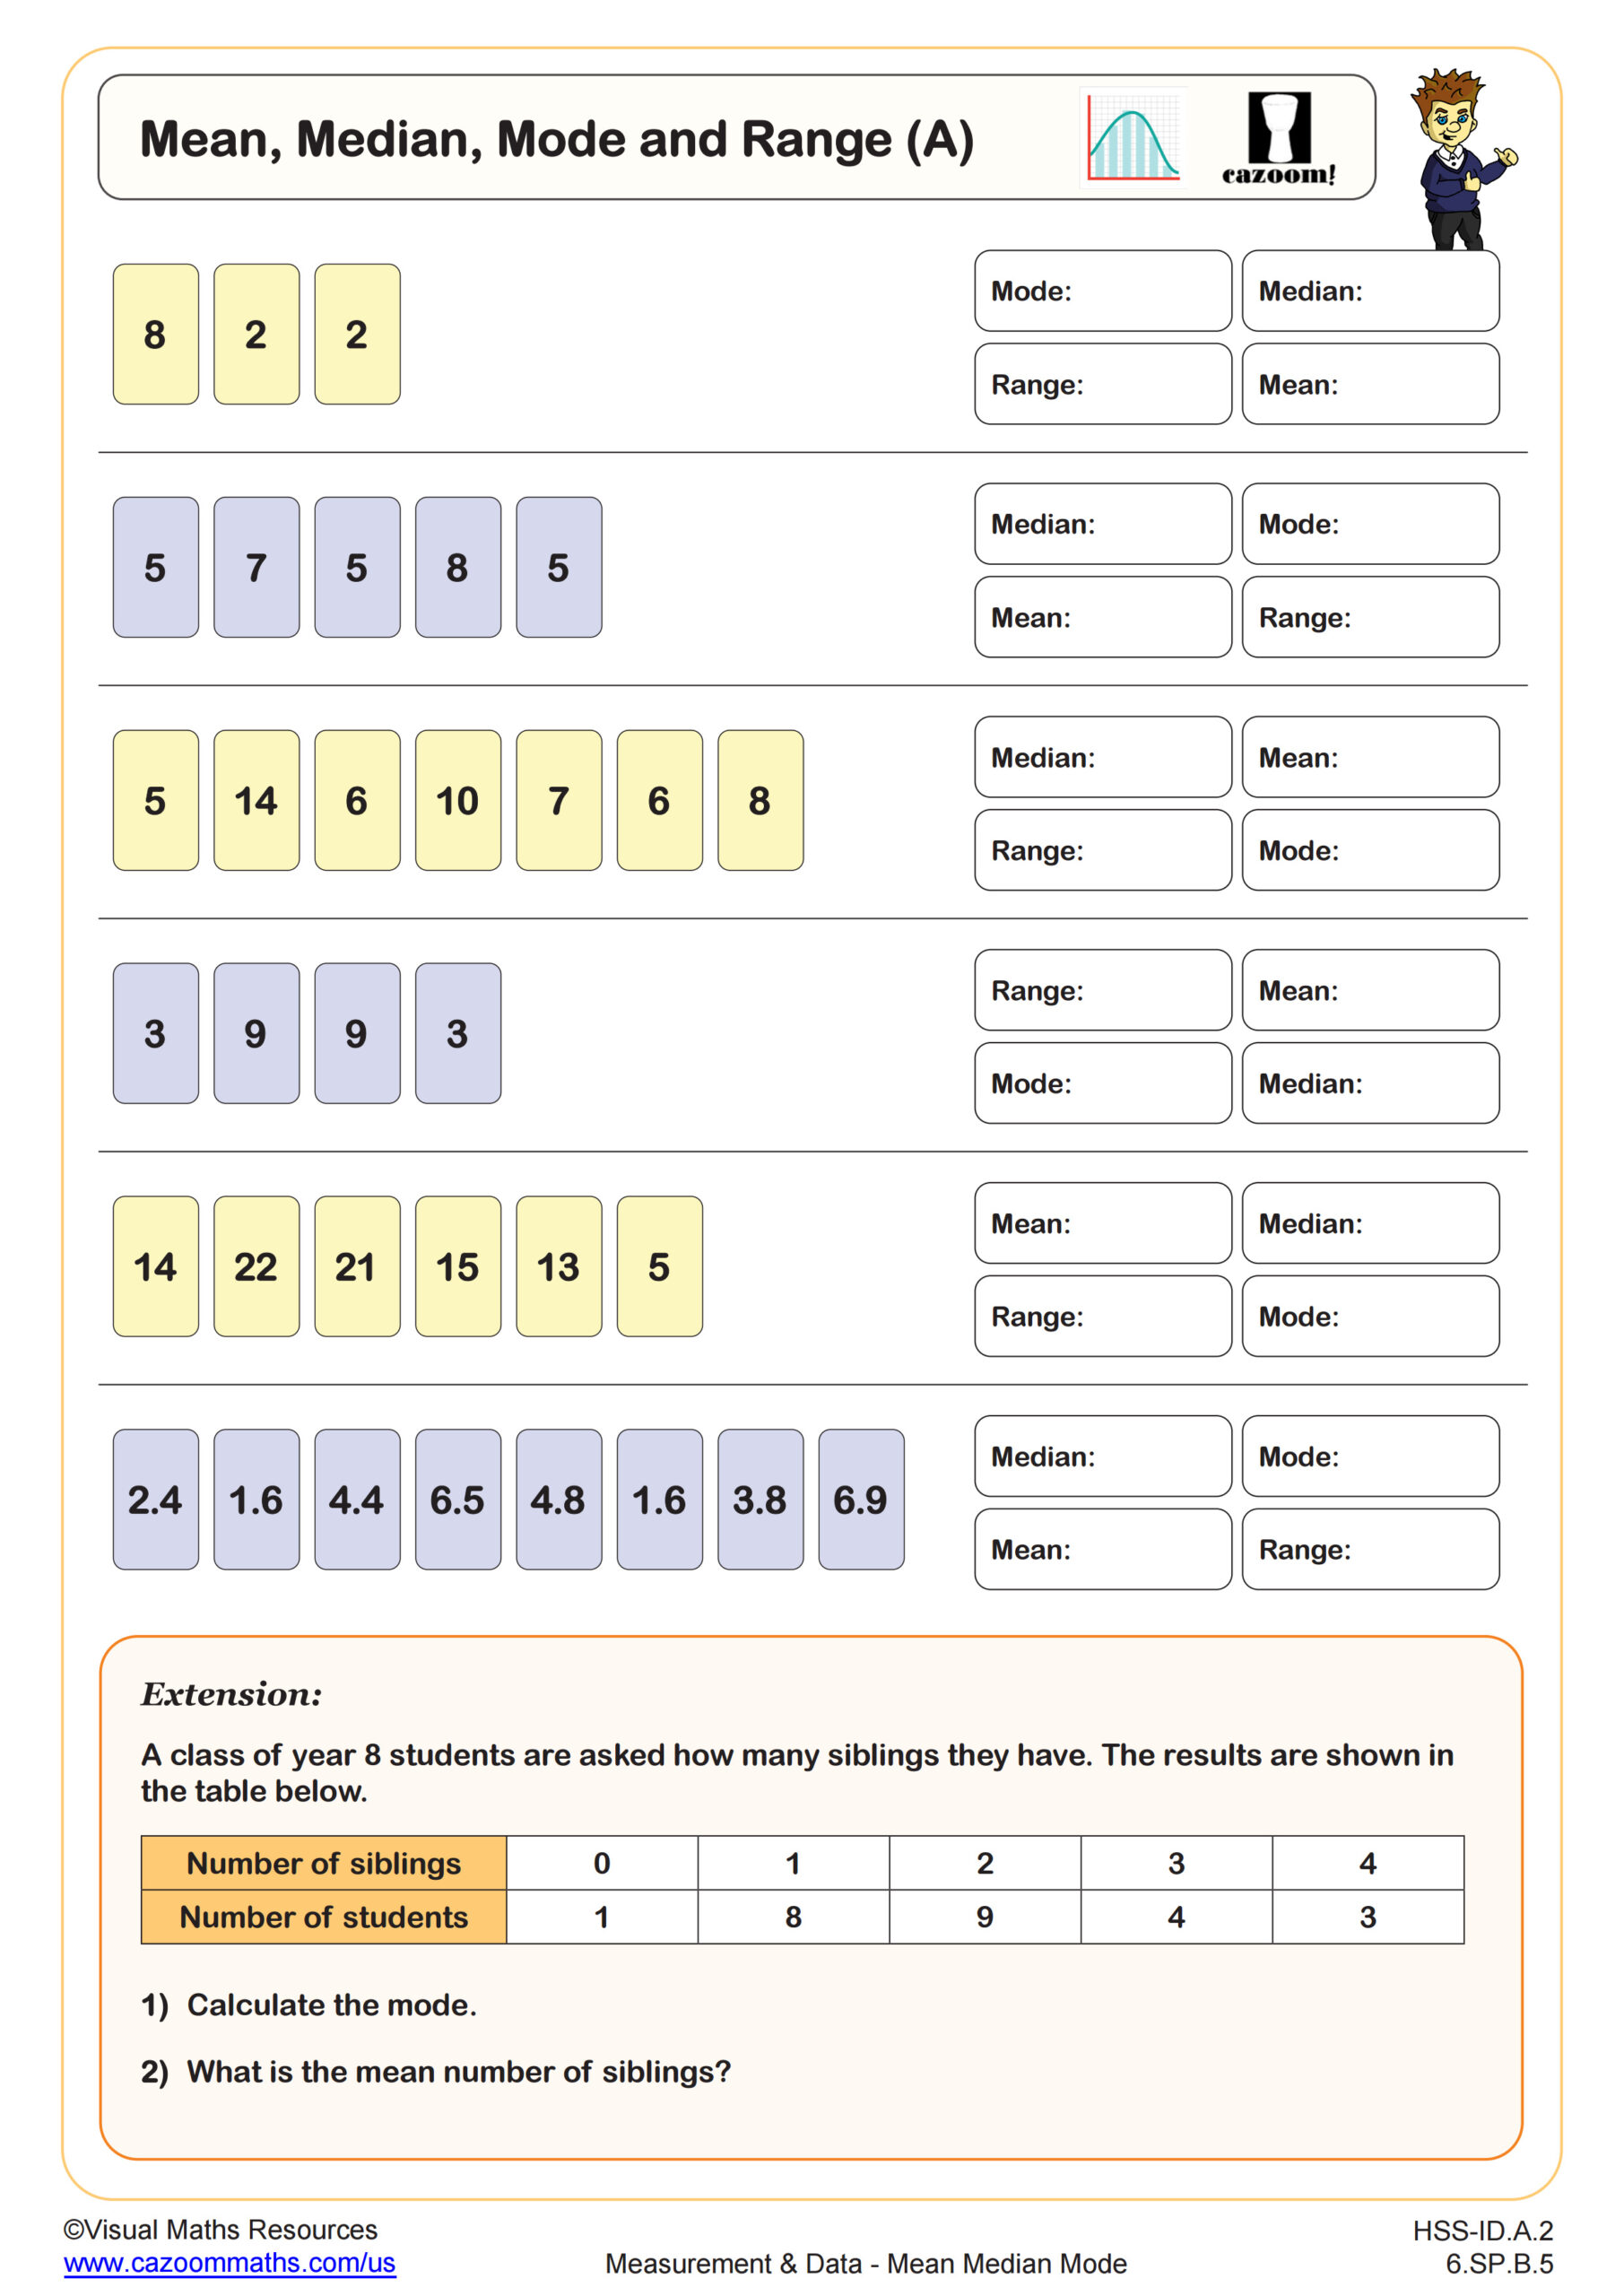
The worksheets scaffold from straightforward calculations to comparative analysis and estimation tasks. Problems progress from finding measures in simple data sets to determining which measure best represents complex situations with outliers or skewed distributions. The variety of problem types, including comparing two data sets and estimating means from grouped data, allows teachers to differentiate instruction based on student readiness while building toward deeper statistical reasoning.
Many teachers assign calculation-focused worksheets as independent practice after introducing concepts, then use comparison and justification problems for paired discussions where students defend their reasoning. The answer keys support quick formative assessment during intervention periods or when reteaching before unit tests. These worksheets work particularly well for SAT preparation during review sessions, since choosing appropriate measures appears regularly on standardized assessments. Teachers also use them as spiral review throughout the year to maintain statistical thinking skills.