Algebra II Real Life Graphs Worksheets
All worksheets are created by the team of experienced teachers at Cazoom Math.
What Do Students Learn from Real Life Graphs in Algebra II?
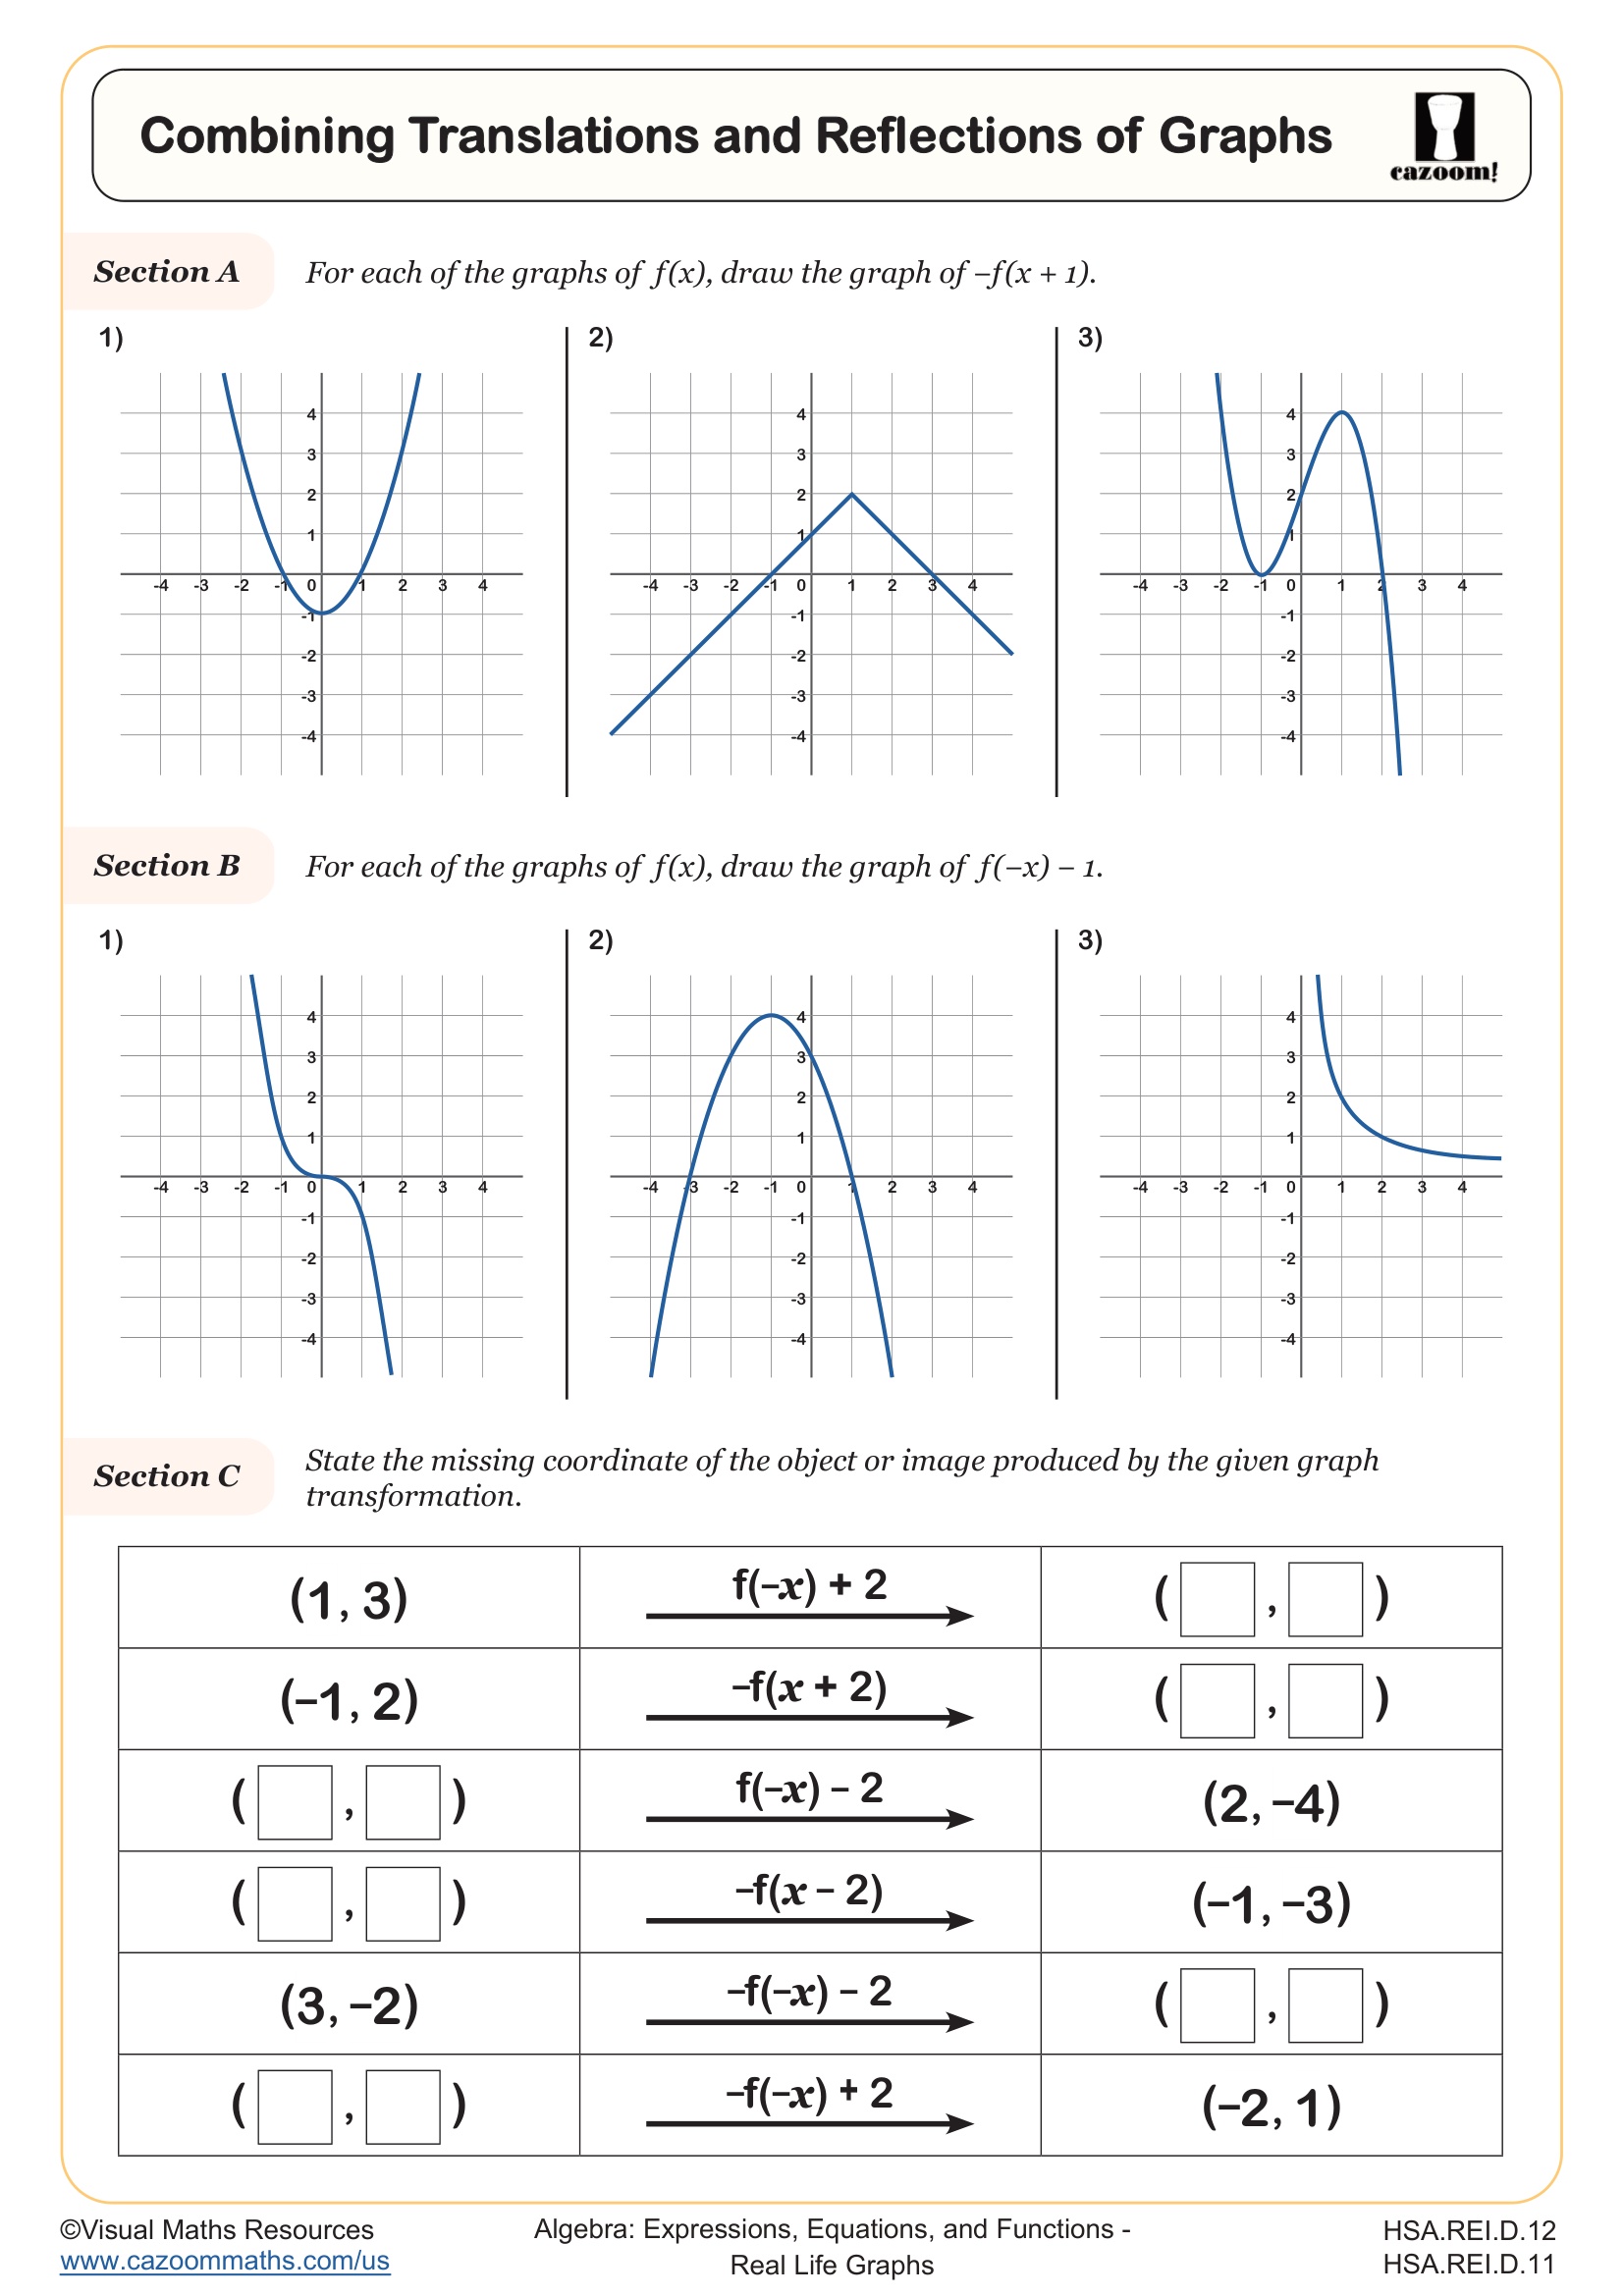
Real life graphs in Algebra II extend beyond plotting points to analyzing how function transformations model actual phenomena. Students interpret what horizontal translations, vertical shifts, reflections, and stretches mean when functions represent scenarios like depreciation, revenue models, or physical motion. The curriculum emphasizes connecting the algebraic notation of transformations to their graphical effects and real-world implications.
Students typically lose points when they correctly transform a graph but fail to update the domain or range based on the context. For example, when modeling product sales with a quadratic function, a reflection across the x-axis might produce negative values that make no sense in the problem situation. Teachers observe that students need explicit practice identifying when transformed functions produce mathematically correct but contextually invalid results.
How Do Real Life Graphs Appear on the SAT and ACT?
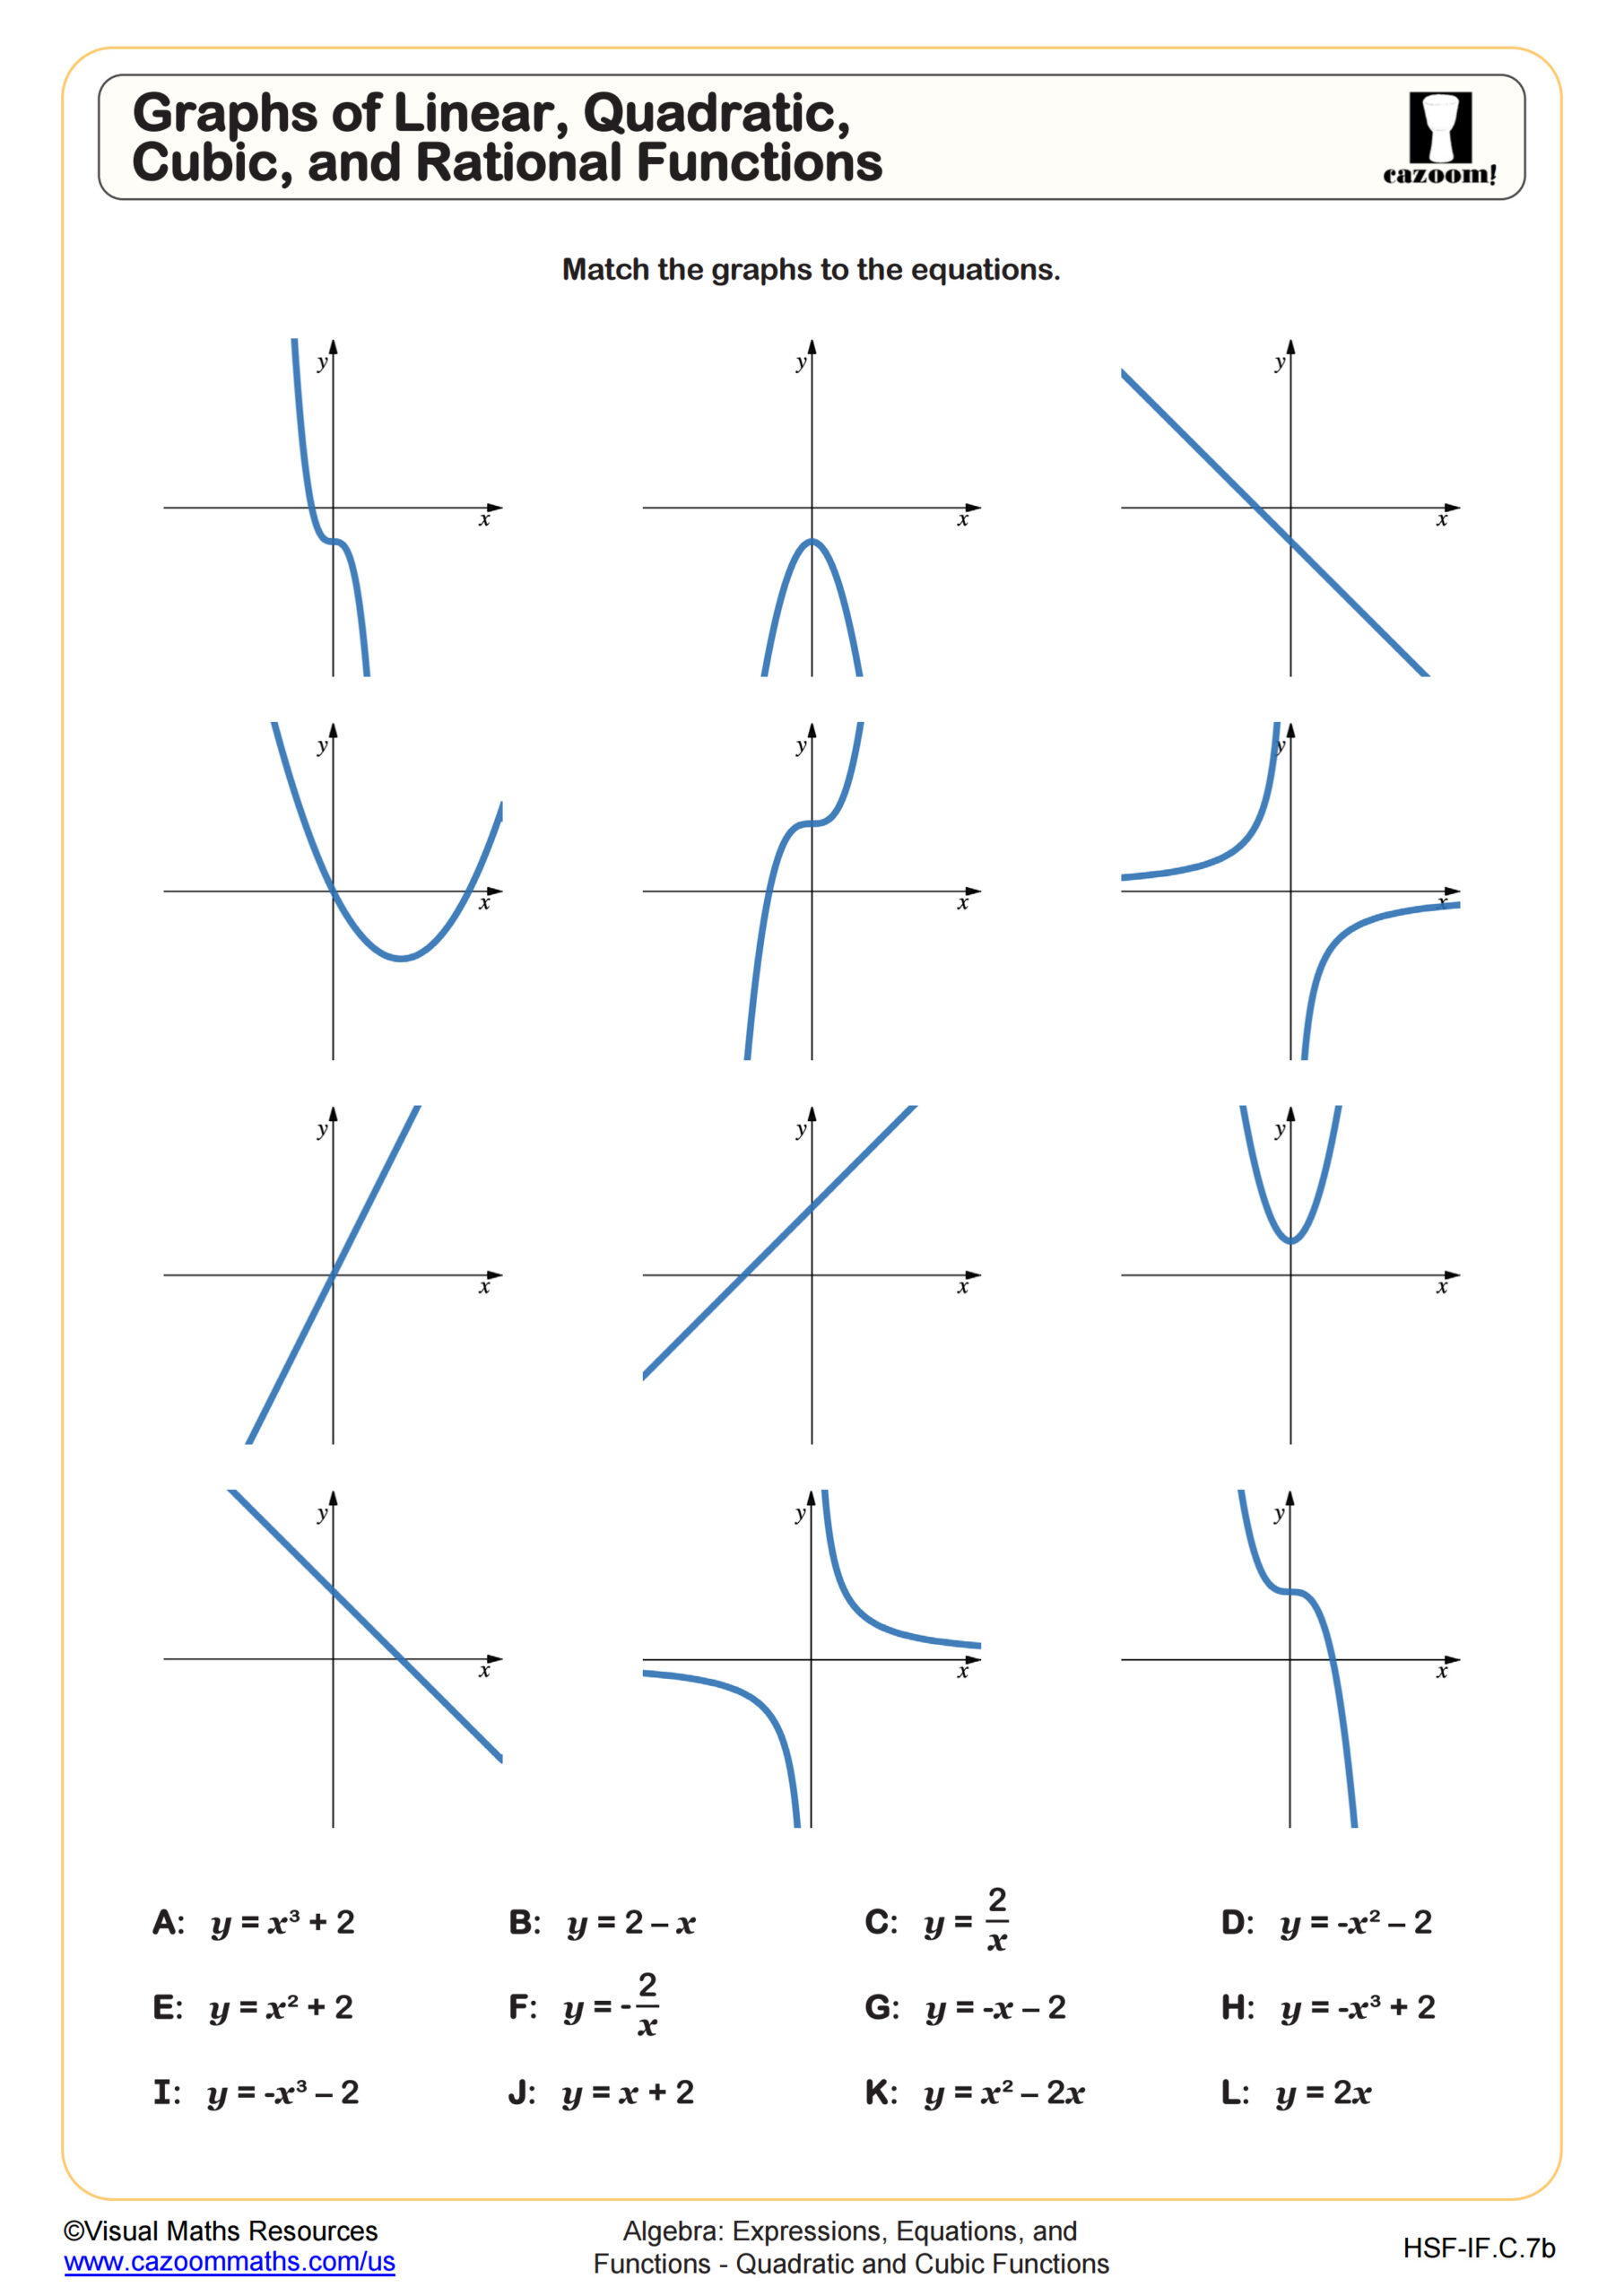
Standardized tests present real life graphs through multi-step questions that require students to interpret function behavior, identify transformations from context, and select appropriate models for situations. The SAT Math section frequently includes questions where students must match a verbal description of a scenario to its corresponding graph or determine which transformation best represents a change in conditions. Students must read graphs critically and understand how algebraic changes affect real-world interpretations.
A common error occurs when students focus solely on visual pattern matching without considering scale or units on axes. Test-takers often select graphs that look similar without verifying that key features like intercepts, maximums, or asymptotes align with the problem constraints. Students also rush through questions asking them to compare multiple function types, choosing the first graph that seems reasonable rather than eliminating options based on end behavior or rate of change.
How Do Students Apply Function Transformations to Real Contexts?
Applying transformations to real-world scenarios requires students to translate verbal descriptions into algebraic operations and then visualize graphical changes. When a company increases production by 500 units, students recognize this as a horizontal translation. If startup costs rise, they identify a vertical shift. Combining transformations, like reflecting a profit function and shifting it upward to model a competitor's different cost structure, challenges students to think about multiple changes simultaneously.
This skill connects directly to STEM fields where professionals model phenomena through function manipulation. Engineers adjust parent functions to represent material stress under different loads, economists shift demand curves to analyze market changes, and data scientists transform probability distributions to fit observed patterns. College calculus courses expect students to enter with fluency in recognizing how algebraic modifications affect function graphs, making this foundational work crucial for students pursuing technical majors.
How Can Teachers Use These Real Life Graphs Worksheets in Algebra II?
These worksheets provide structured practice moving from pure transformation exercises to applied problems where students must justify their reasoning. The progression from combining basic translations and reflections to comparing different function families helps students build confidence before tackling complex modeling scenarios. Answer keys allow students to self-check their work and identify whether errors stem from transformation mechanics or contextual interpretation.
Teachers find these worksheets effective for differentiated instruction, assigning transformation practice to students who need mechanical reinforcement while challenging advanced learners with the function comparison problems. The materials work well as warm-ups before introducing optimization problems or as review stations before unit assessments. Many teachers use selected problems as group discussion starters, asking students to debate which function type best models a given situation and defend their reasoning with graphical evidence.