Algebra II Statistics Worksheets
All worksheets are created by the team of experienced teachers at Cazoom Math.
What statistics skills do Algebra II students need to master?
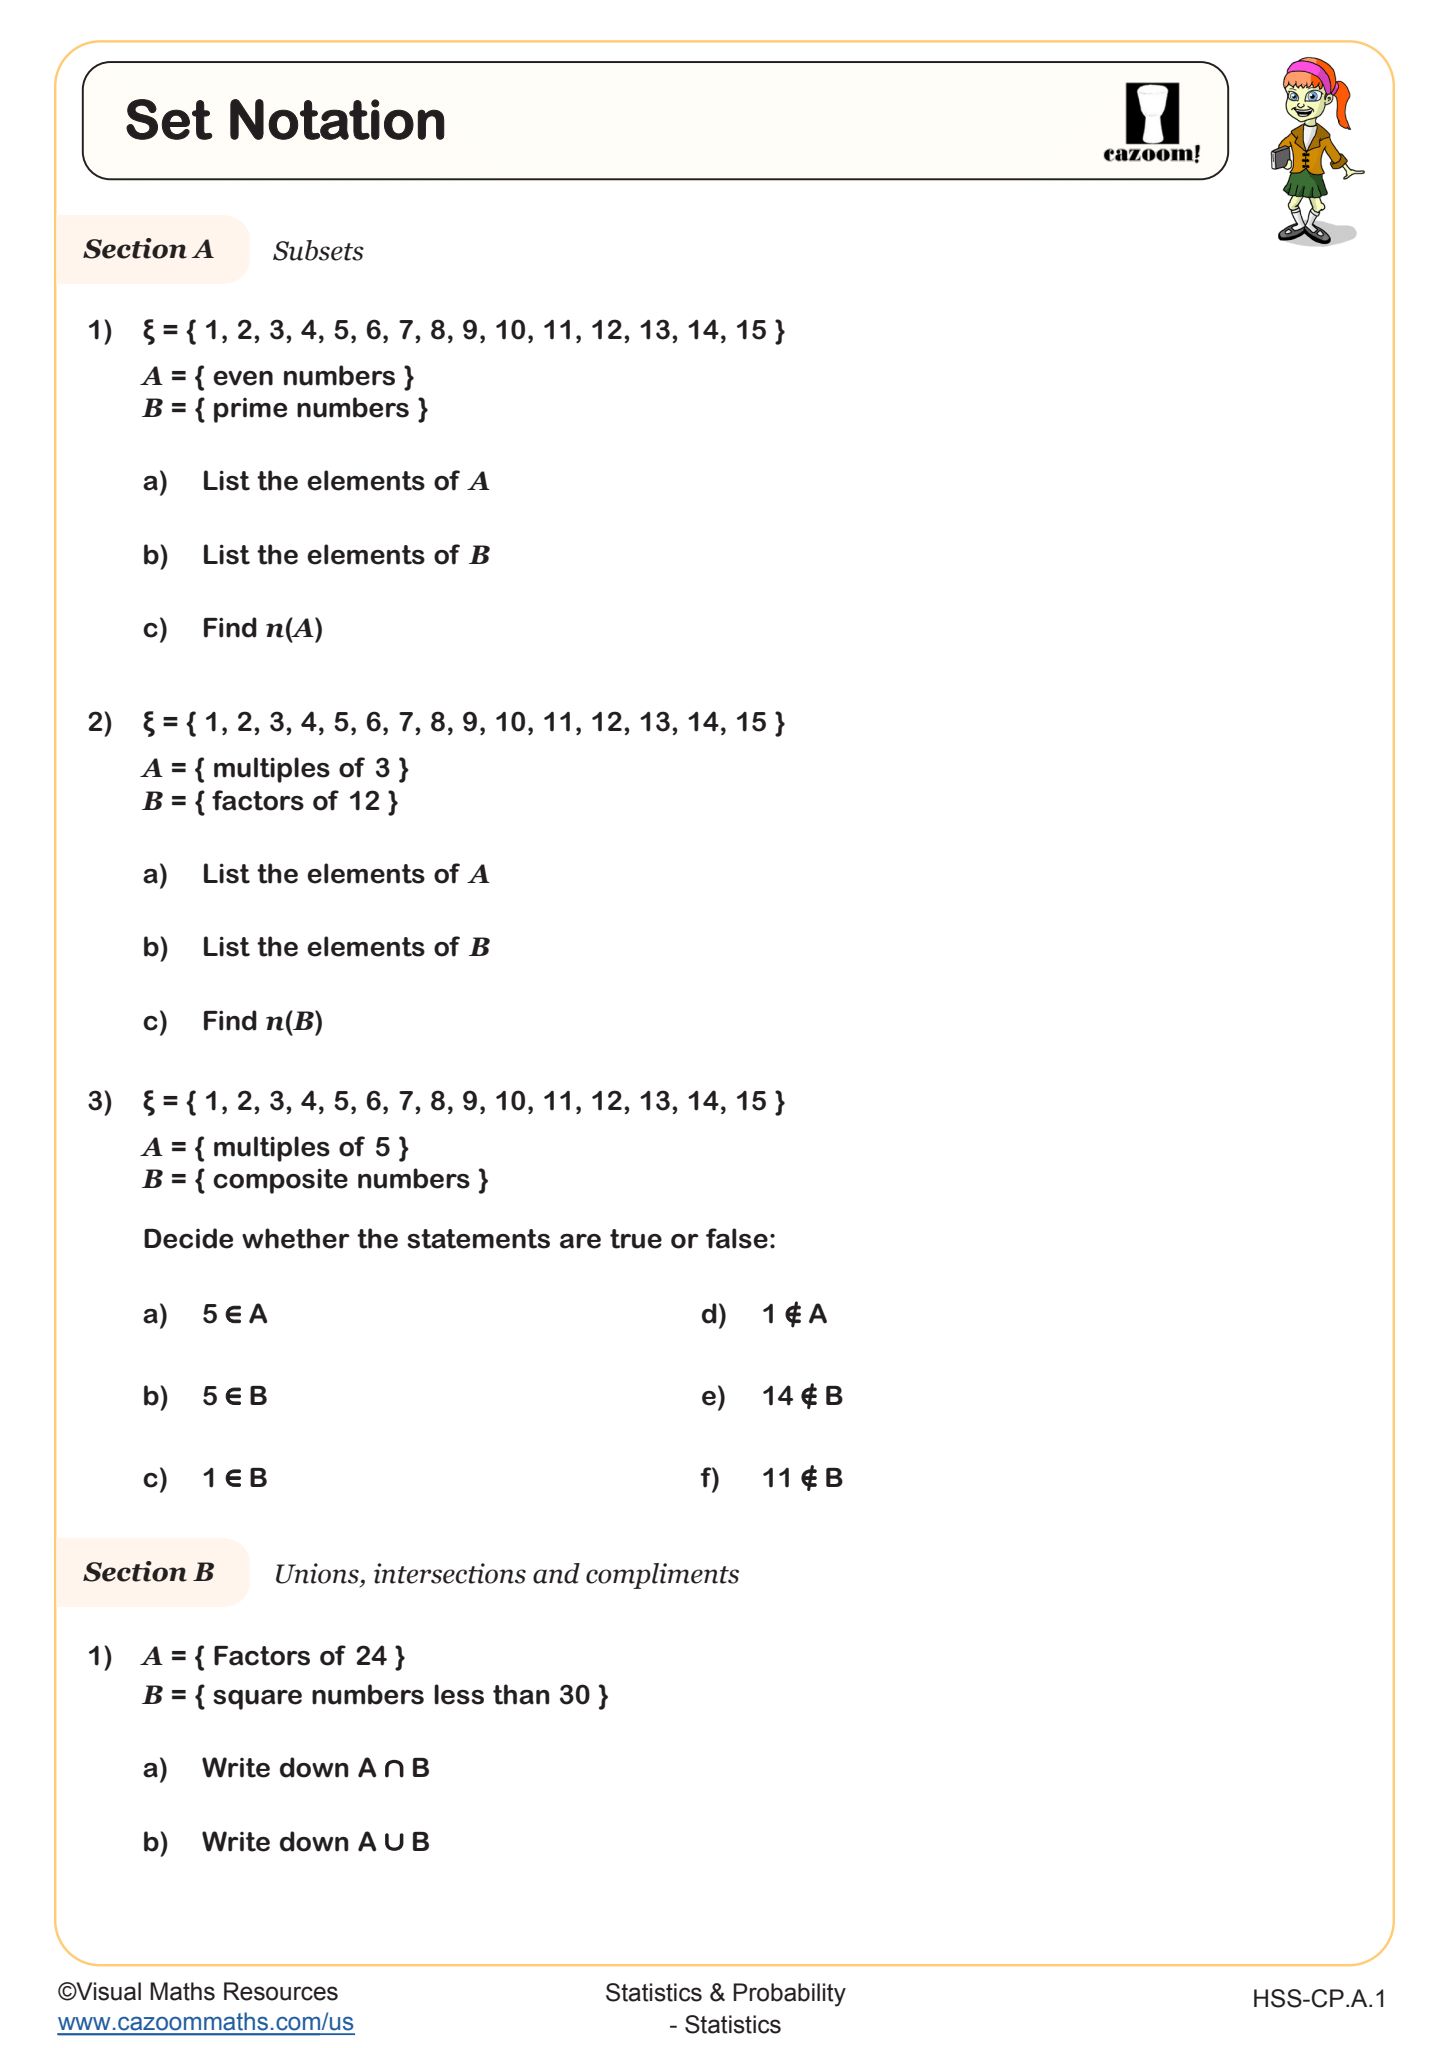
Algebra II statistics focuses on data representation, set notation, and introductory inferential statistics including confidence intervals. Students work with multiple chart types (composite bar charts, dual bar charts, line graphs, and tally charts) to visualize data patterns and communicate findings. Set notation provides the foundation for understanding probability and sample spaces, which becomes critical in AP Statistics and college mathematics courses.
Many students lose points on standardized tests when they create graphs without properly labeling axes or using inconsistent scales. Teachers often see students rush through tally chart construction, leading to counting errors that cascade through the entire problem. The worksheets emphasize proper data organization techniques and require students to demonstrate precision in both calculations and visual representations, building habits that improve accuracy across all statistical work.
Which grade levels use these statistics worksheets?
These statistics worksheets align with Algebra II curriculum standards, typically taught to high school students in grades 9-11 depending on their mathematics pathway. Students in advanced tracks may encounter this material in ninth grade, while others work through these concepts in tenth or eleventh grade. The content matches expectations for high school algebra courses that include a statistics and probability unit.
The progression within Algebra II statistics moves from basic data collection and representation (tally charts, simple graphs) toward more sophisticated analysis involving set notation and confidence intervals. Students build on foundational skills from earlier algebra courses, applying algebraic thinking to statistical contexts. This preparation becomes essential for students planning to take AP Statistics, where they'll need fluency with data representation and basic inferential statistics concepts.
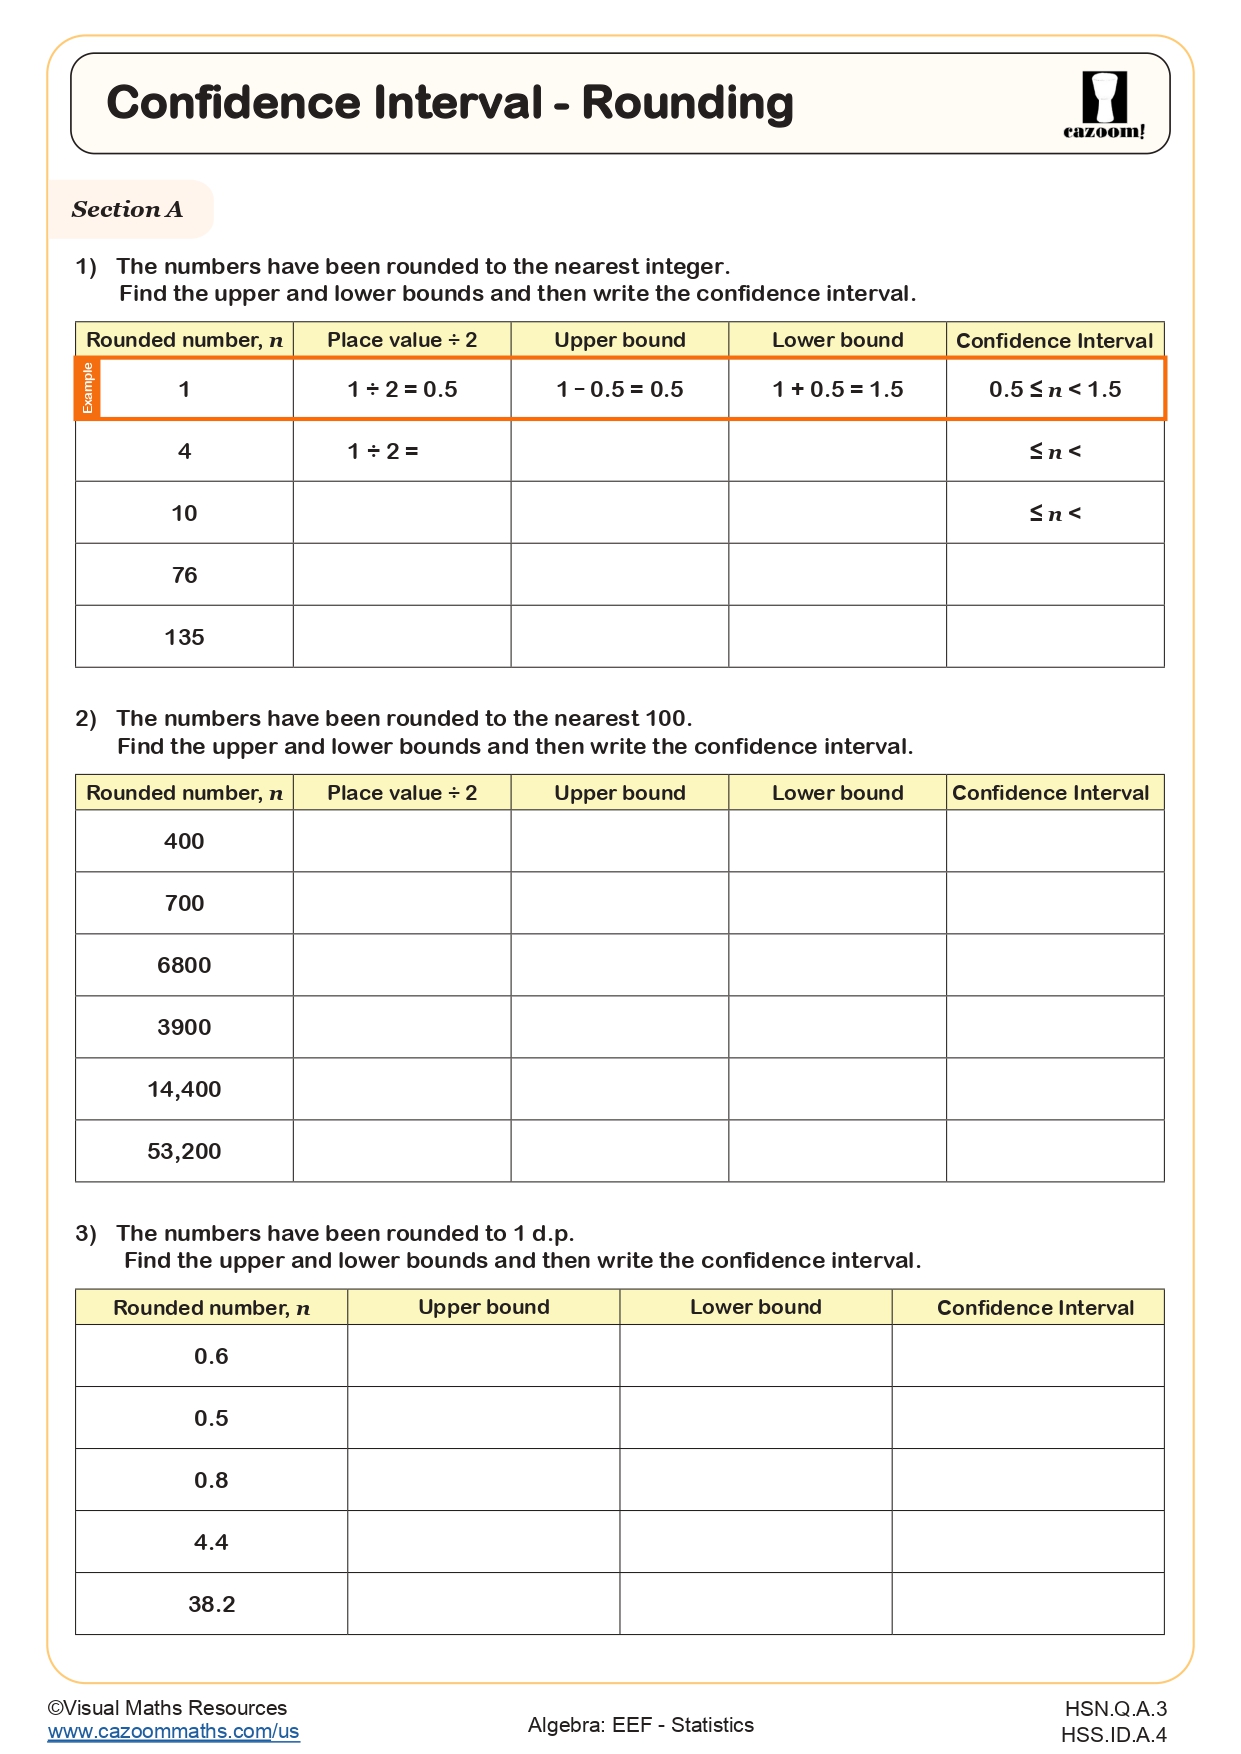
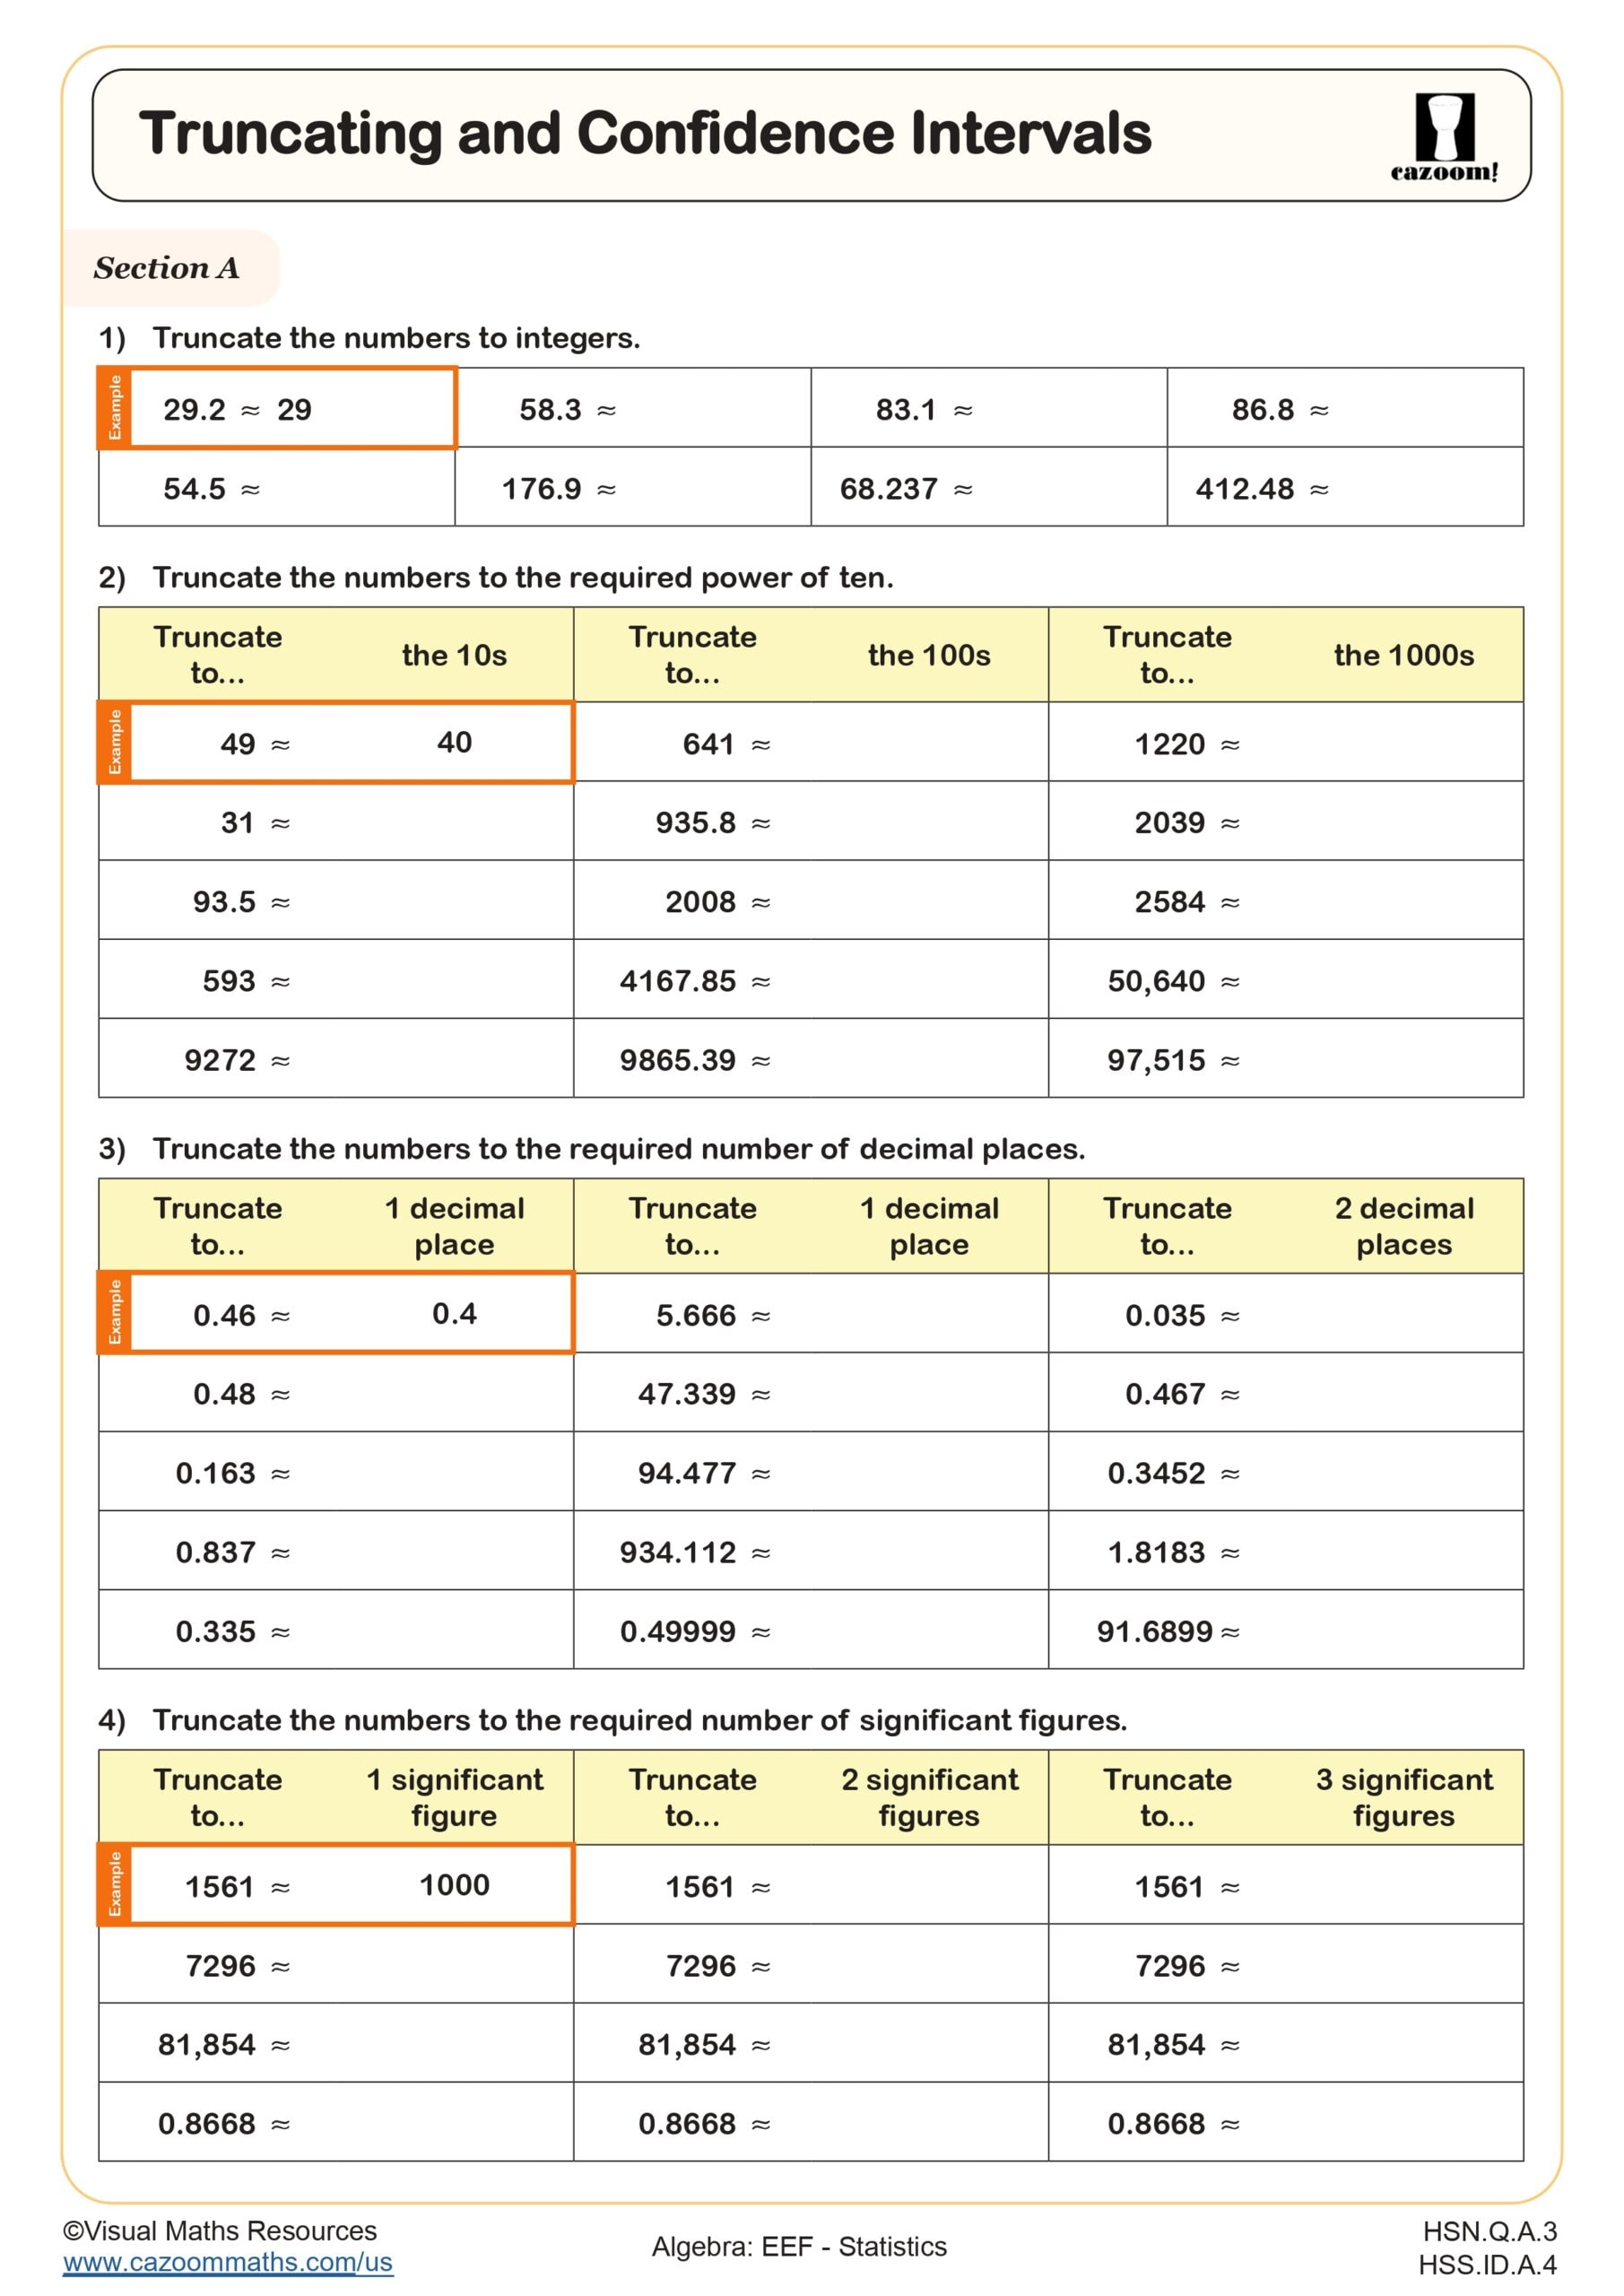
How do students calculate and round confidence intervals correctly?
Confidence intervals estimate a population parameter by providing a range of plausible values based on sample data. Students calculate the interval using the sample statistic plus or minus a margin of error, which incorporates the critical value and standard error. The rounding challenge arises because students must maintain precision throughout multi-step calculations before rounding their final interval endpoints to an appropriate number of decimal places based on the context.
This skill connects directly to STEM fields where researchers report experimental results with uncertainty measures. Pharmaceutical companies use confidence intervals to report drug efficacy rates, environmental scientists apply them when analyzing pollution levels, and engineers rely on them for quality control in manufacturing processes. Students who understand confidence interval precision recognize why a medication label might state "reduces symptoms in 65-75% of patients" rather than claiming an exact percentage, demonstrating statistical honesty about sample-based estimates.
How can teachers use these statistics worksheets effectively?
The worksheets provide scaffolded practice that moves students from guided examples to independent problem-solving. Each worksheet focuses on a specific skill set, allowing teachers to target areas where students need additional support without overwhelming them with mixed topics. The included answer keys enable students to check their work immediately, which helps them identify misconceptions before they become ingrained habits.
Teachers use these worksheets for differentiated instruction, assigning specific sheets based on student readiness levels or assessment results. They work well as homework reinforcement after introducing new statistical concepts in class, as bell ringers to activate prior knowledge, or as intervention materials for students who need extra practice before unit tests. Paired work allows students to discuss their graph interpretations and catch each other's labeling errors, building both skills and mathematical communication.