Real Life Graphs Worksheets With Answers
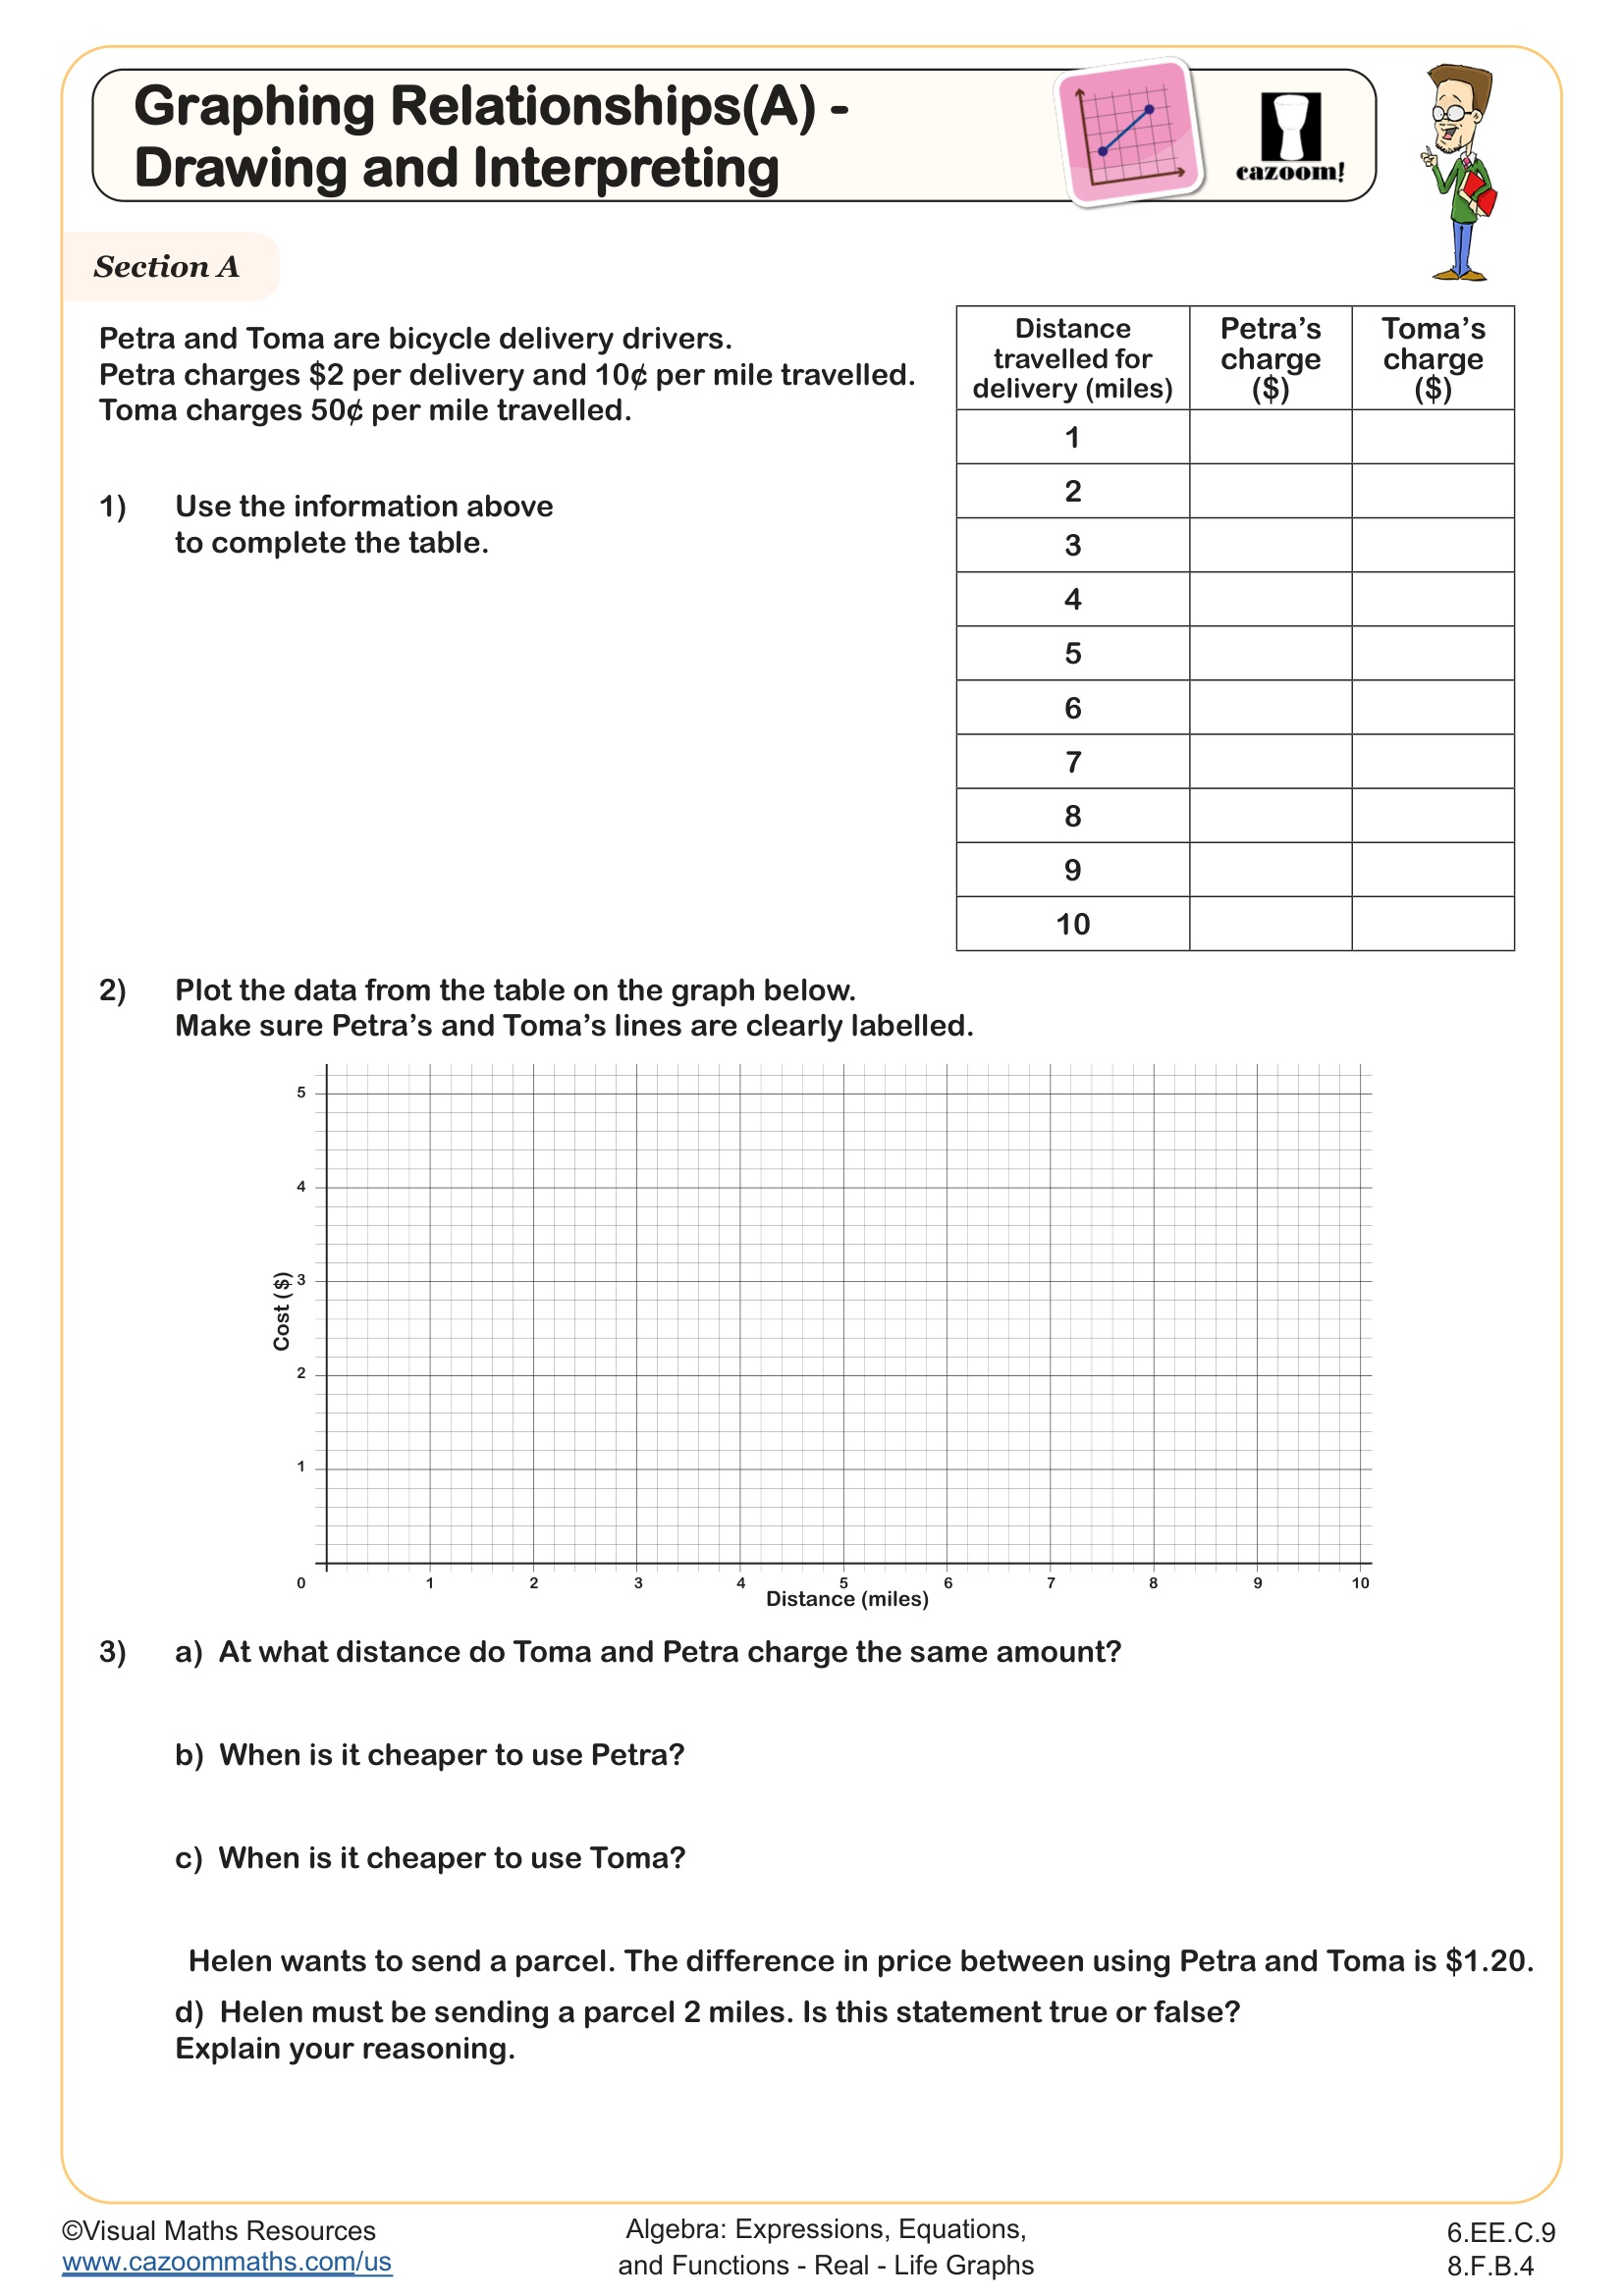
Graphing Relationships (A) - Drawing and Interpreting
Grades: 6th Grade, 8th Grade
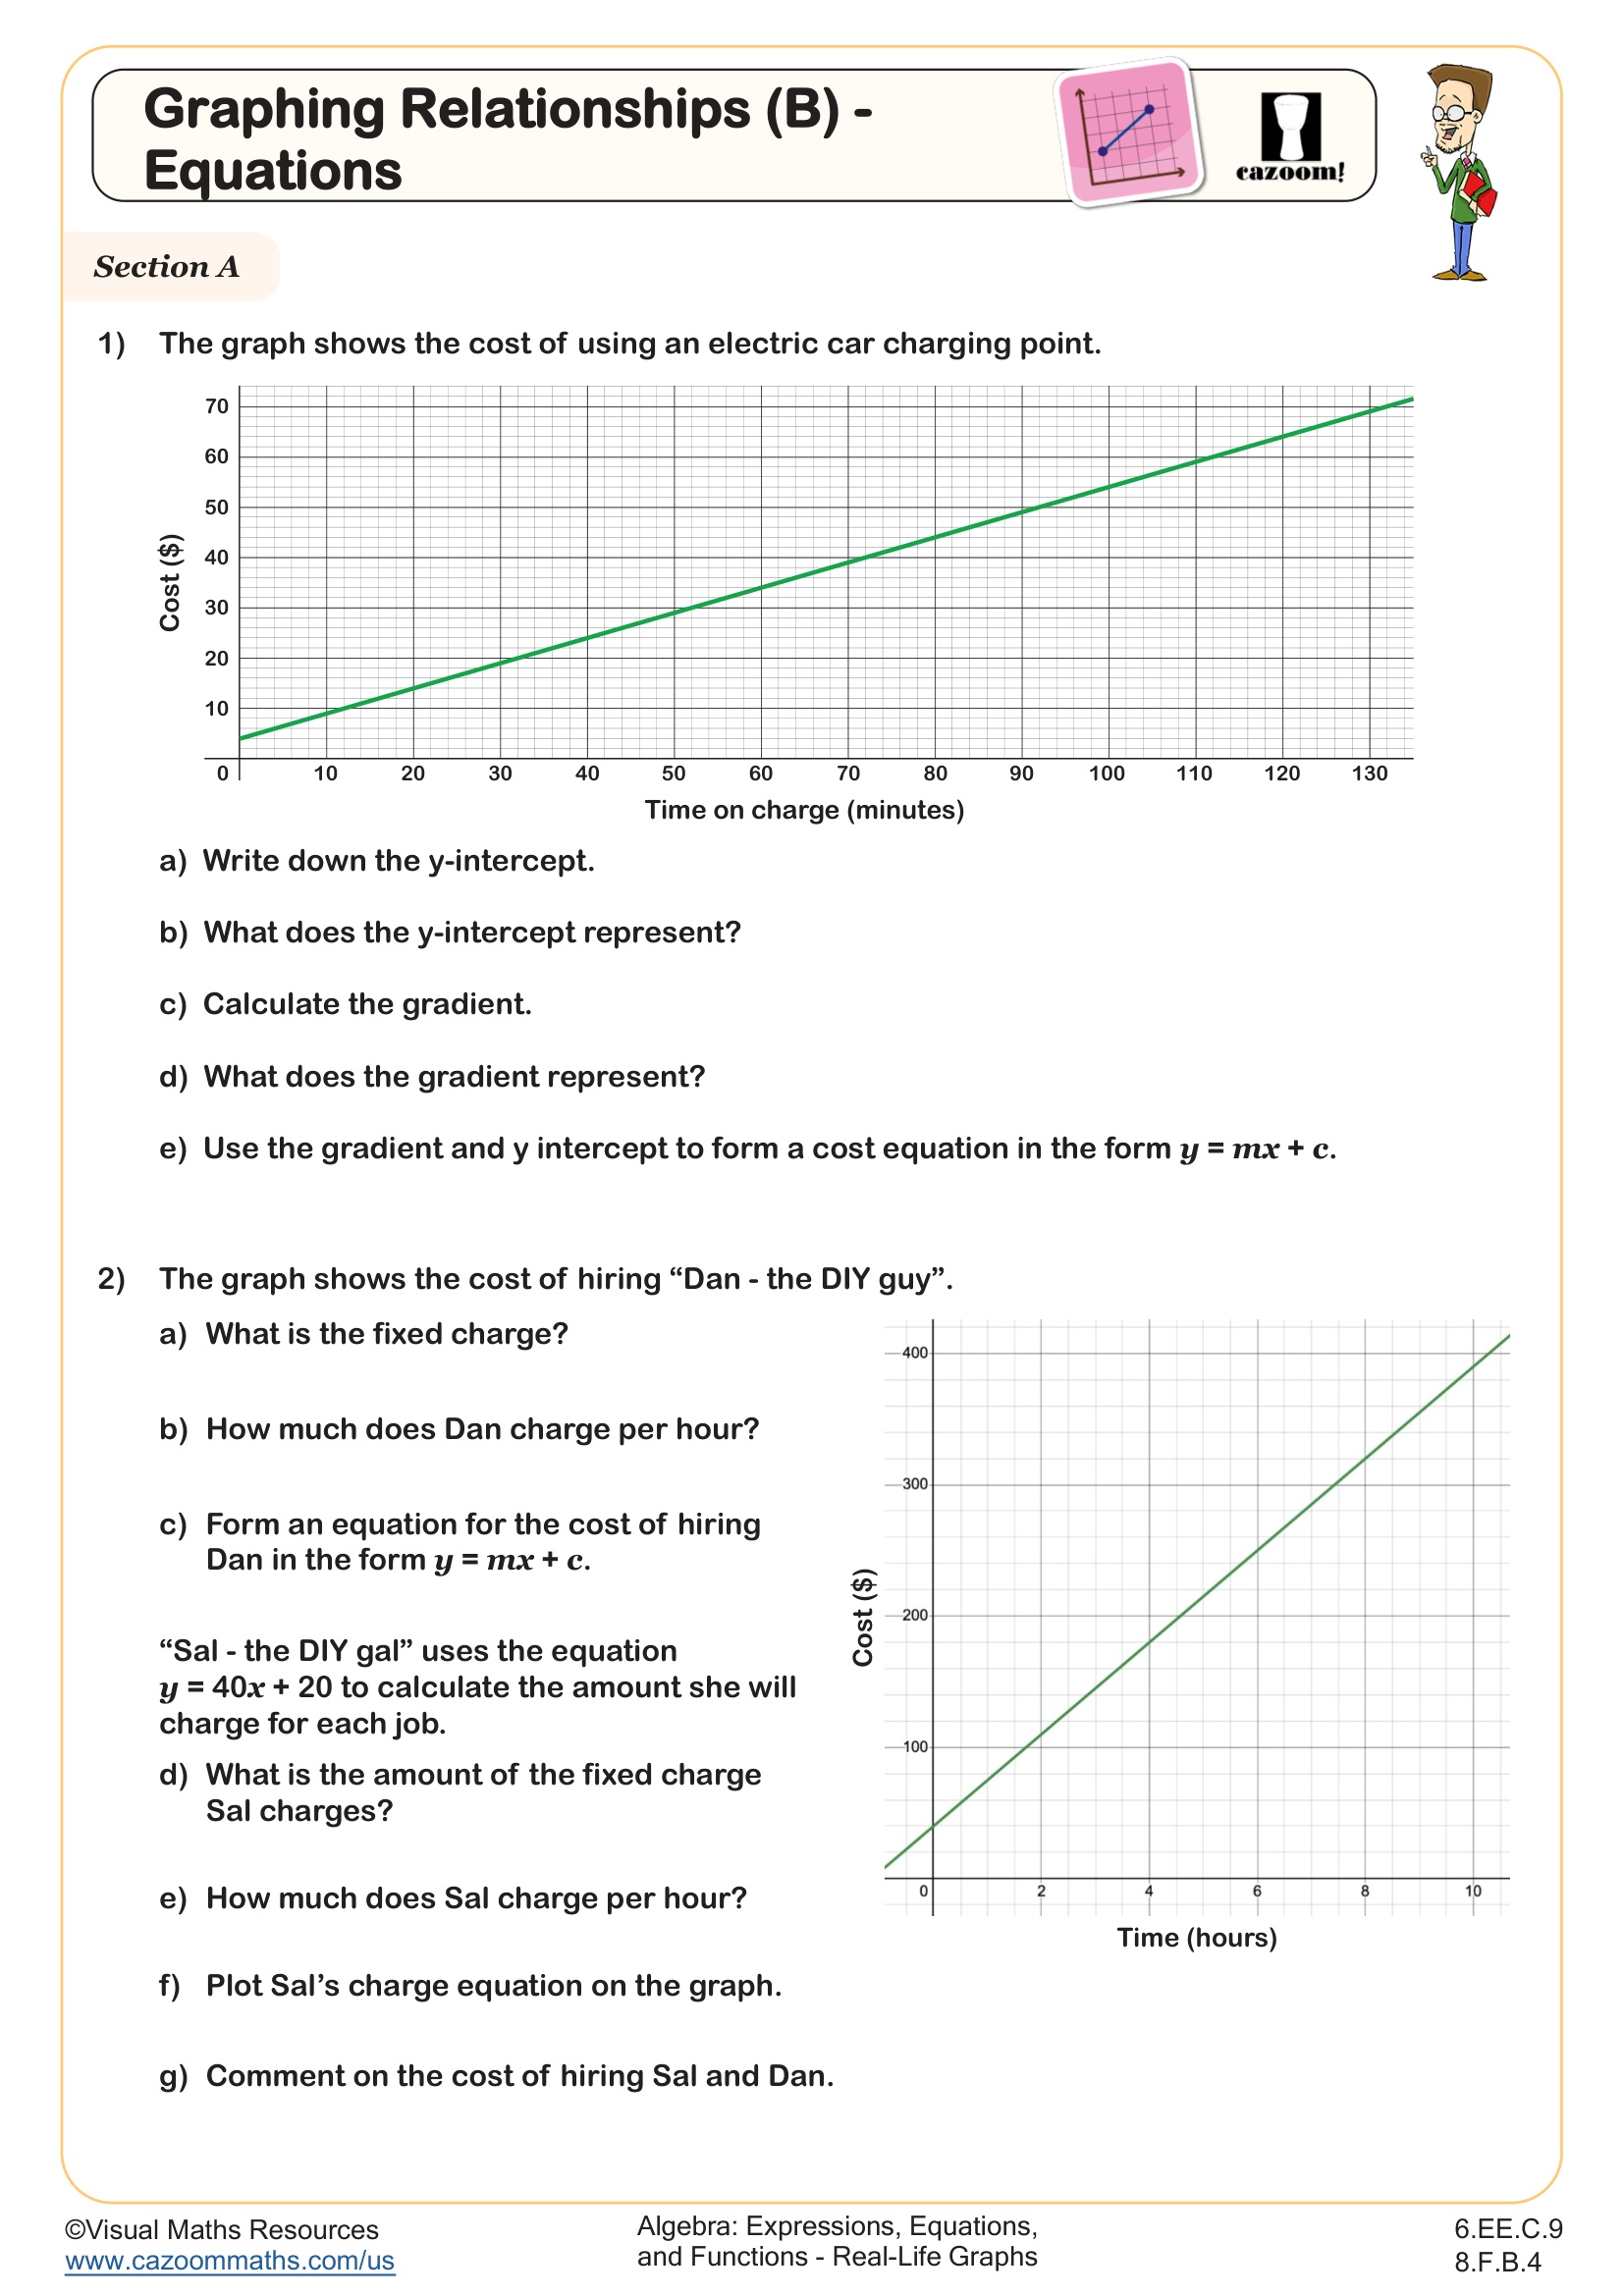
Graphing Relationships (B) - Equations
Grades: 6th Grade, 8th Grade
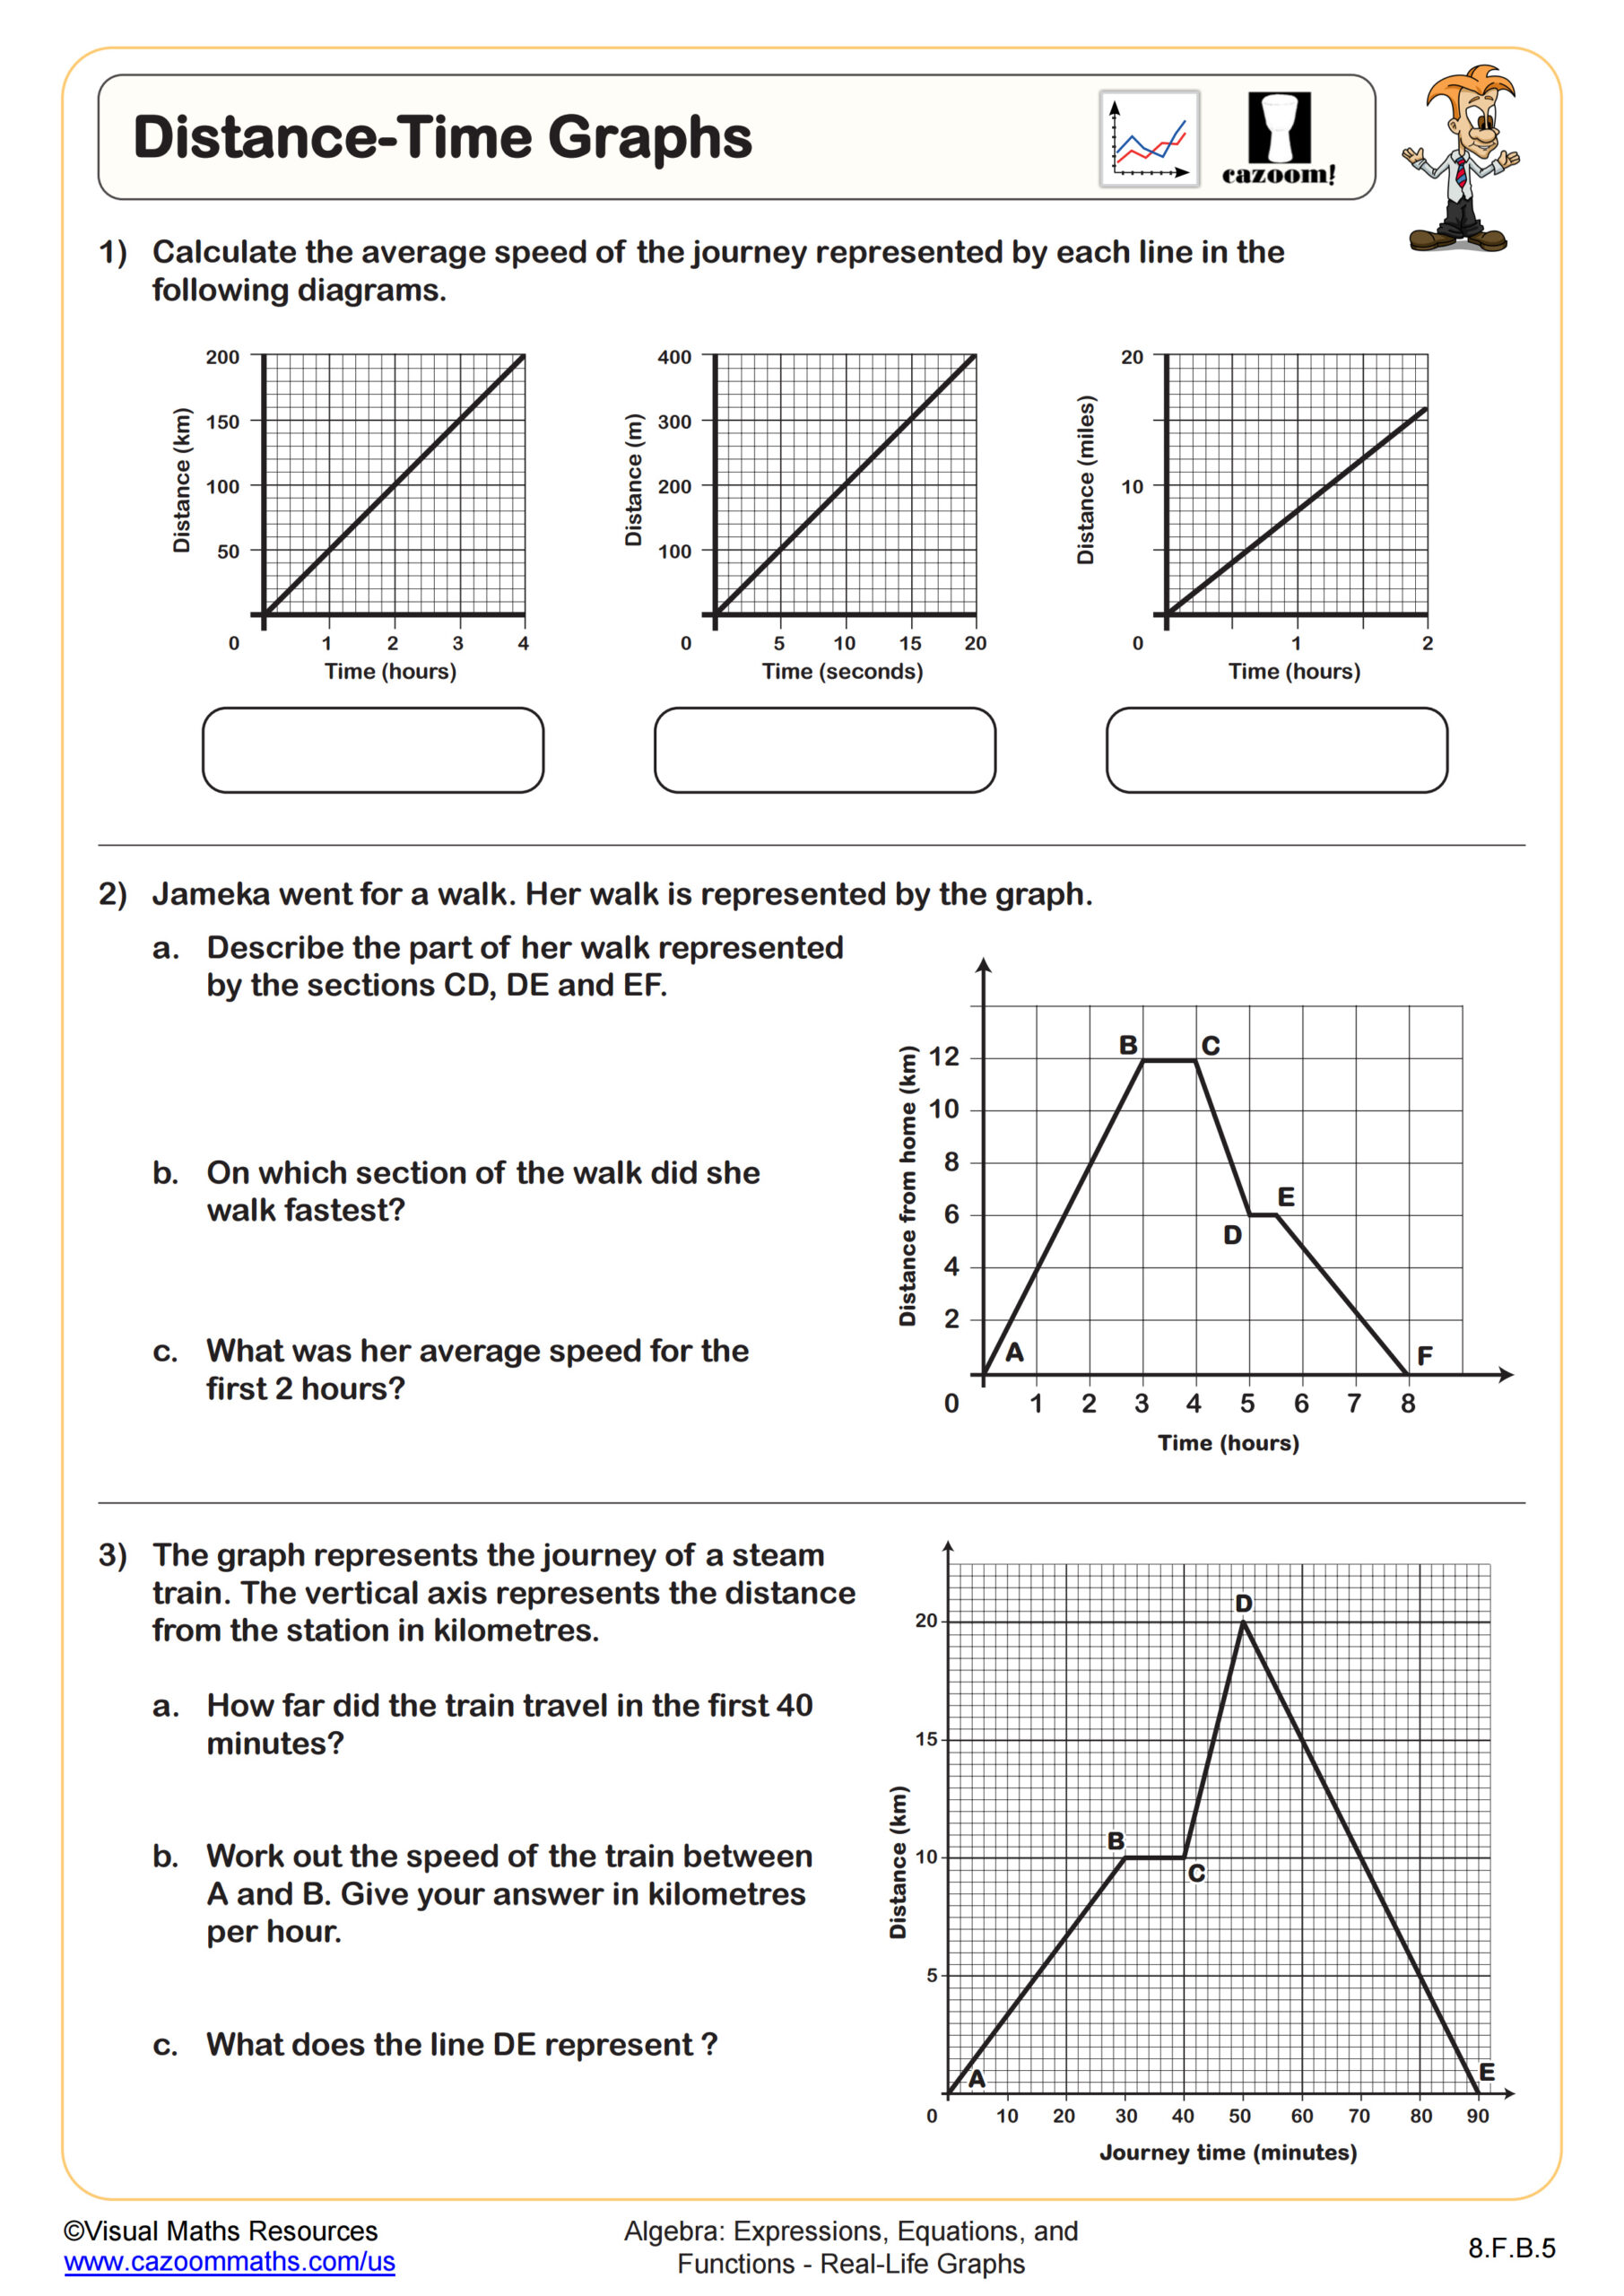
Distance-Time Graphs
Grades: 8th Grade
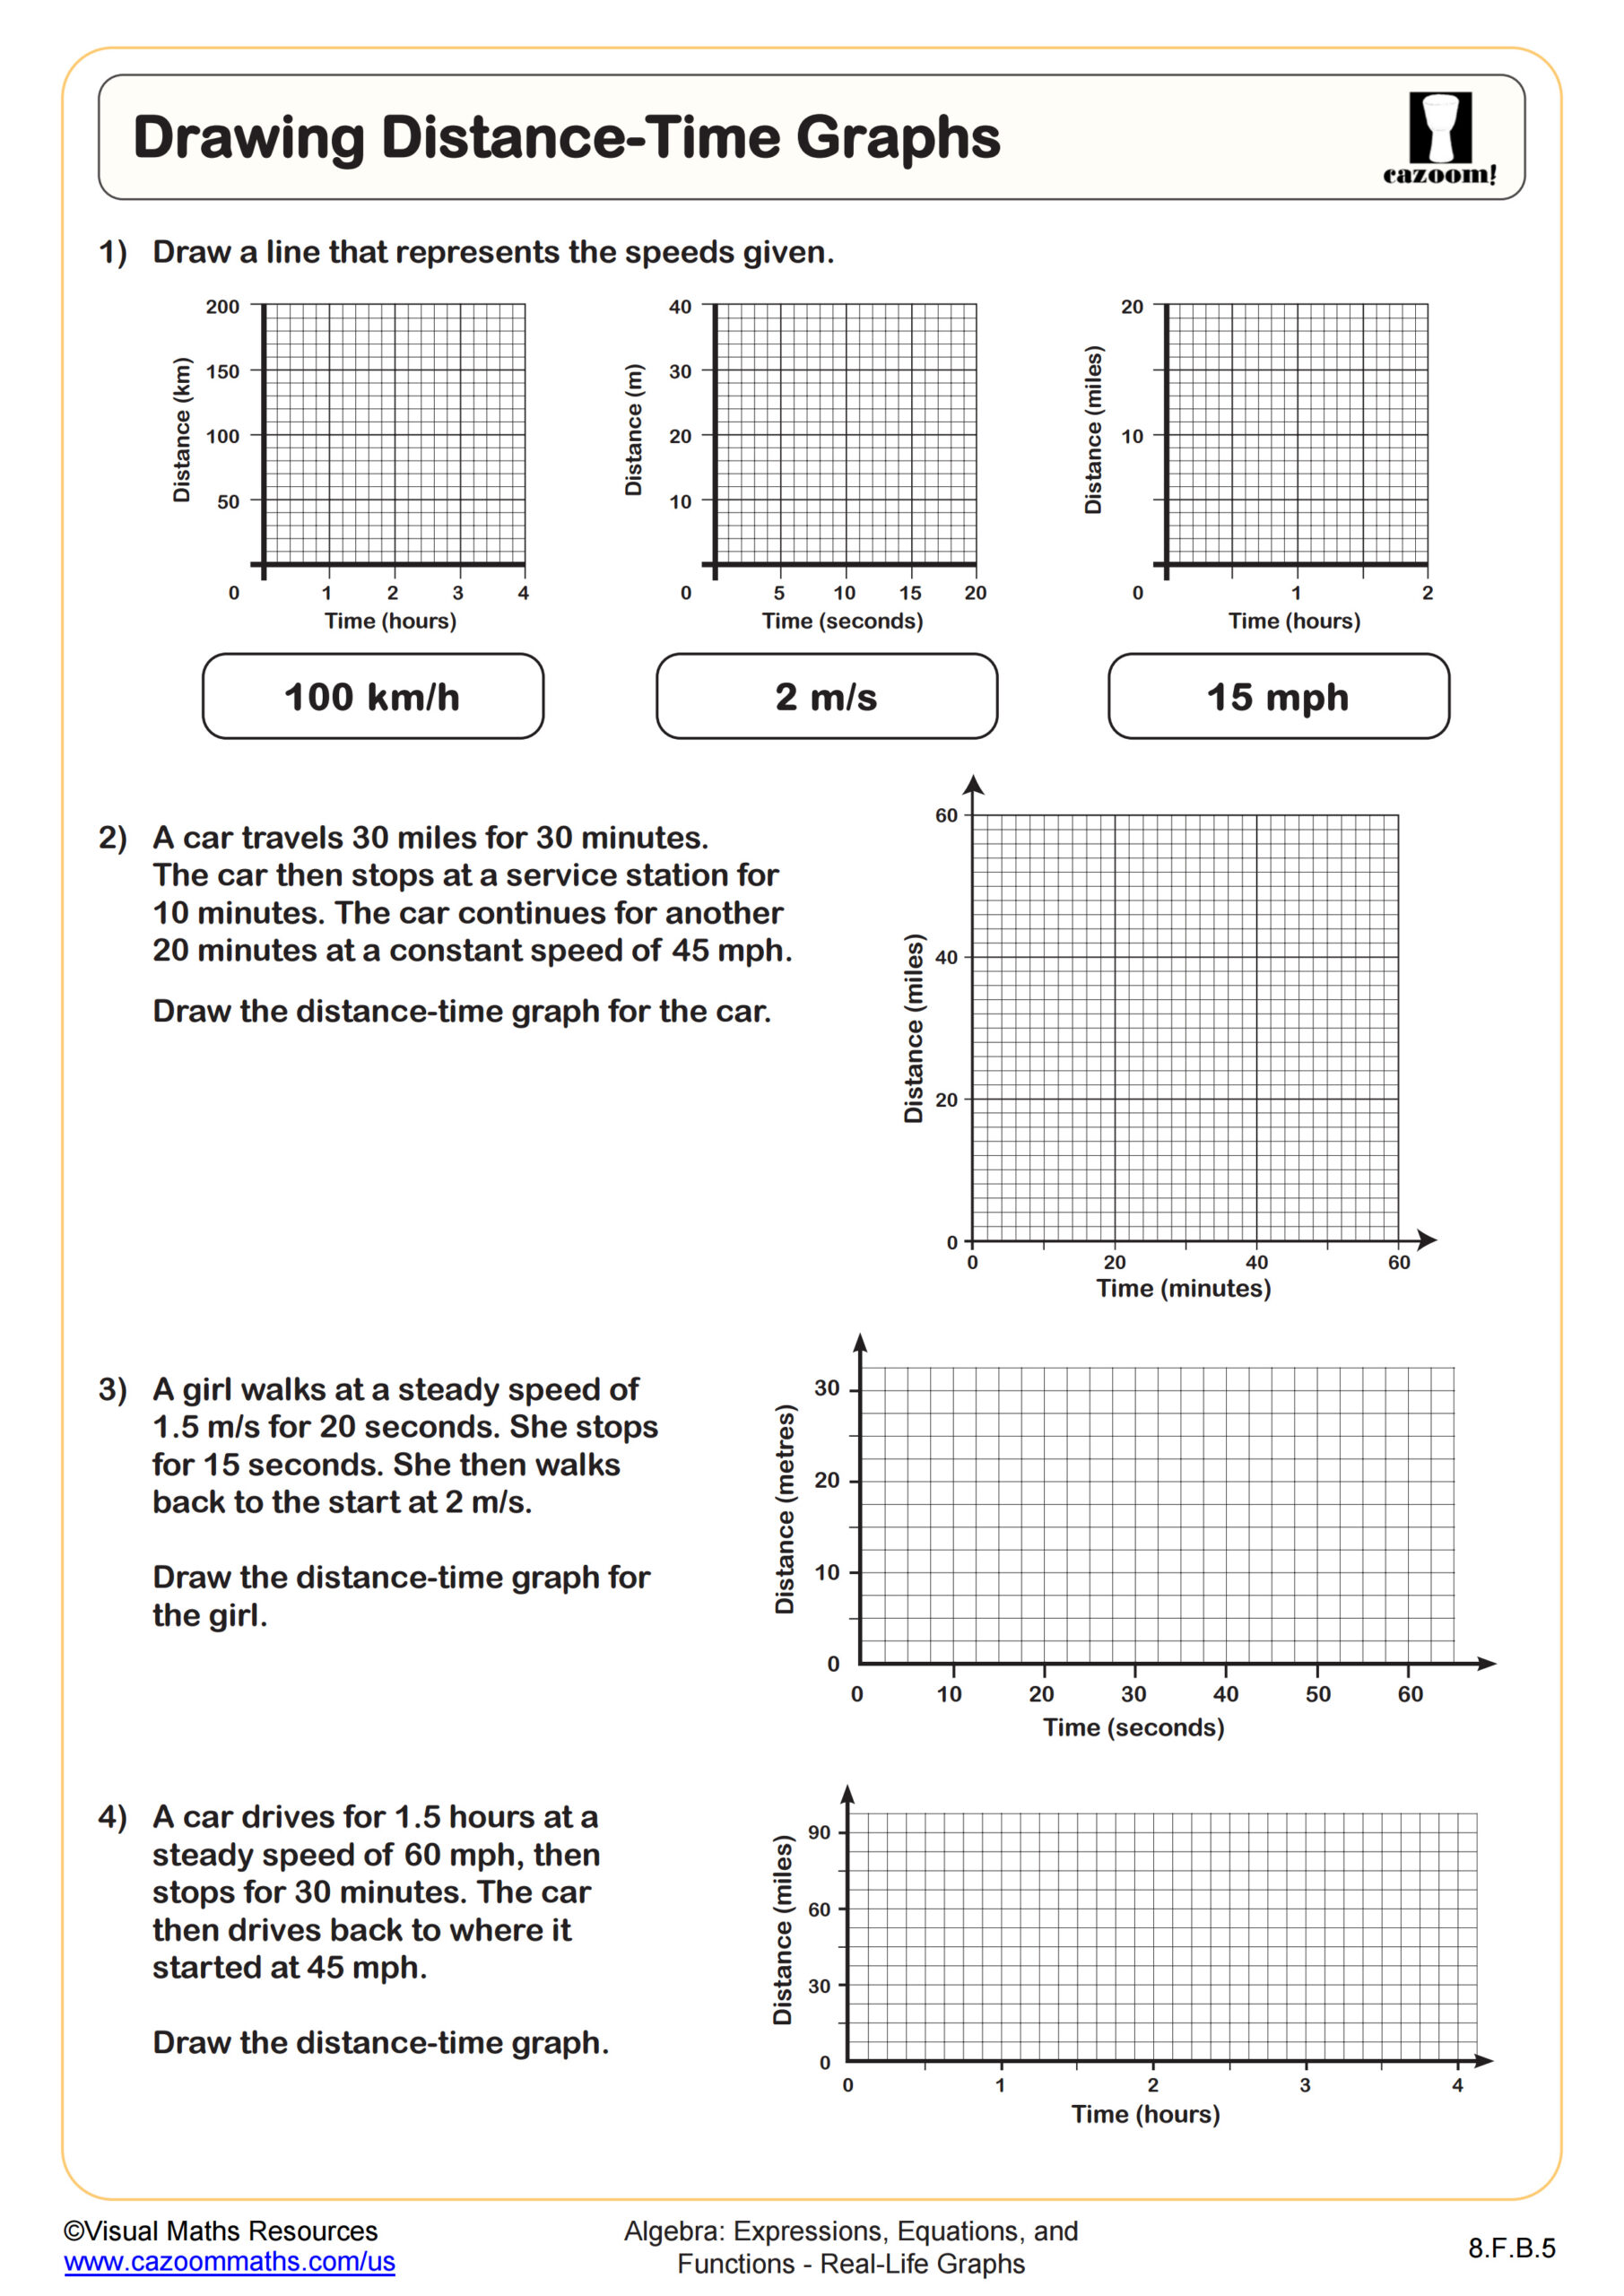
Drawing Distance-Time Graphs
Grades: 8th Grade
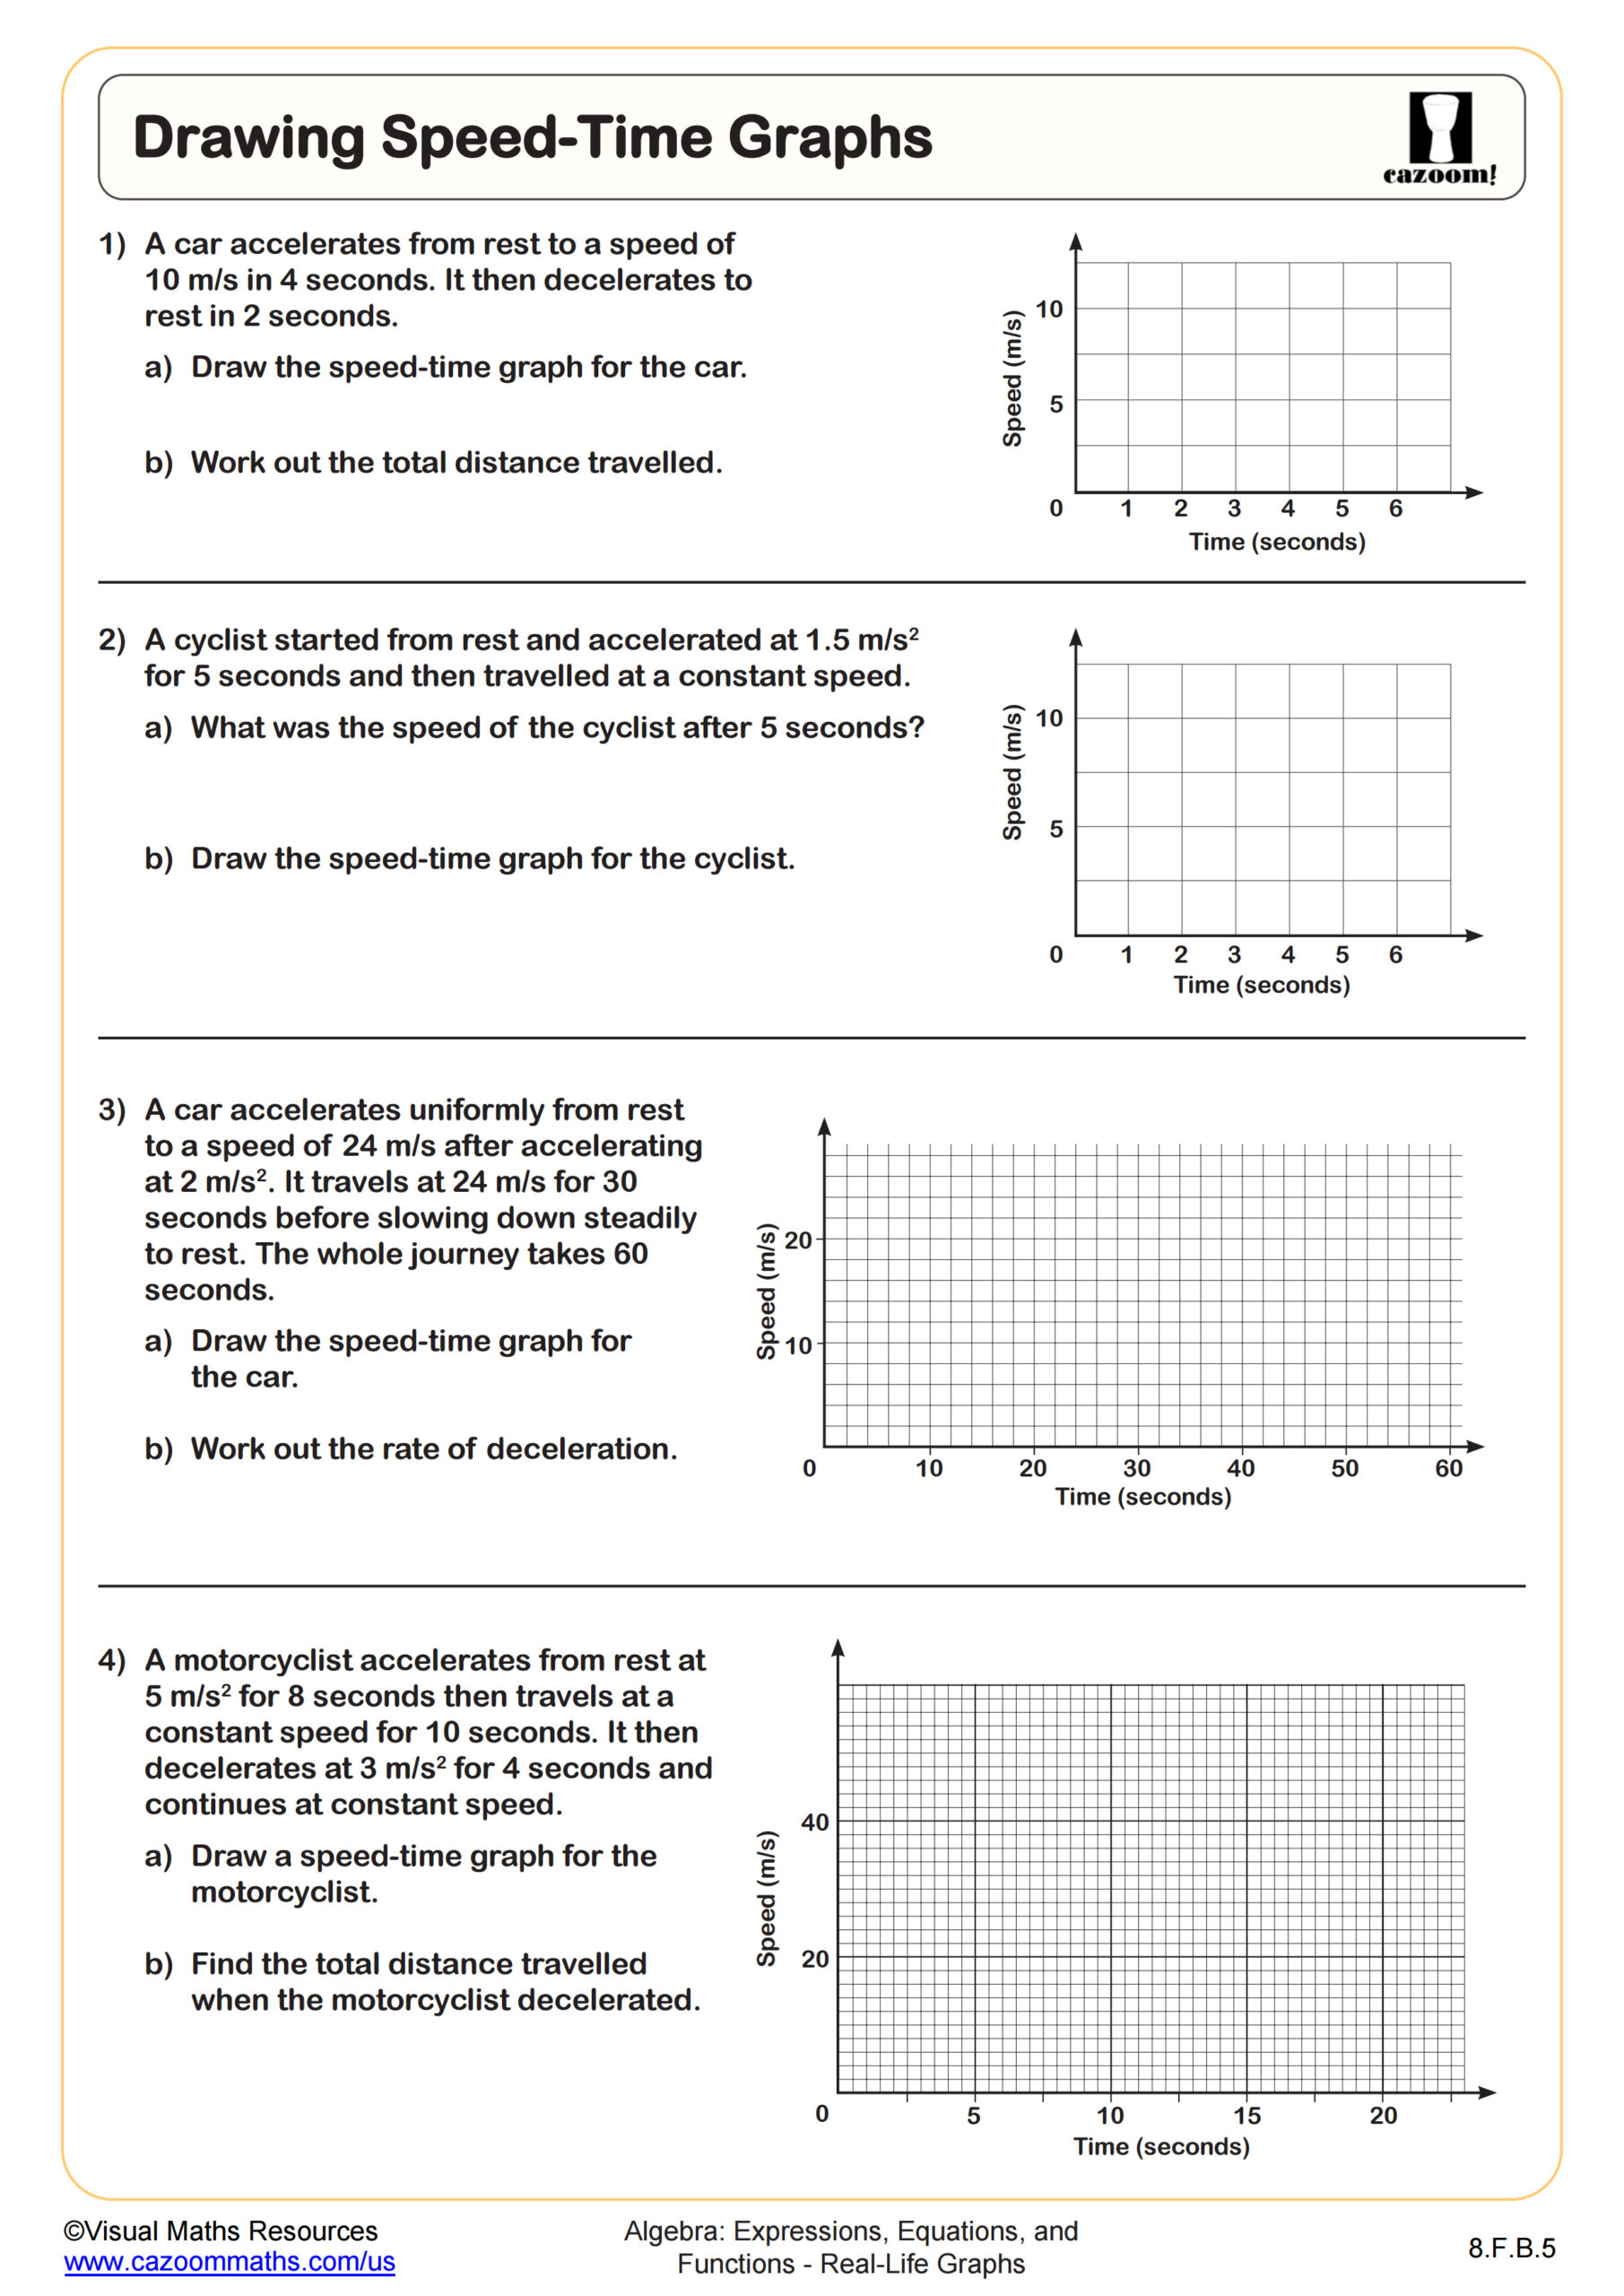
Drawing Speed-Time Graphs
Grades: 8th Grade
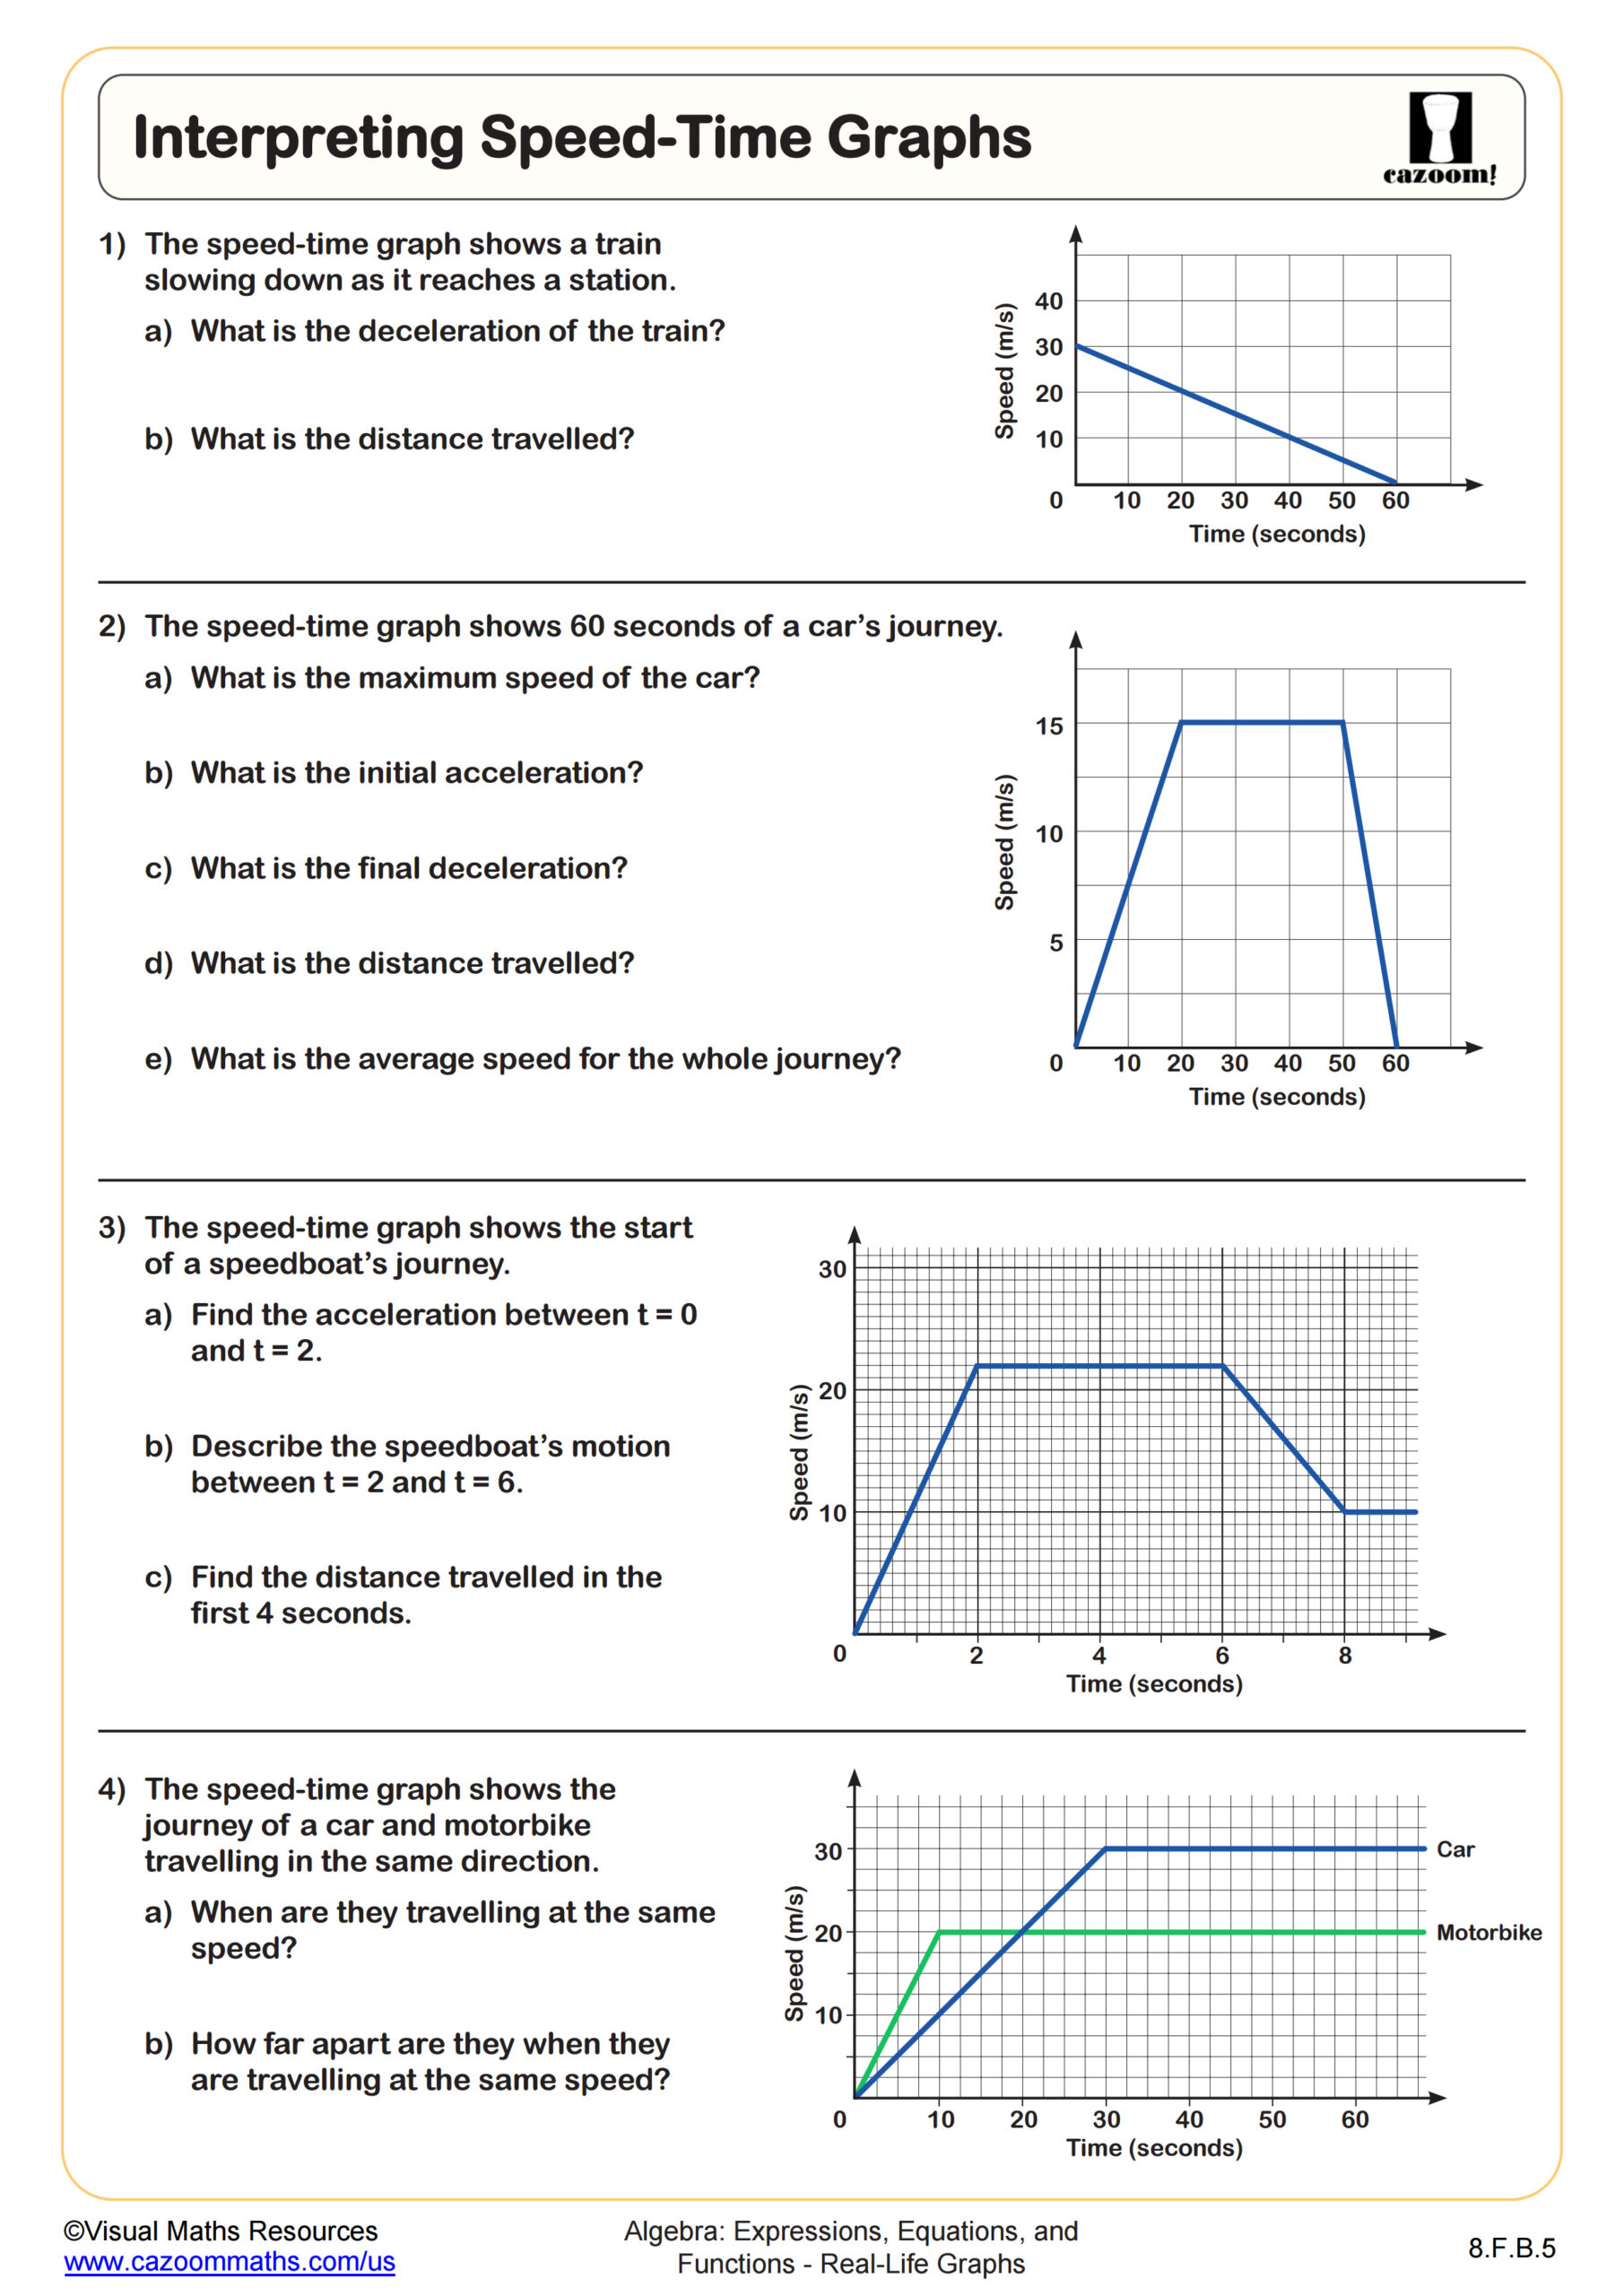
Interpreting Speed-Time Graphs
Grades: 8th Grade
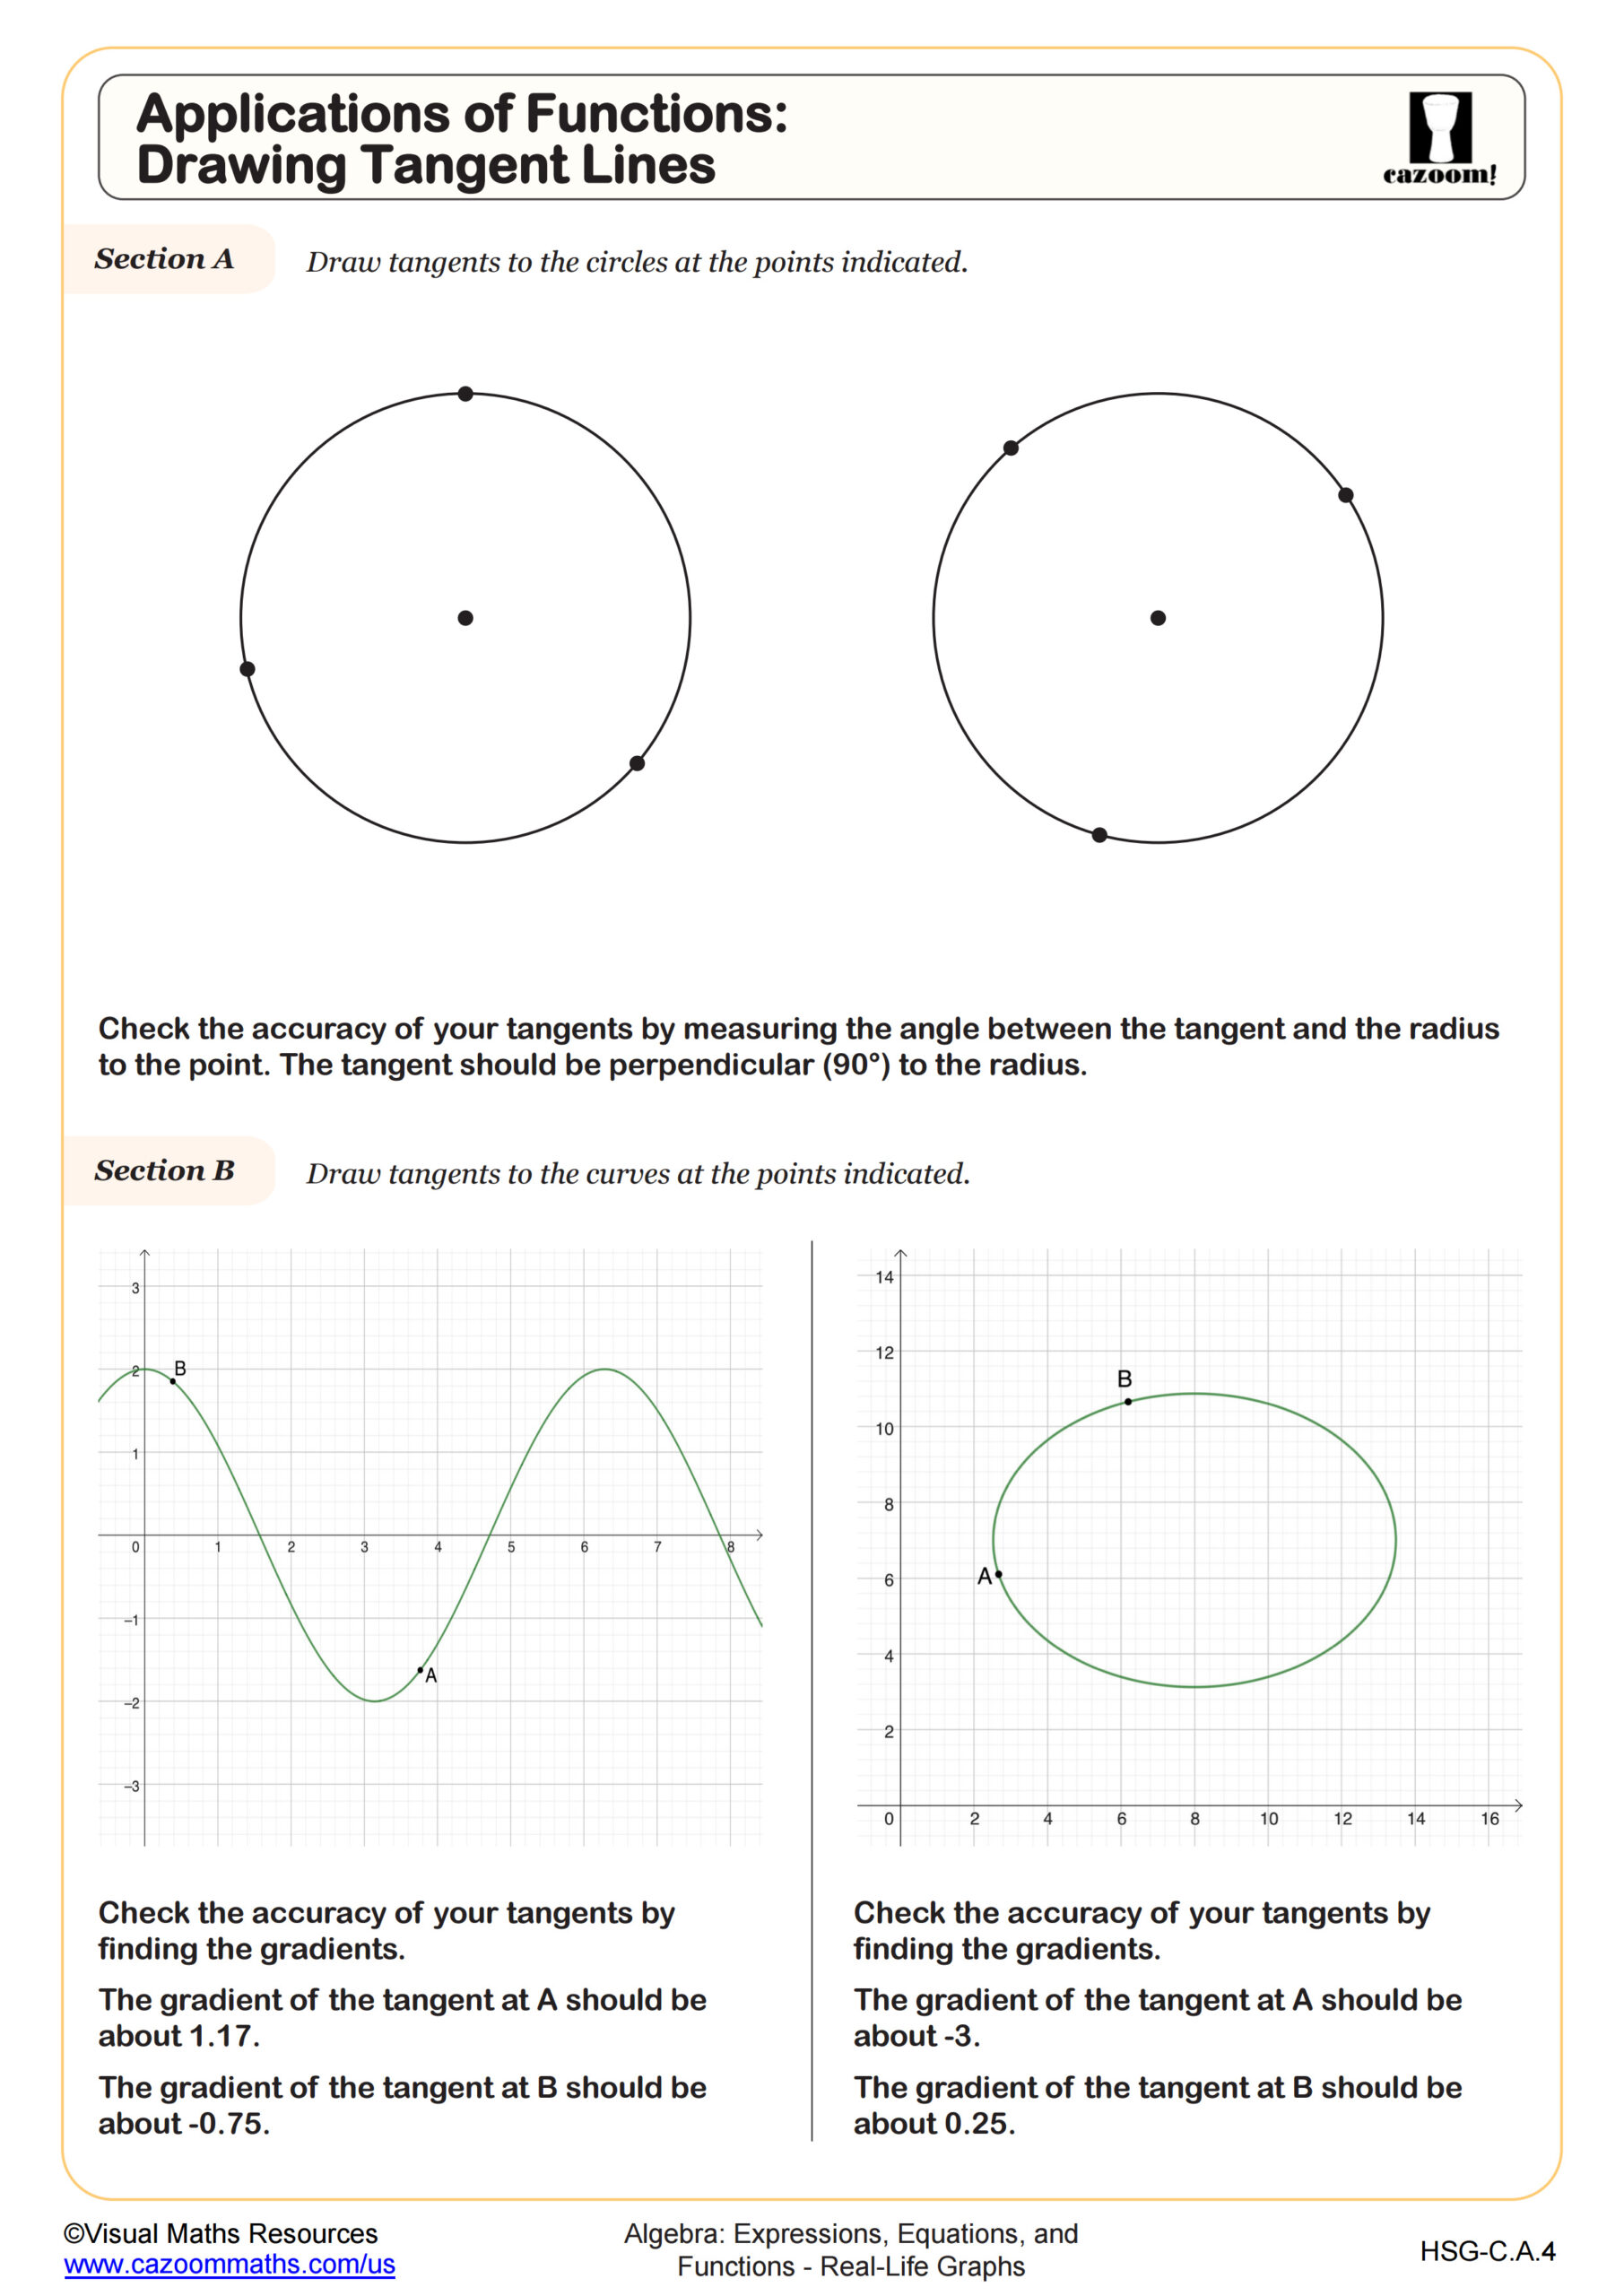
Applications of Functions: Drawing Tangent Lines
Grades: Algebra I, IM 1
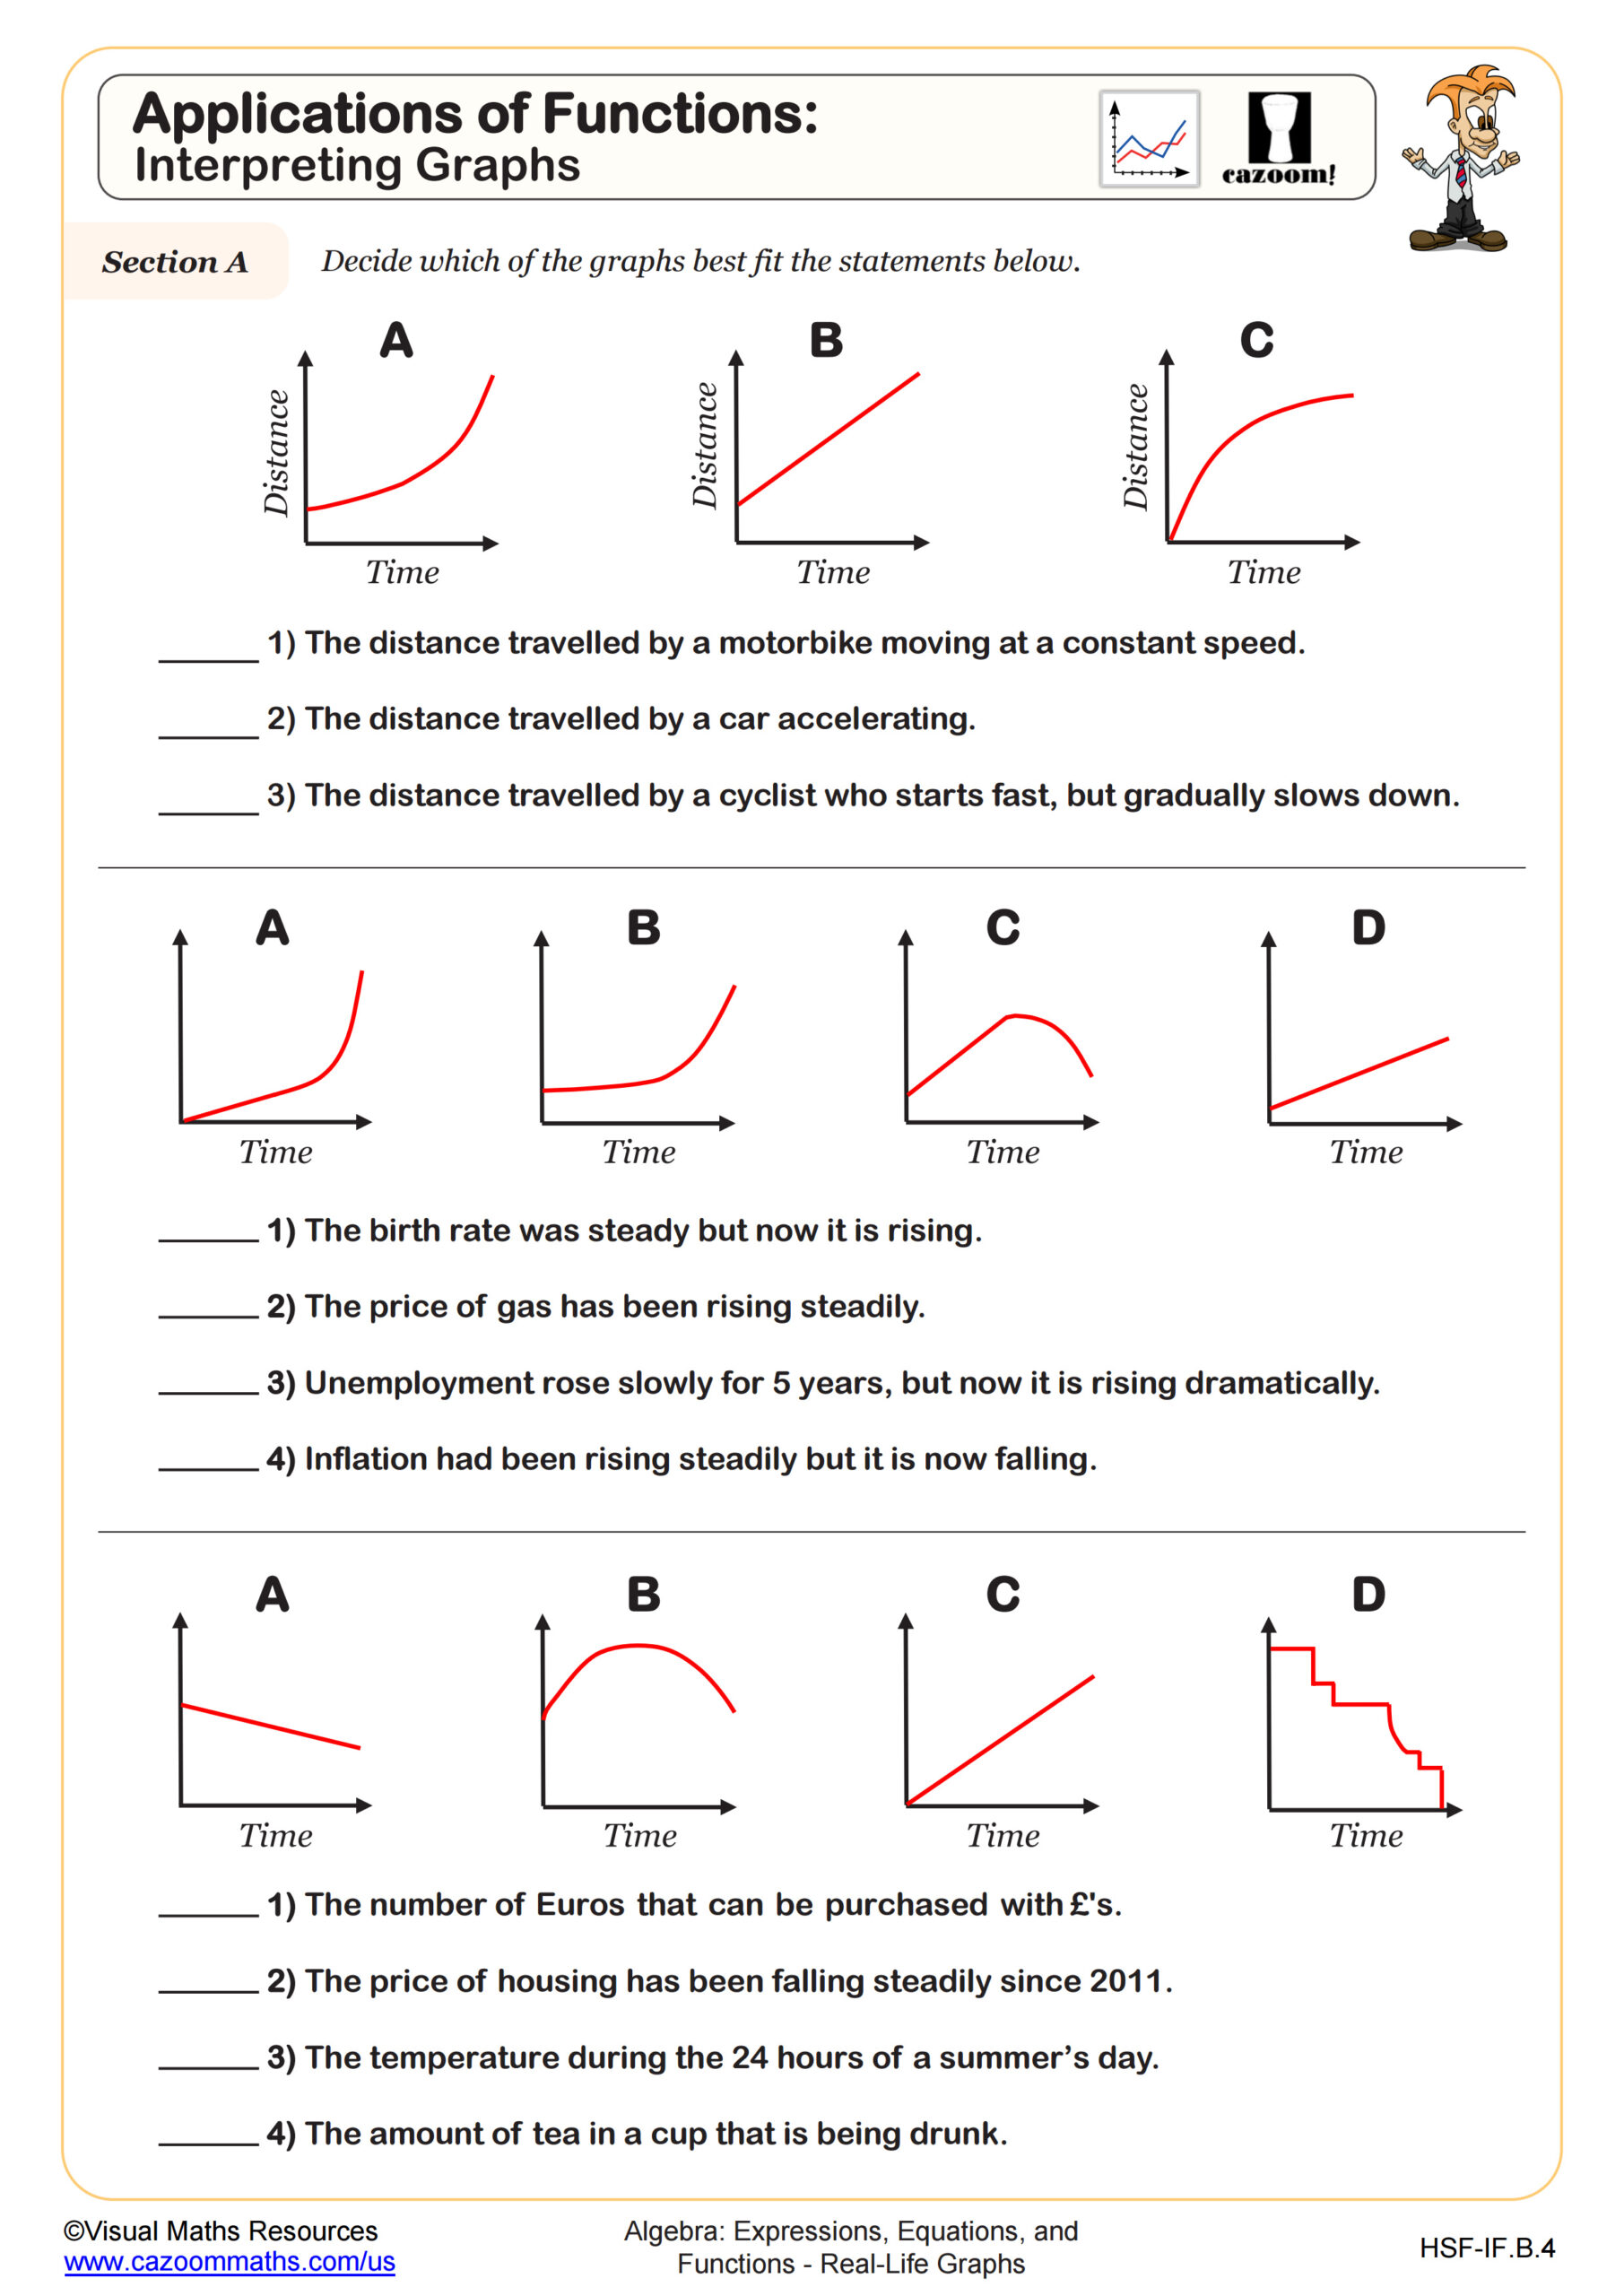
Applications of Functions: Interpreting Graphs
Grades: Algebra I, IM 1
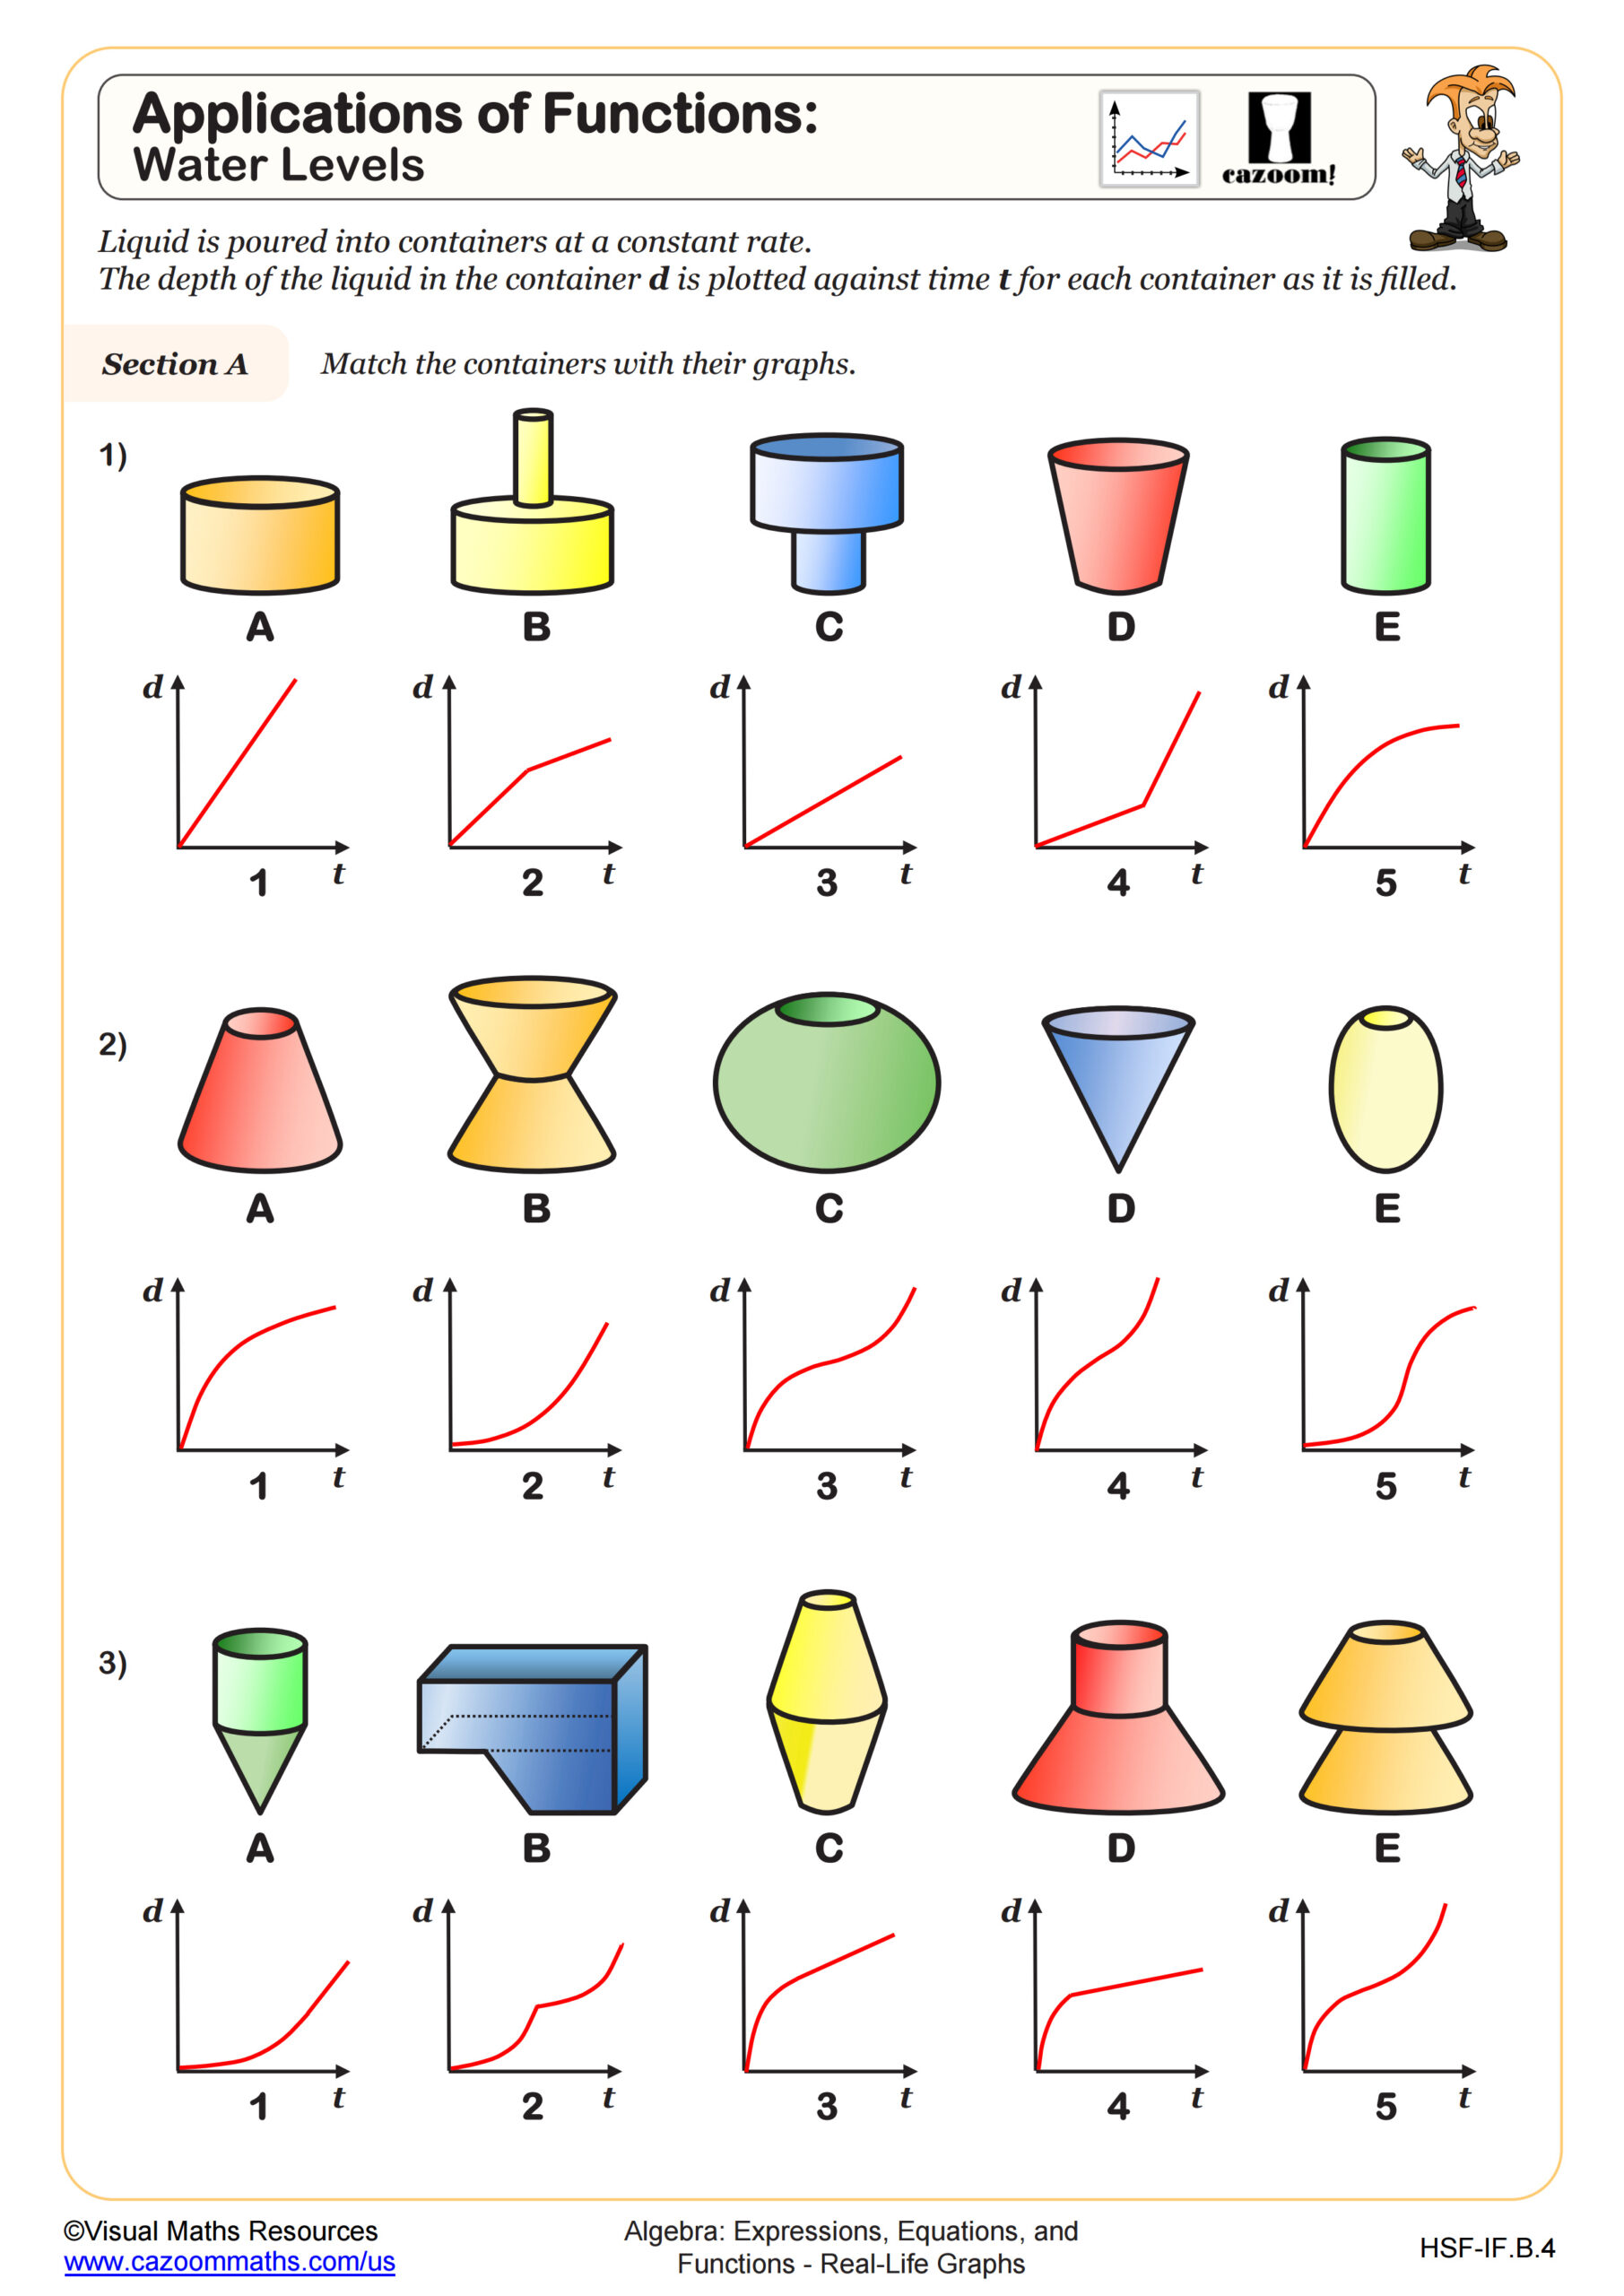
Applications of Functions: Water Levels
Grades: Algebra I, IM 1
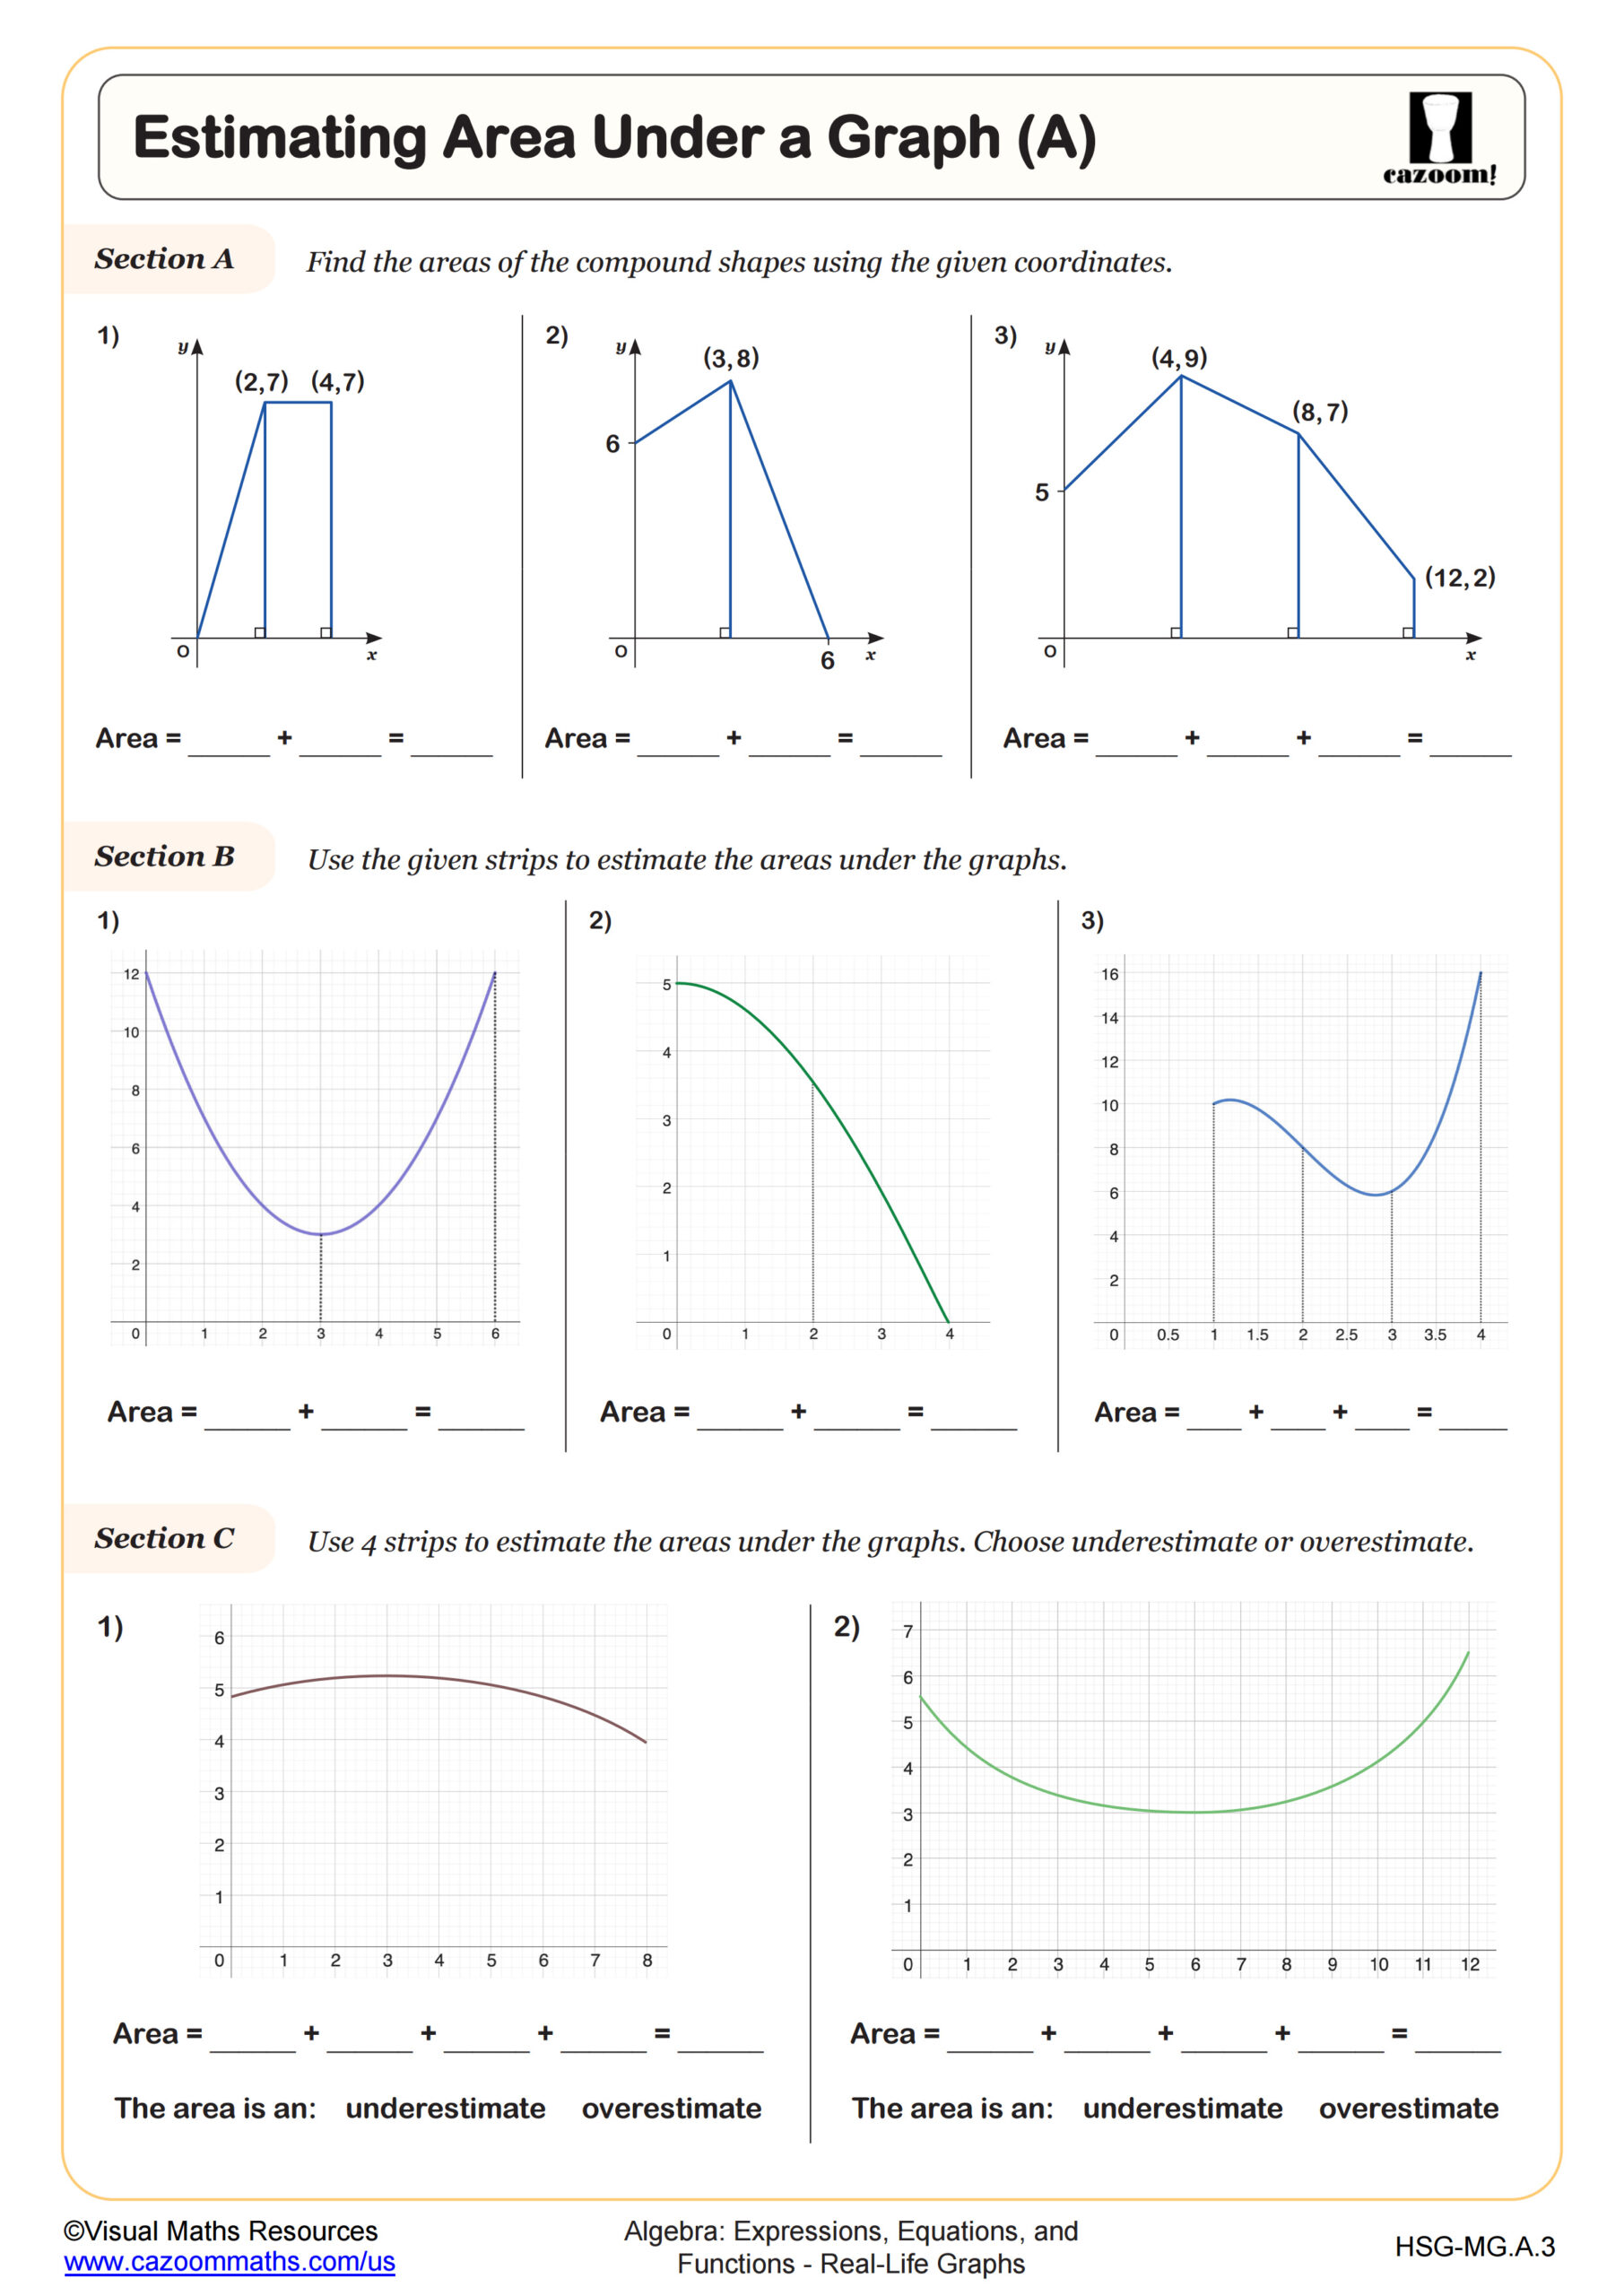
Estimating Area Under a Graph (A)
Grades: Algebra I, IM 1
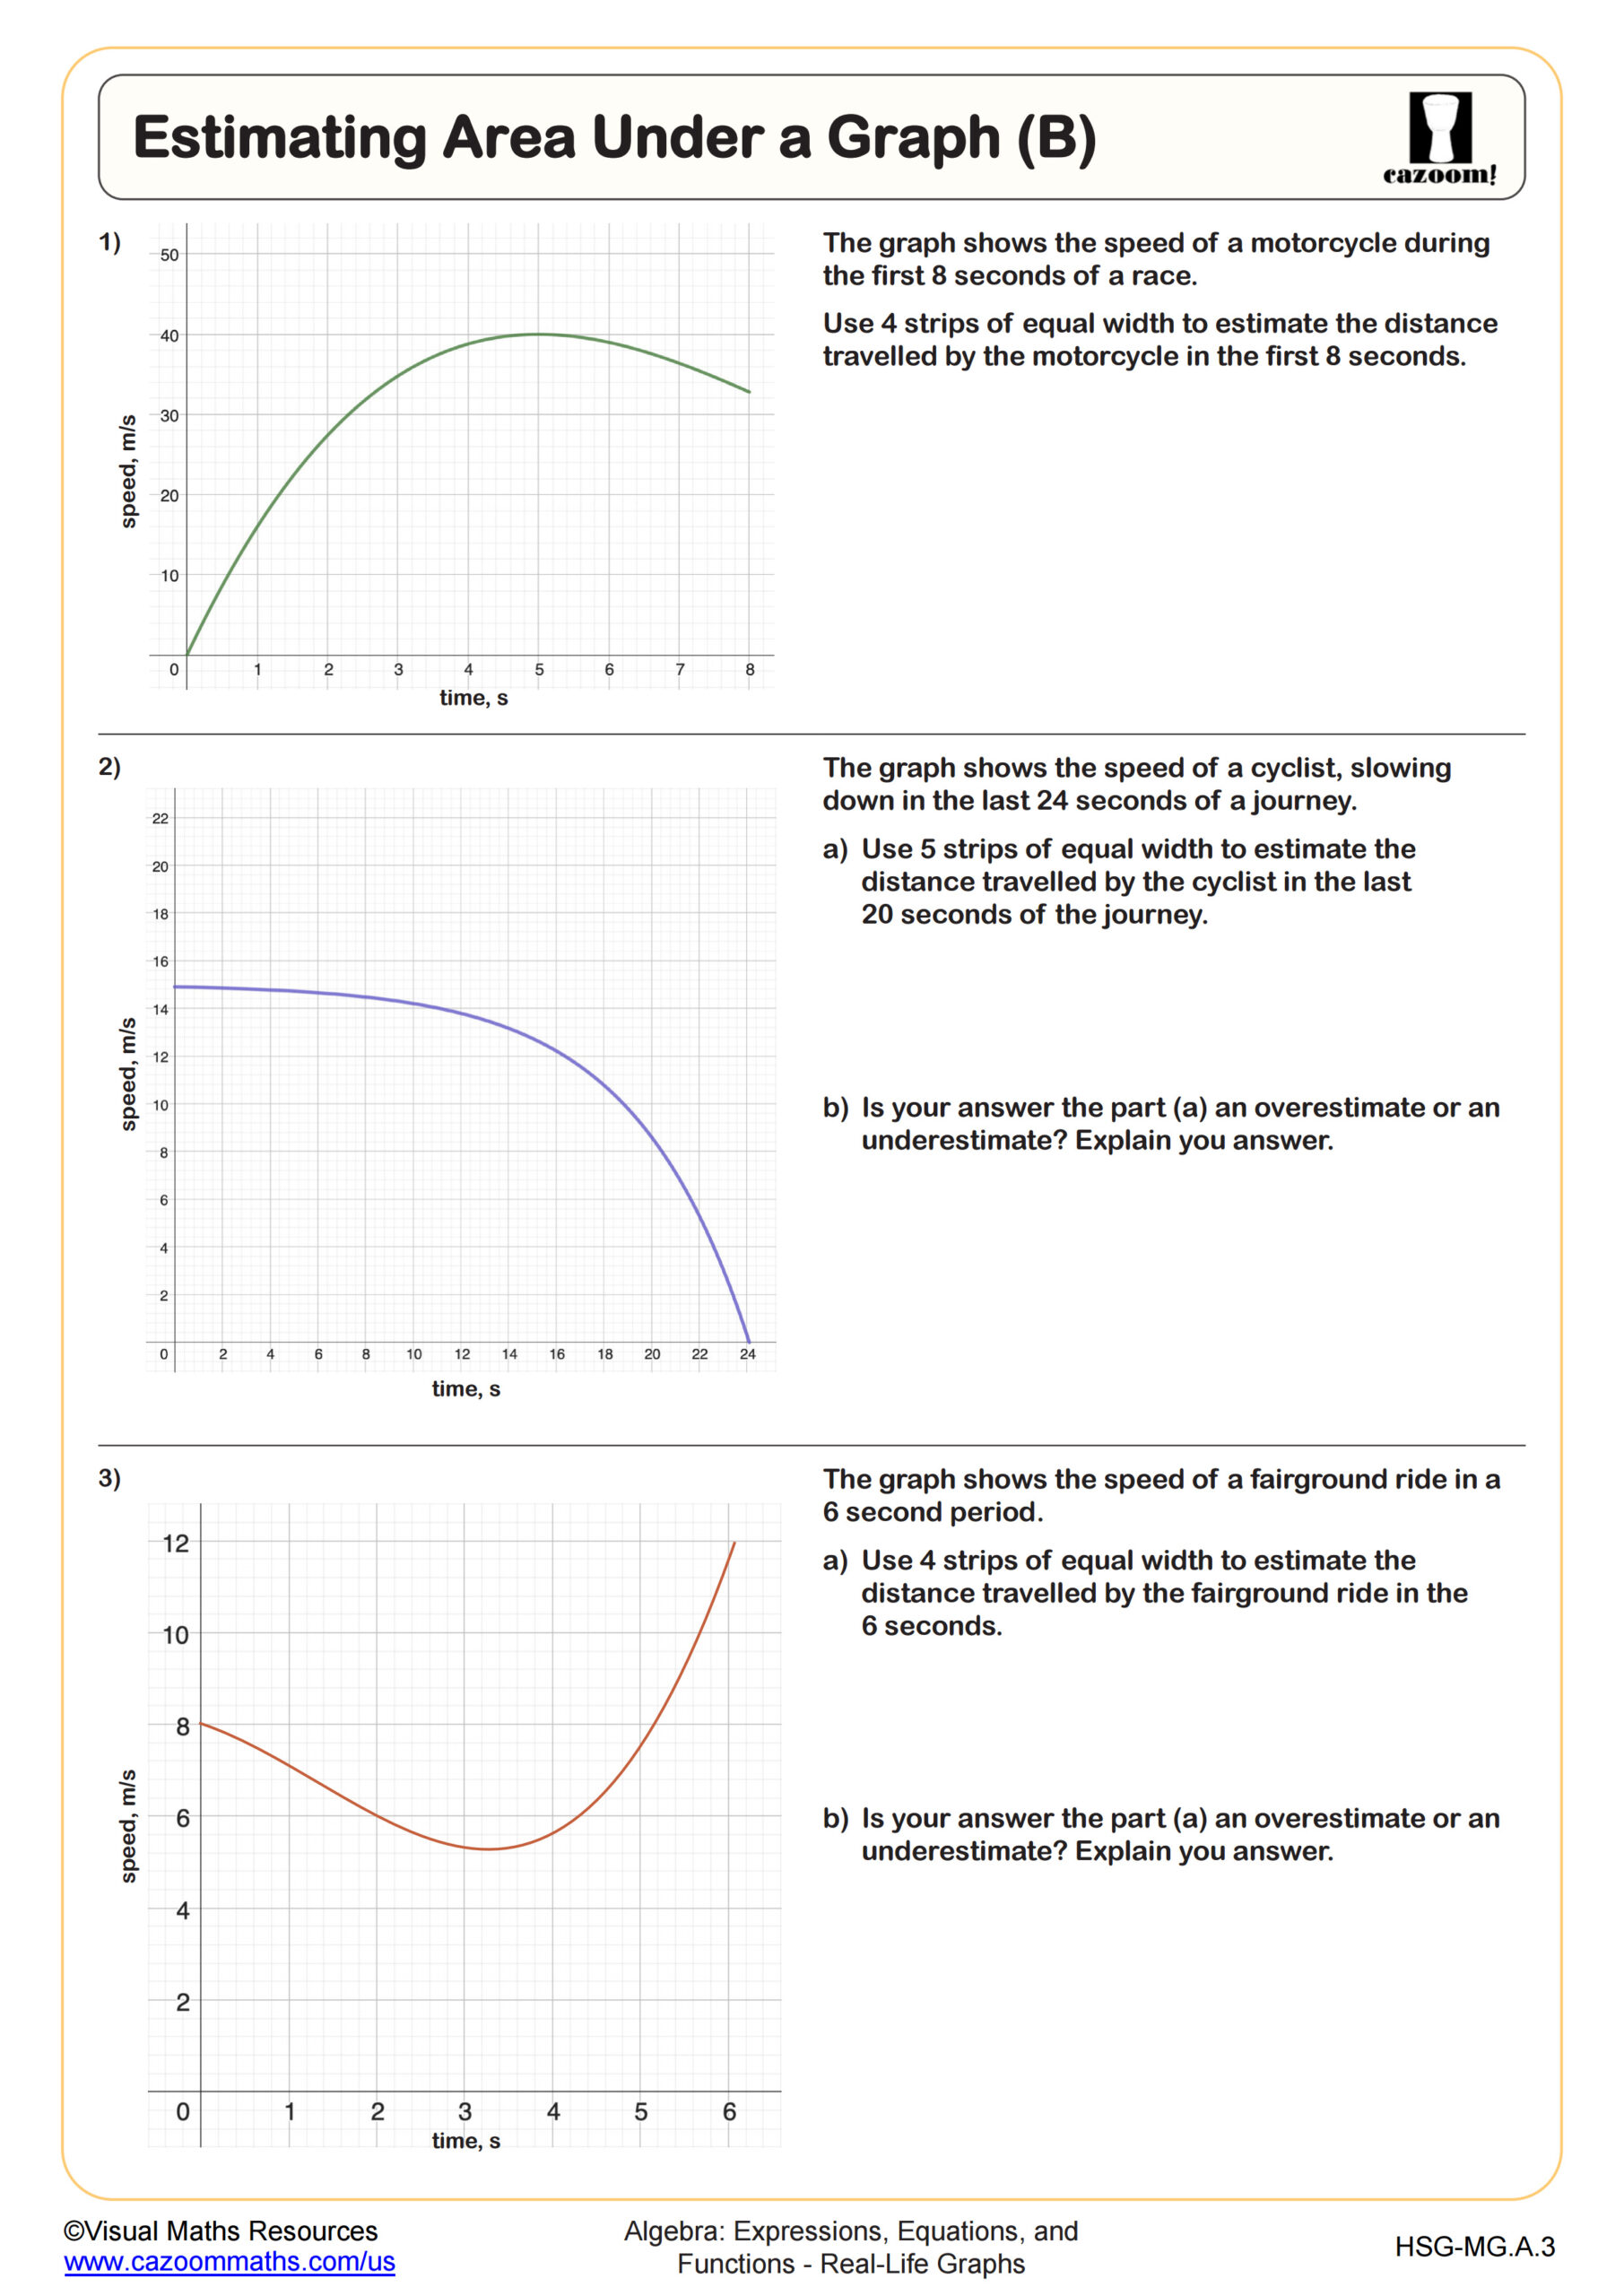
Estimating Area Under a Graph (B)
Grades: Algebra I, IM 1
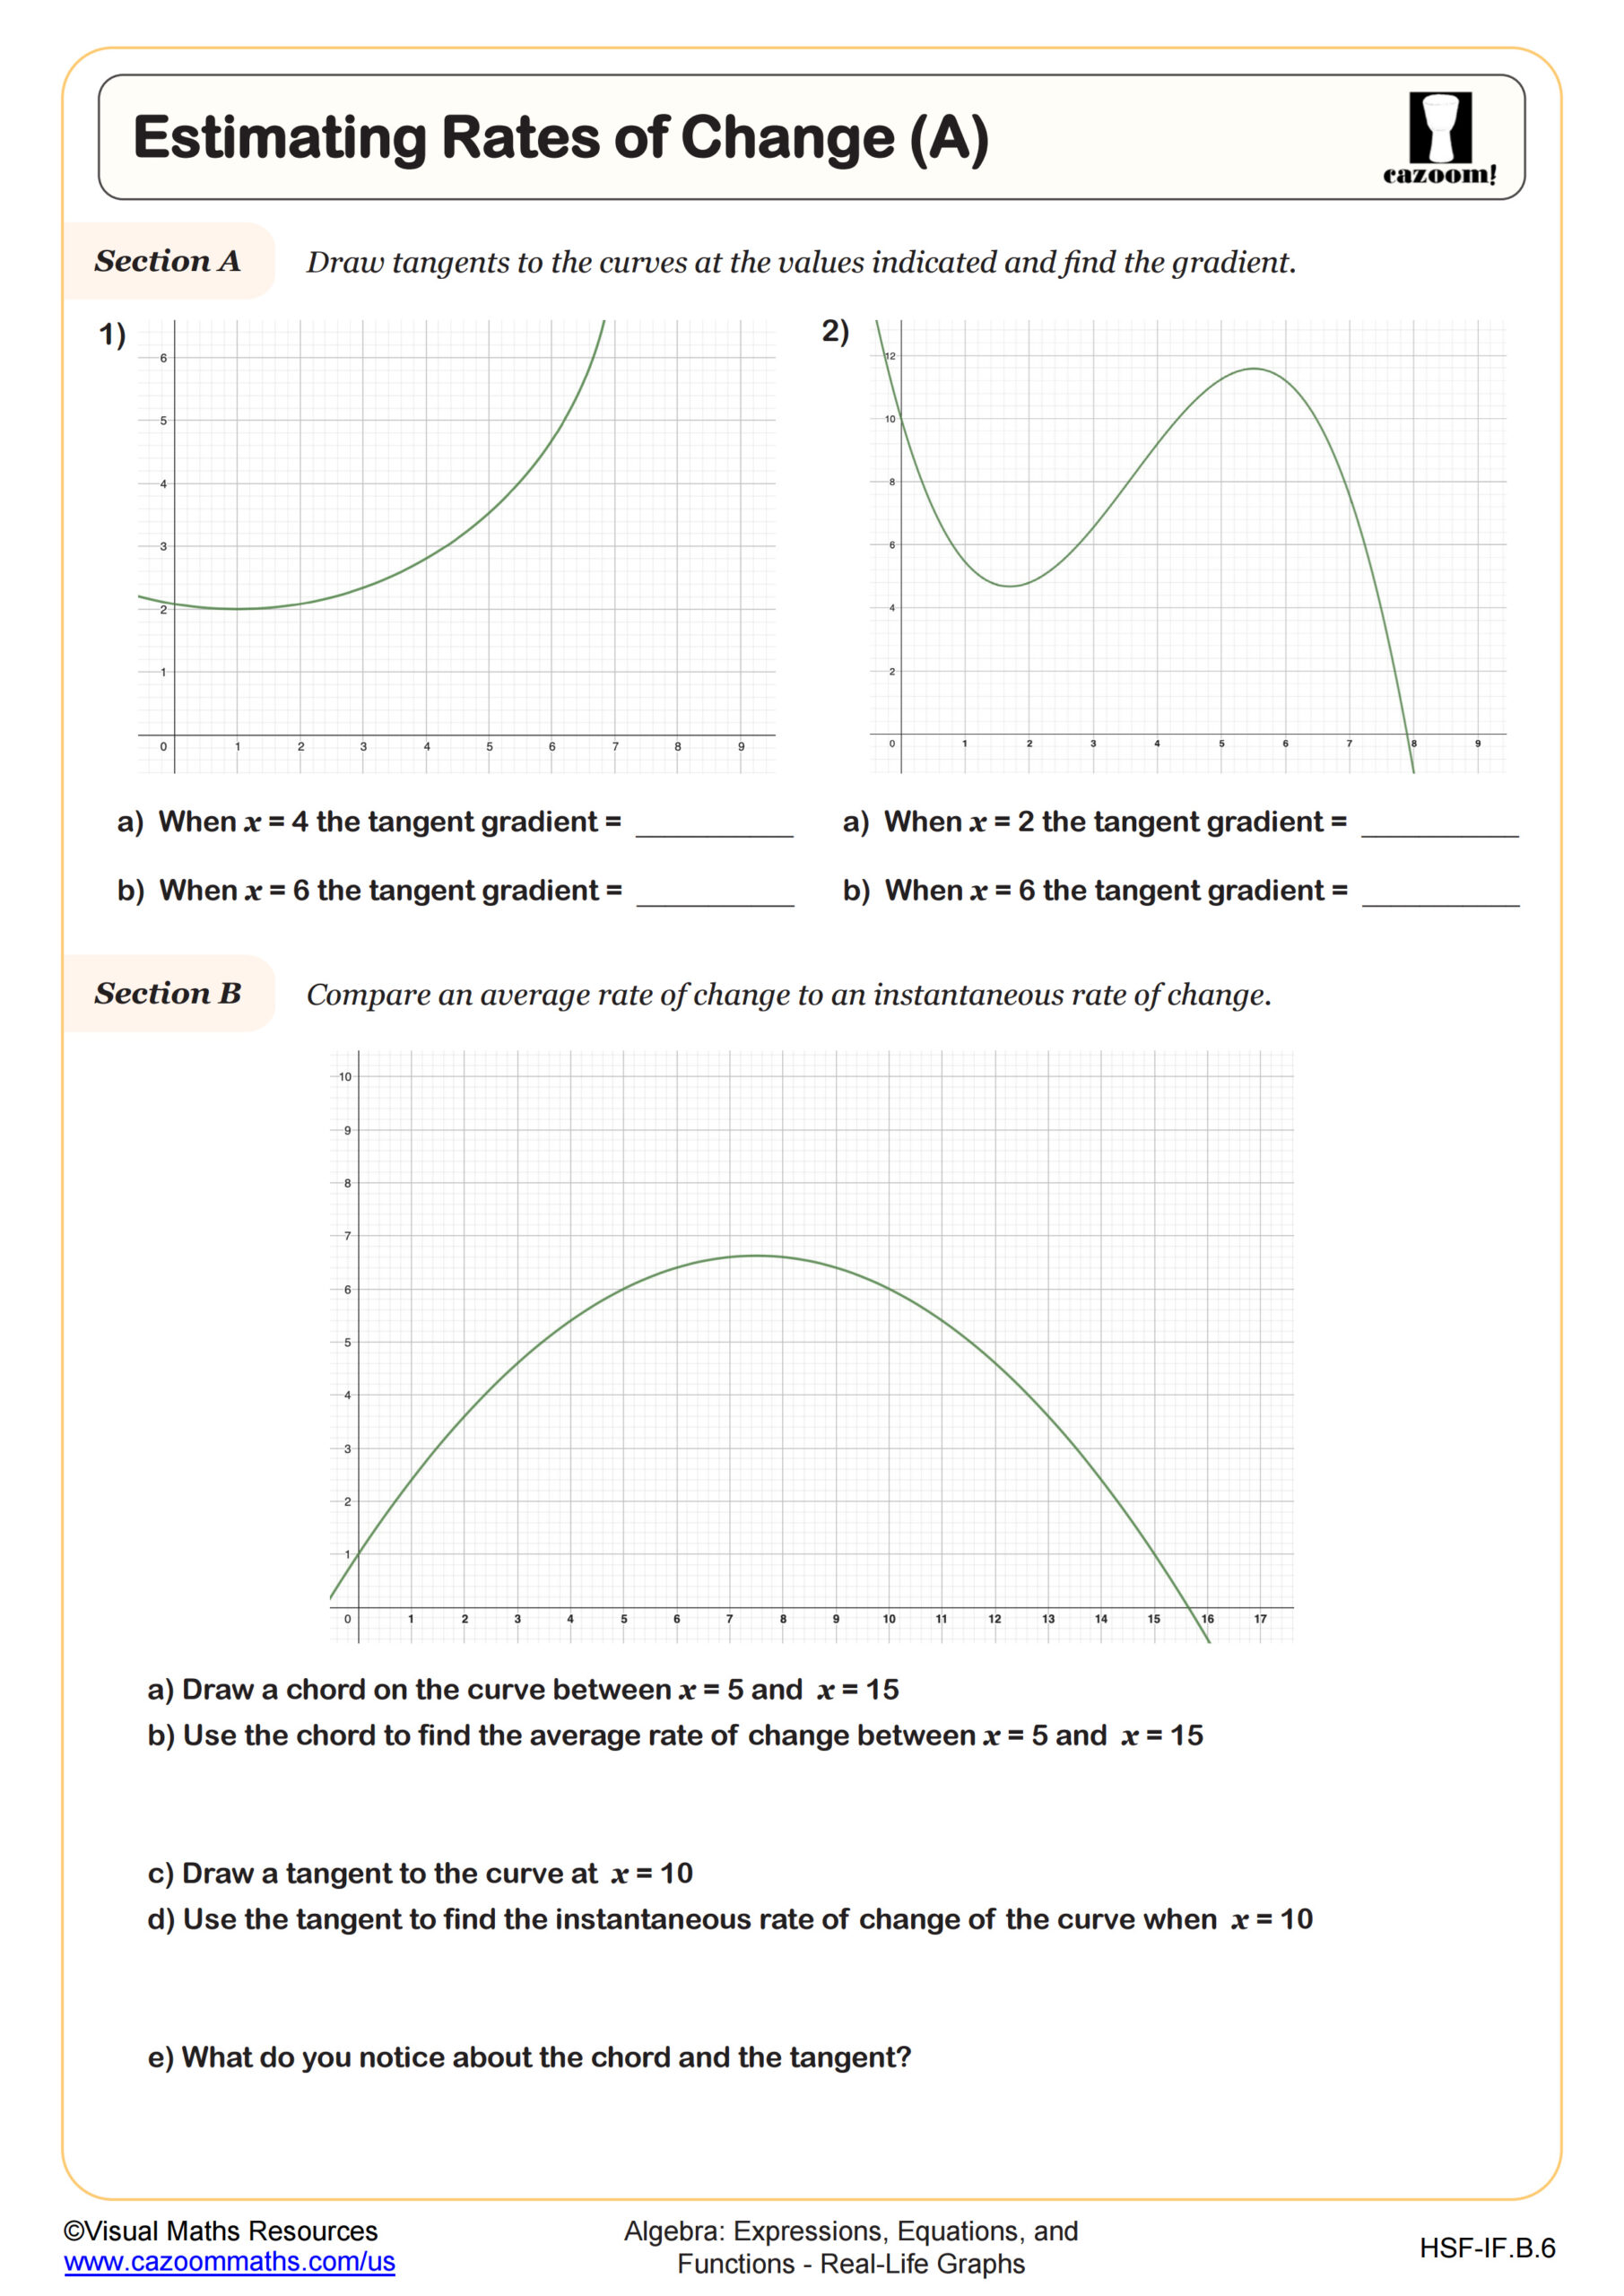
Estimating Rates of Change (A)
Grades: Algebra I, IM 1
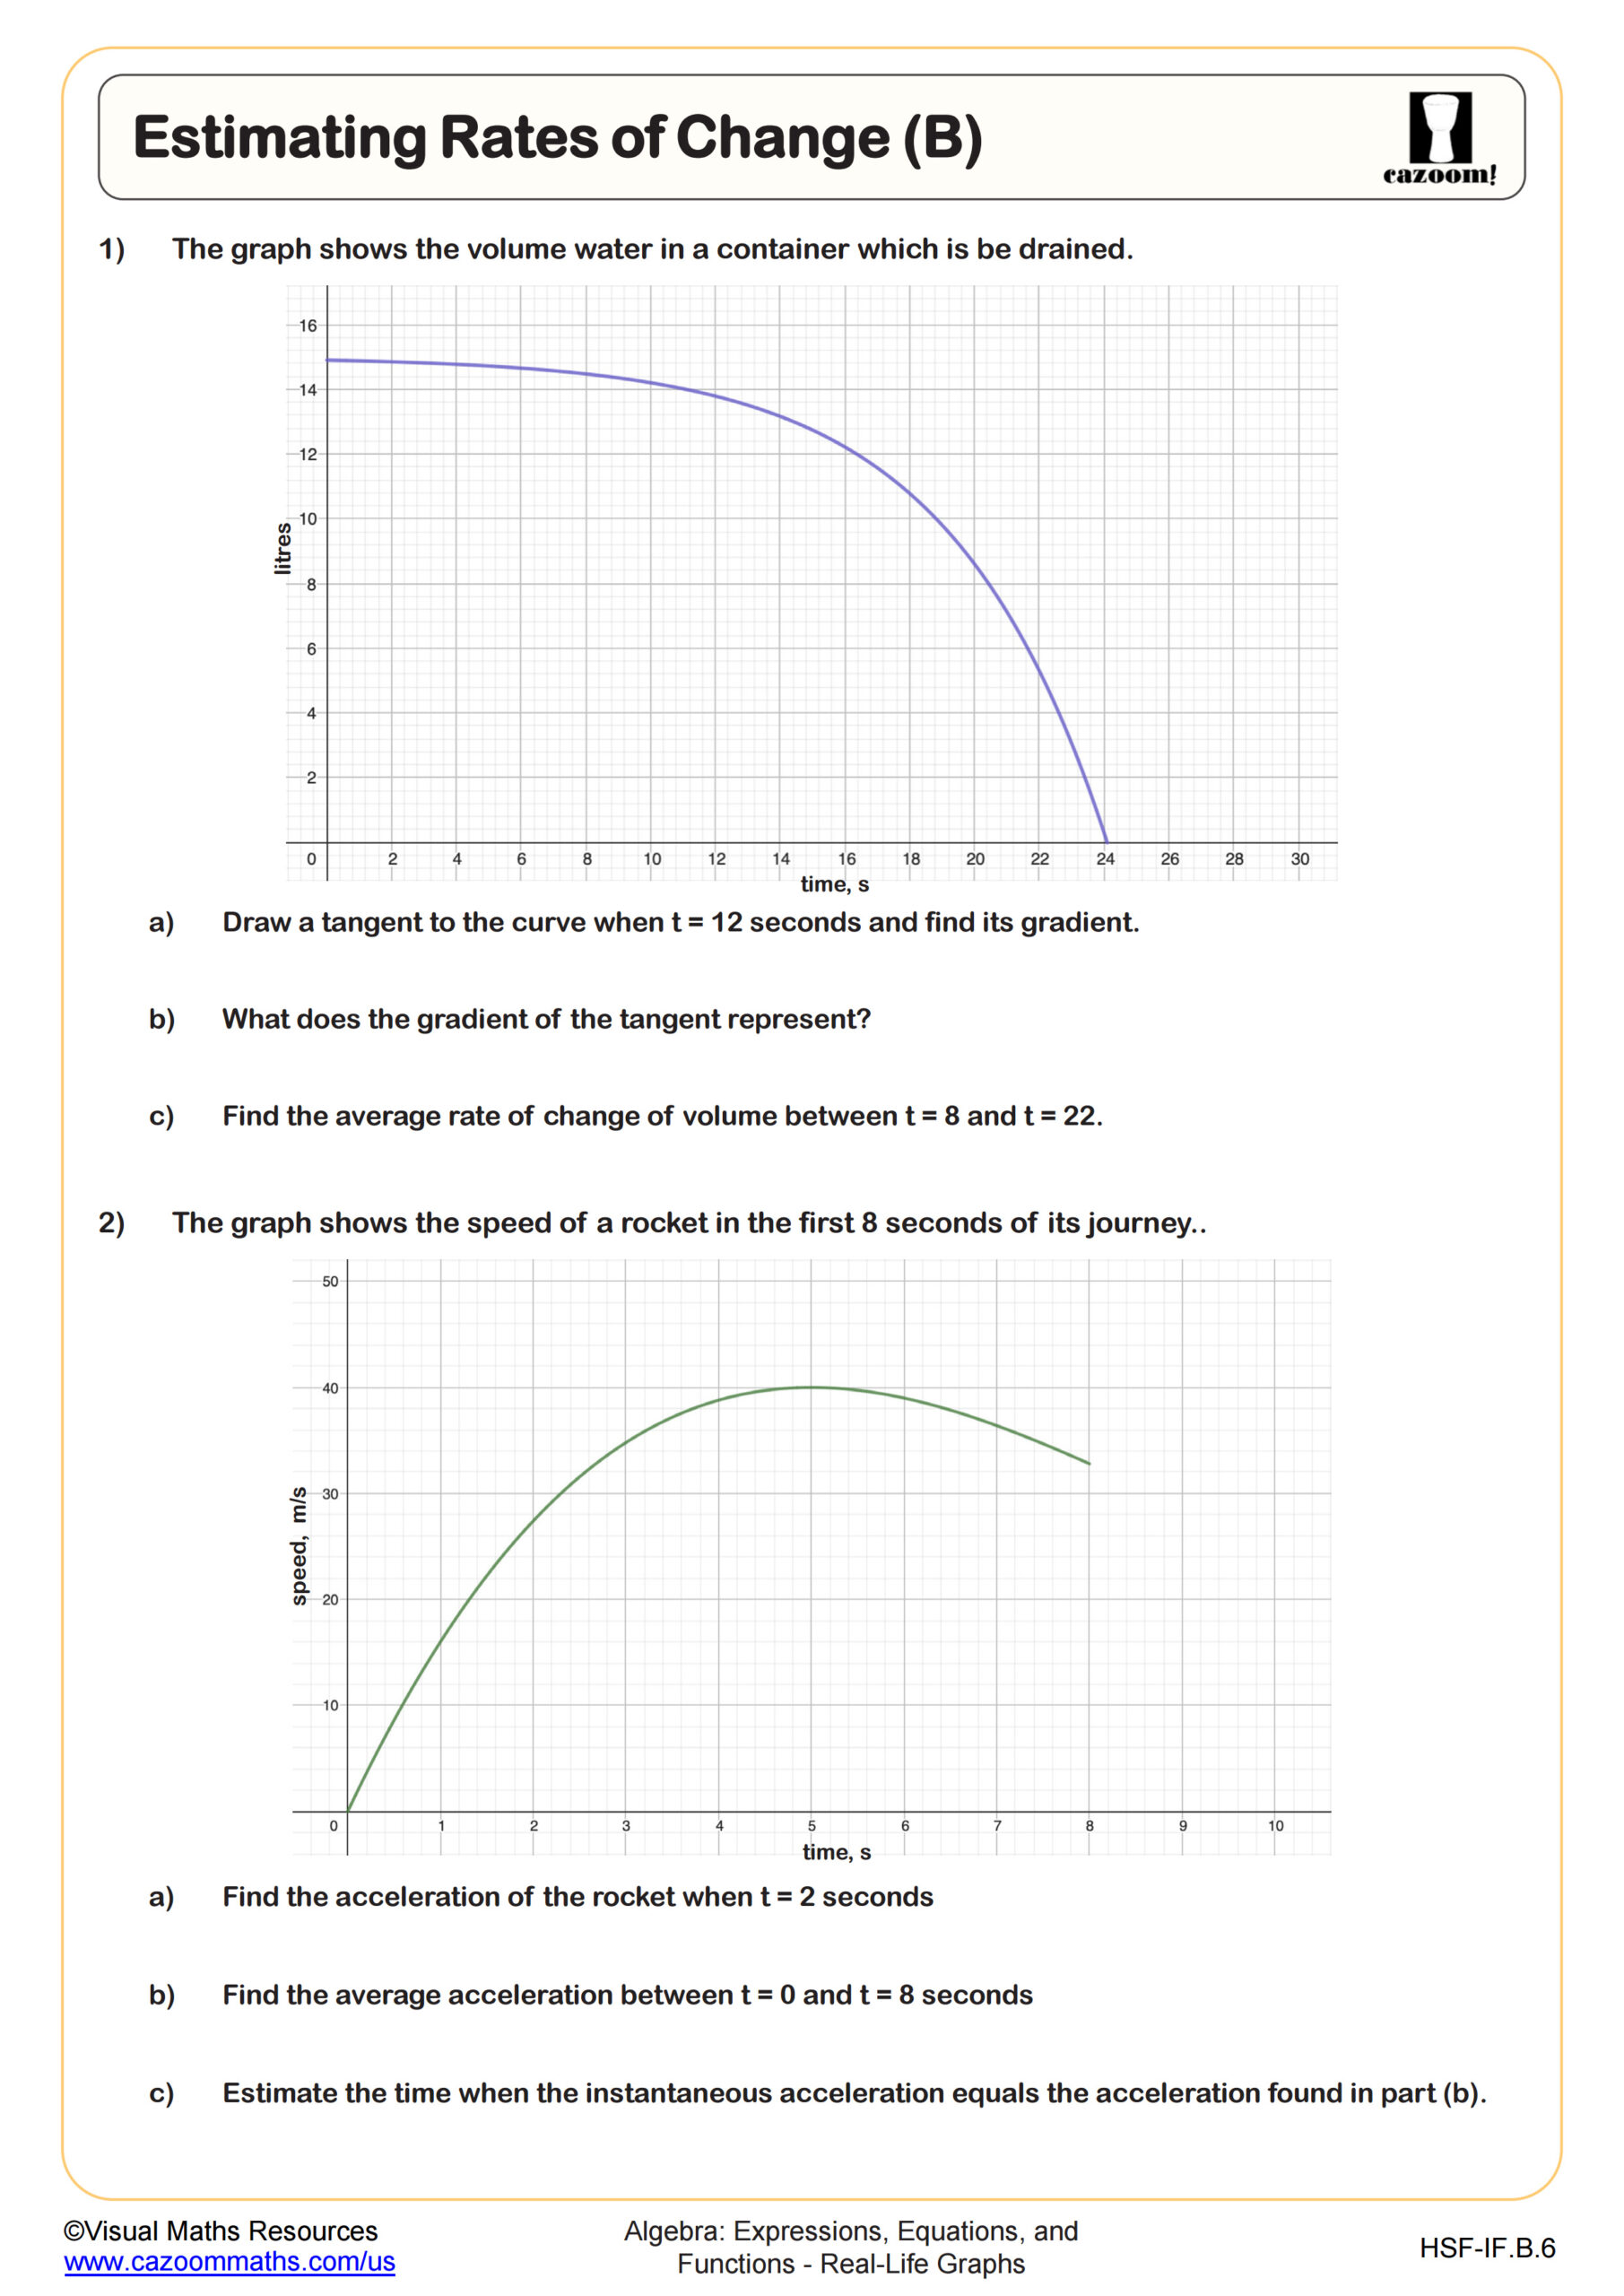
Estimating Rates of Change (B)
Grades: Algebra I, IM 1
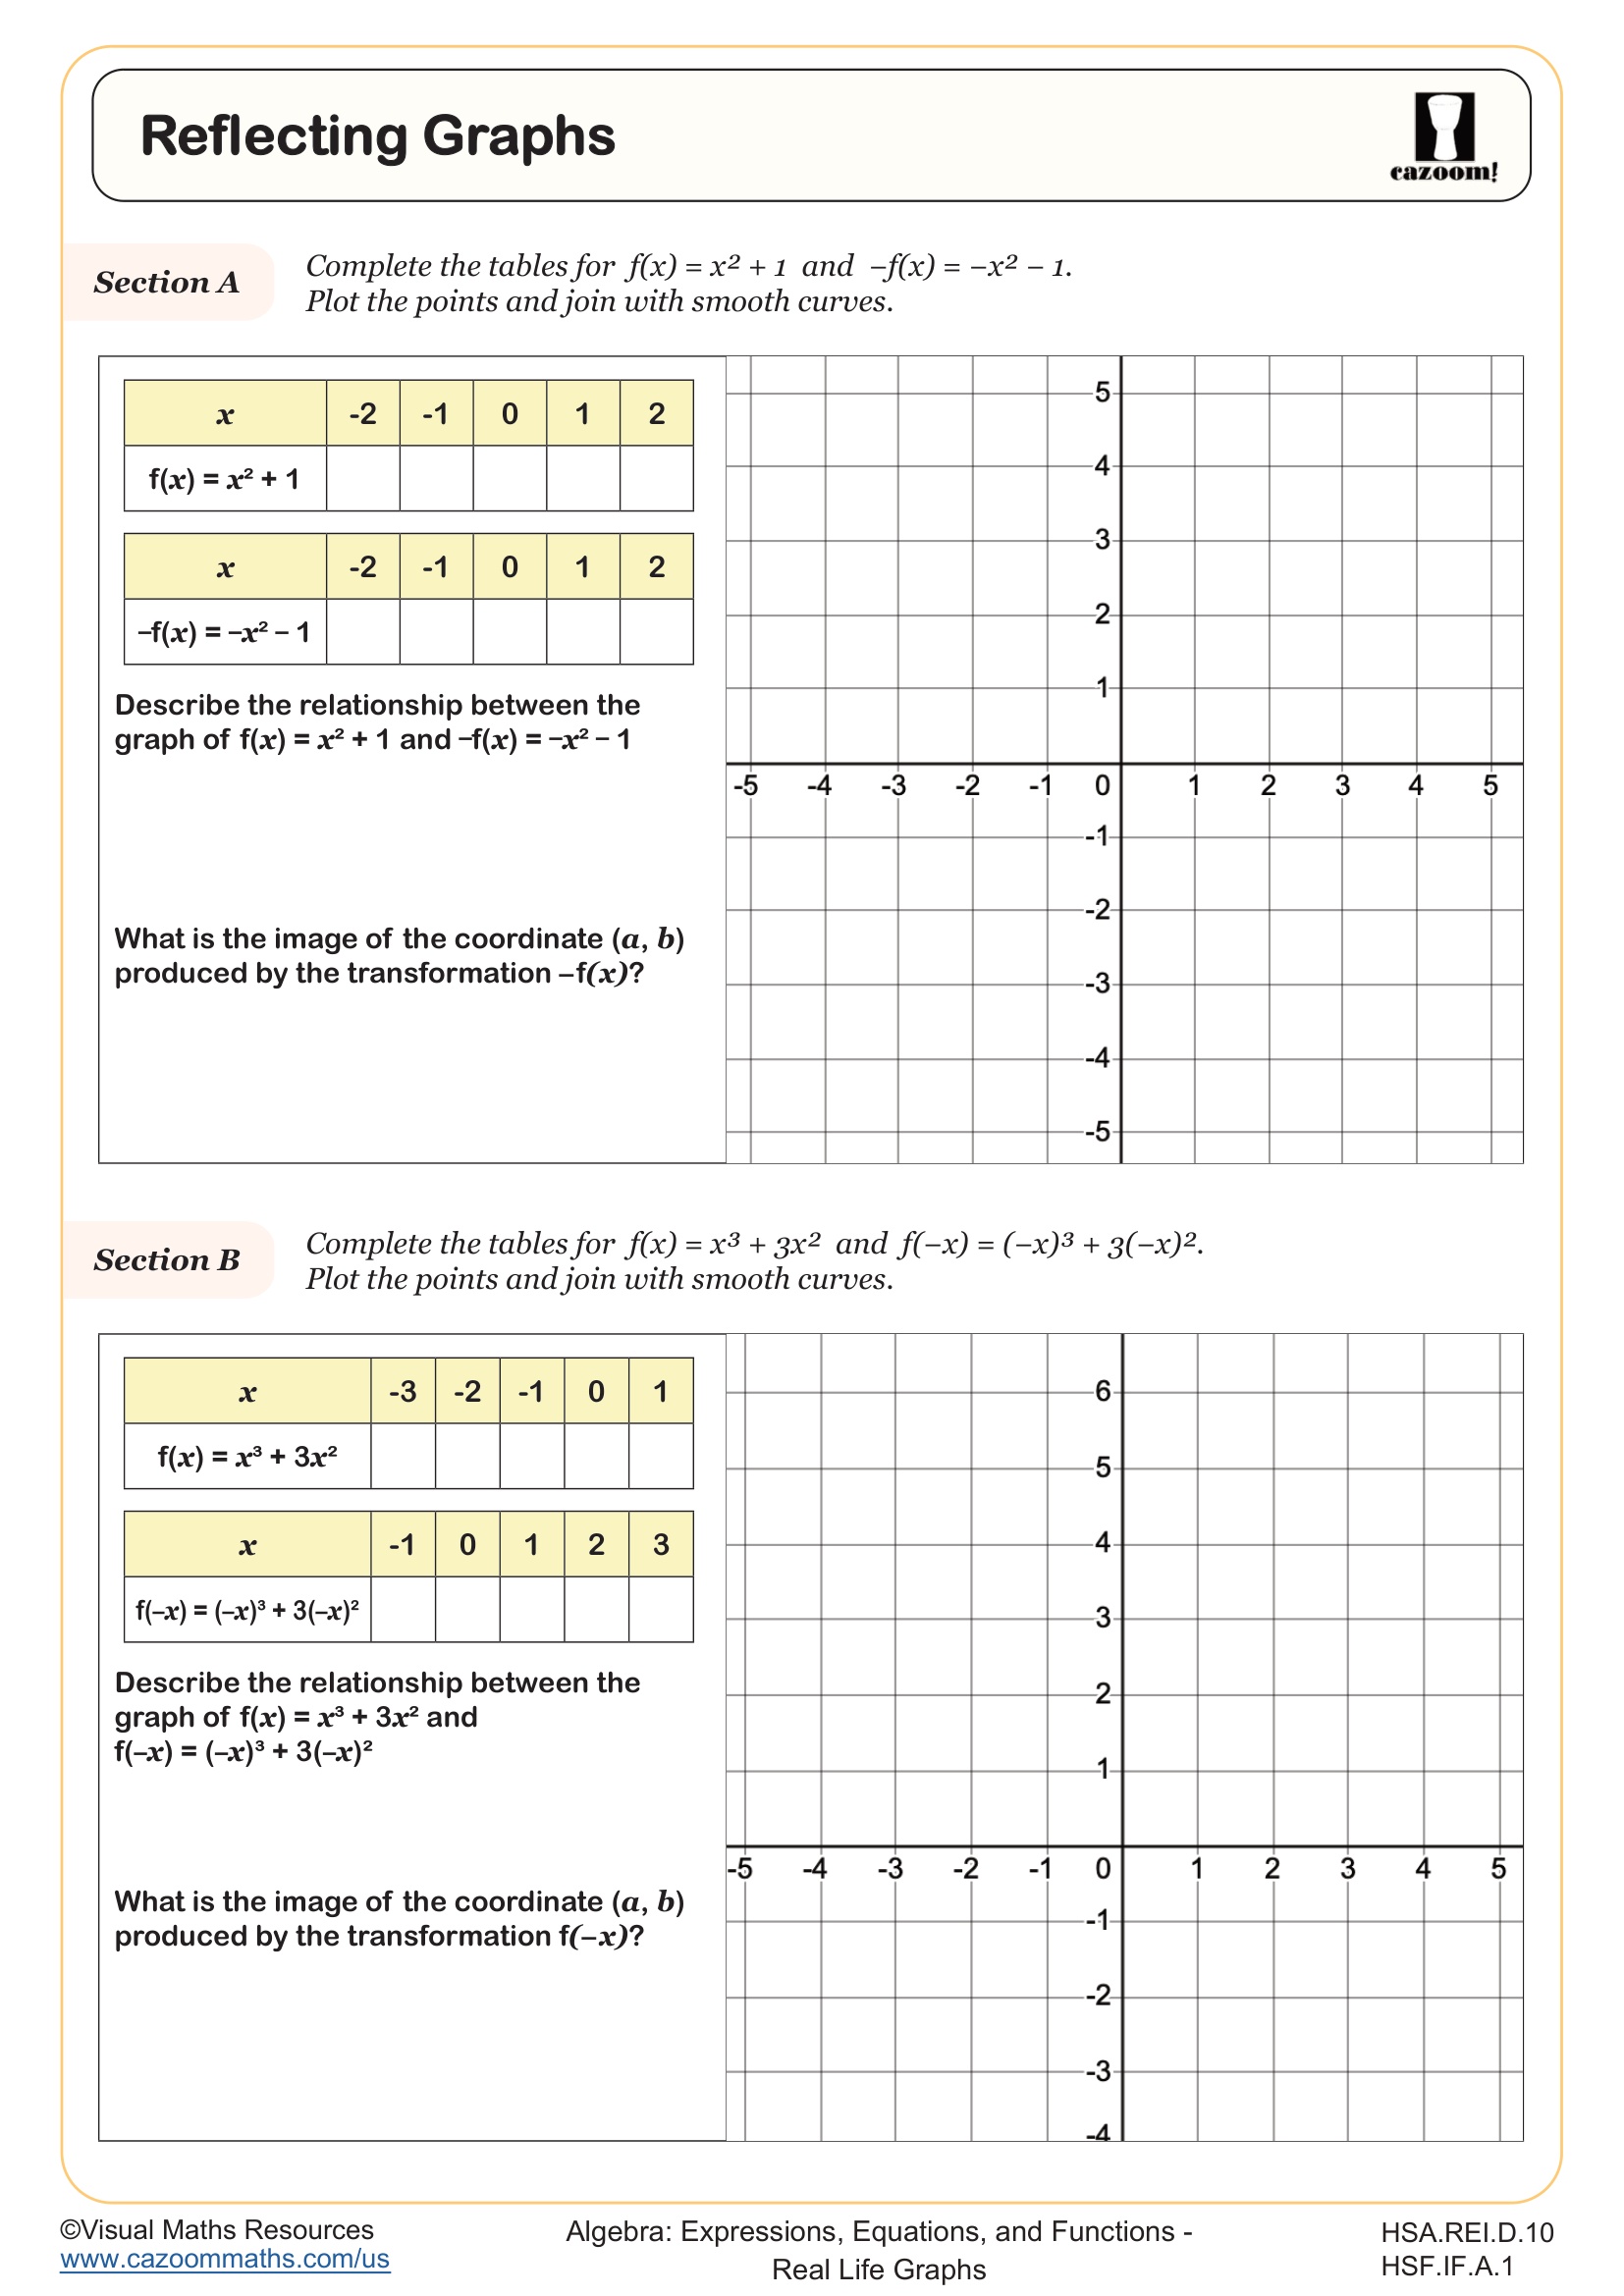
Reflecting Graphs
Grades: Algebra I, IM 1
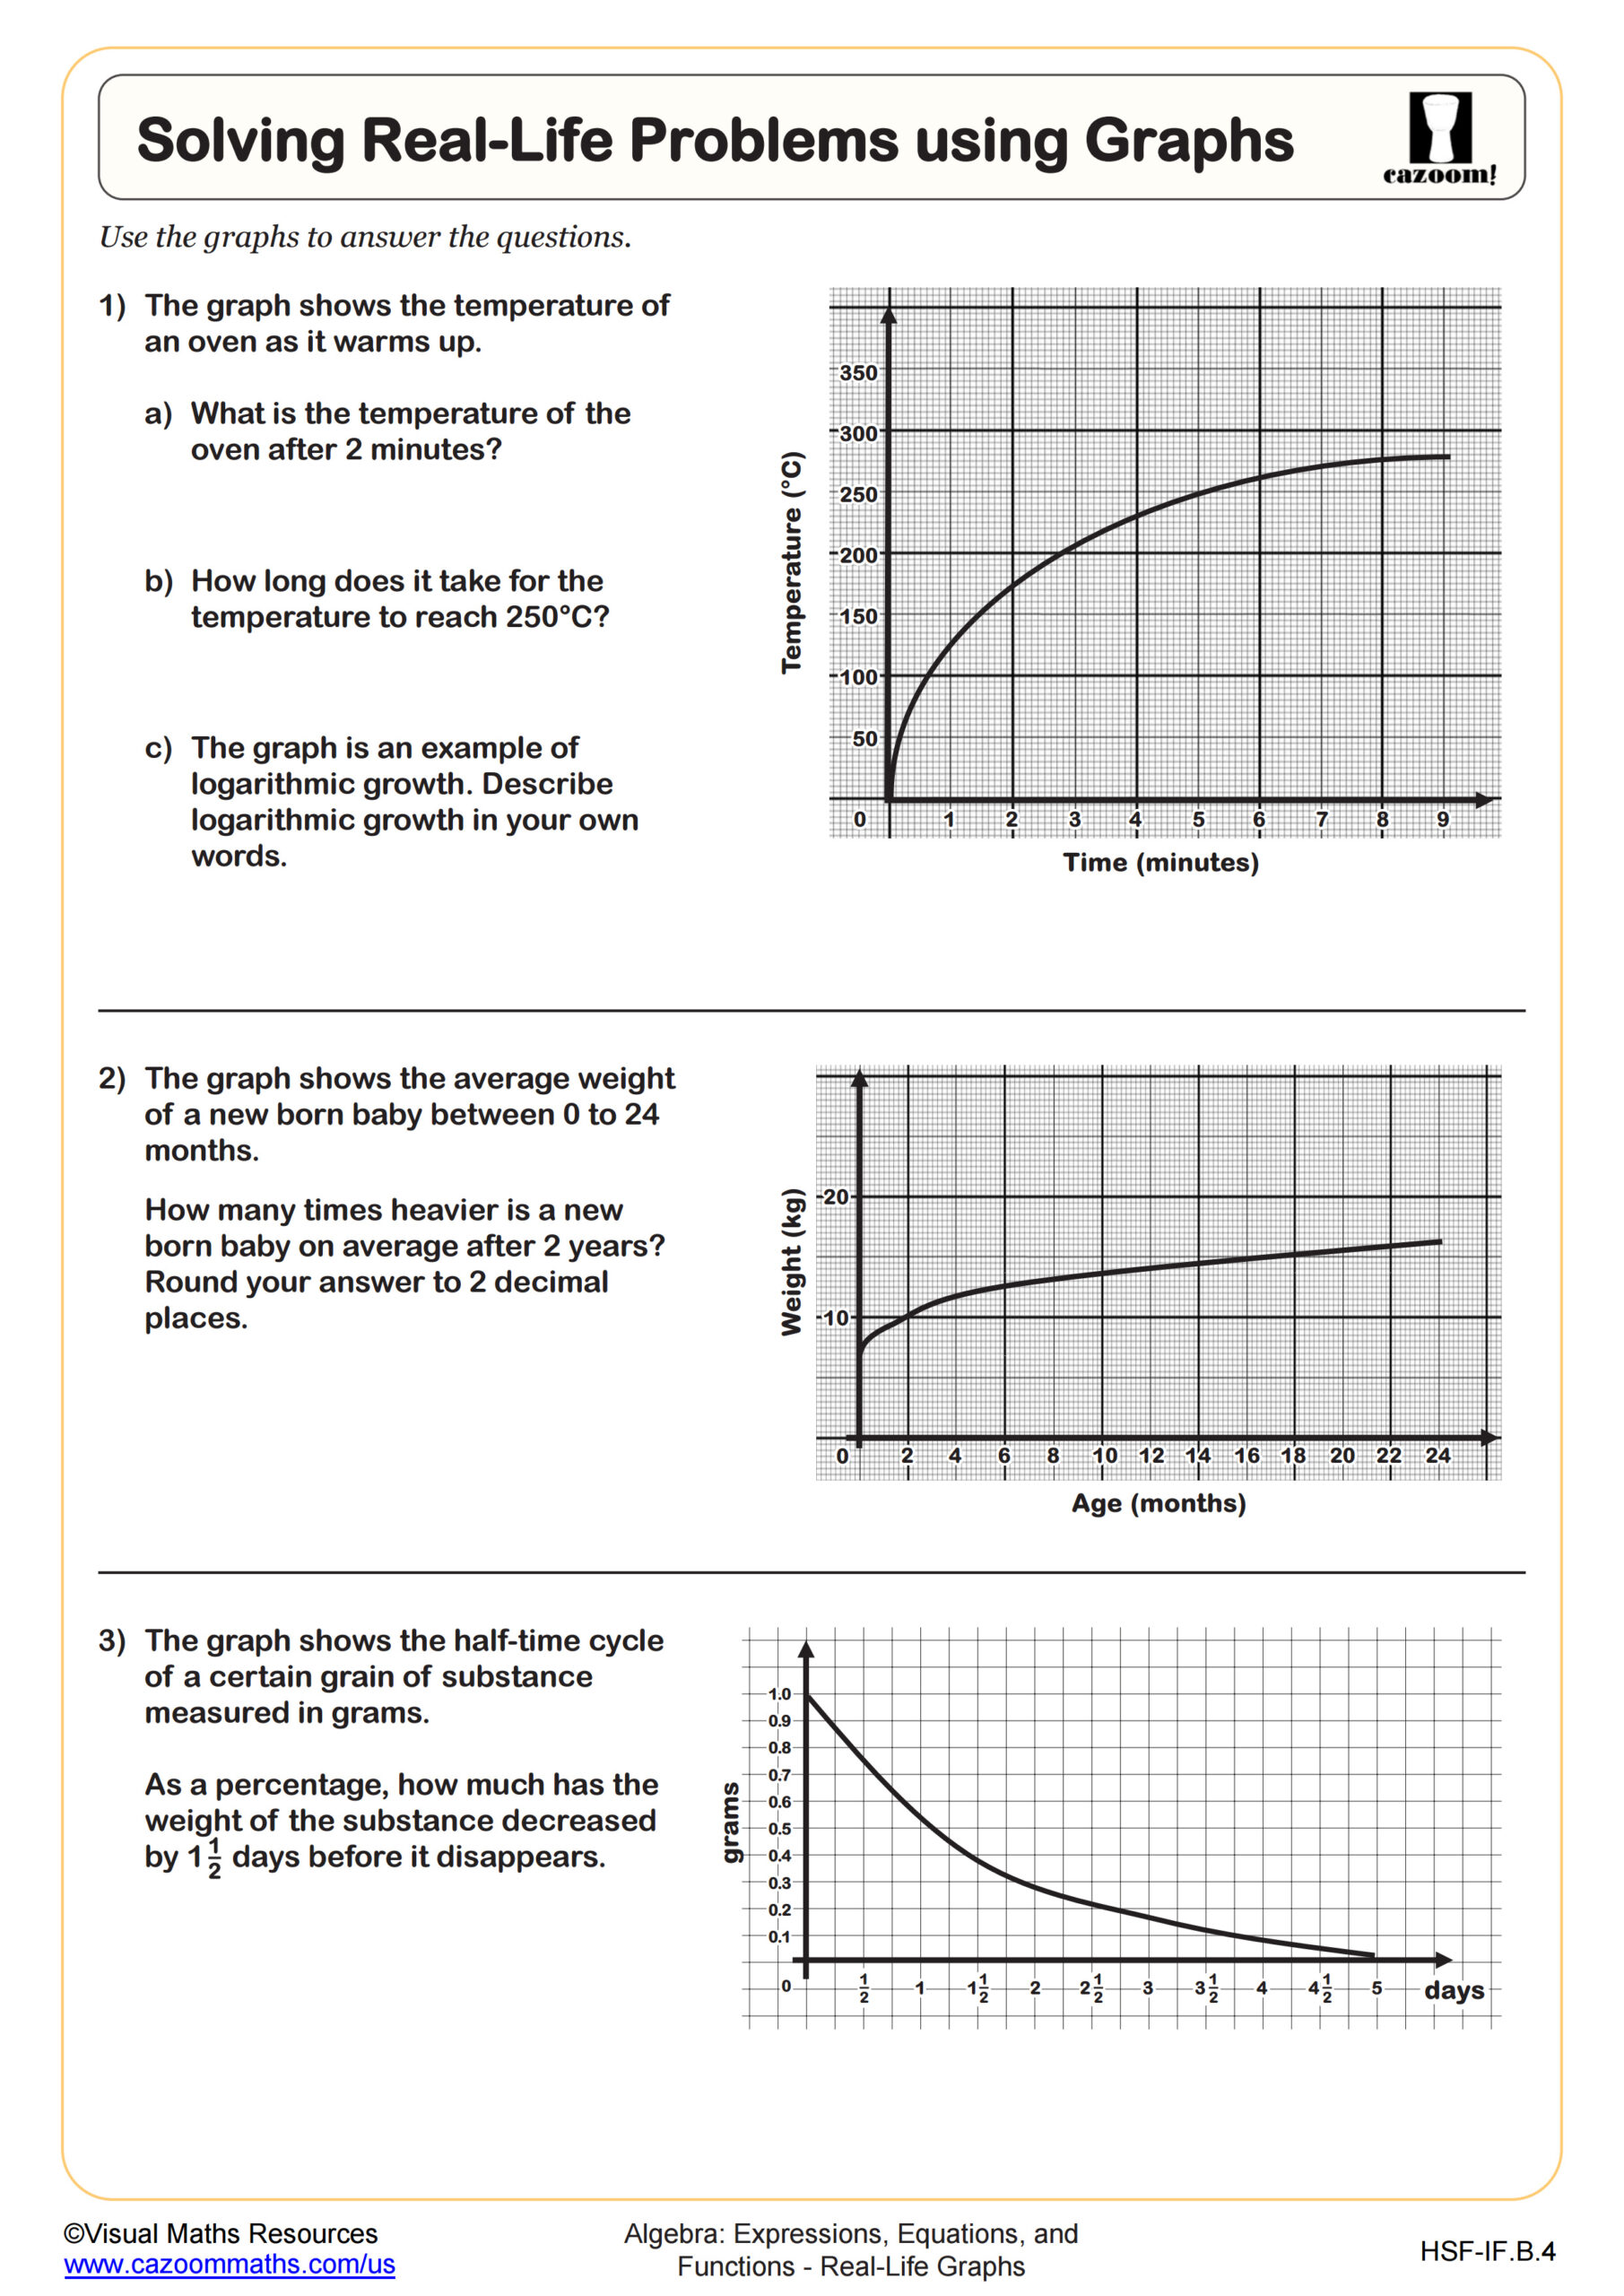
Solving Real-Life Problems using Graphs
Grades: Algebra I, IM 1
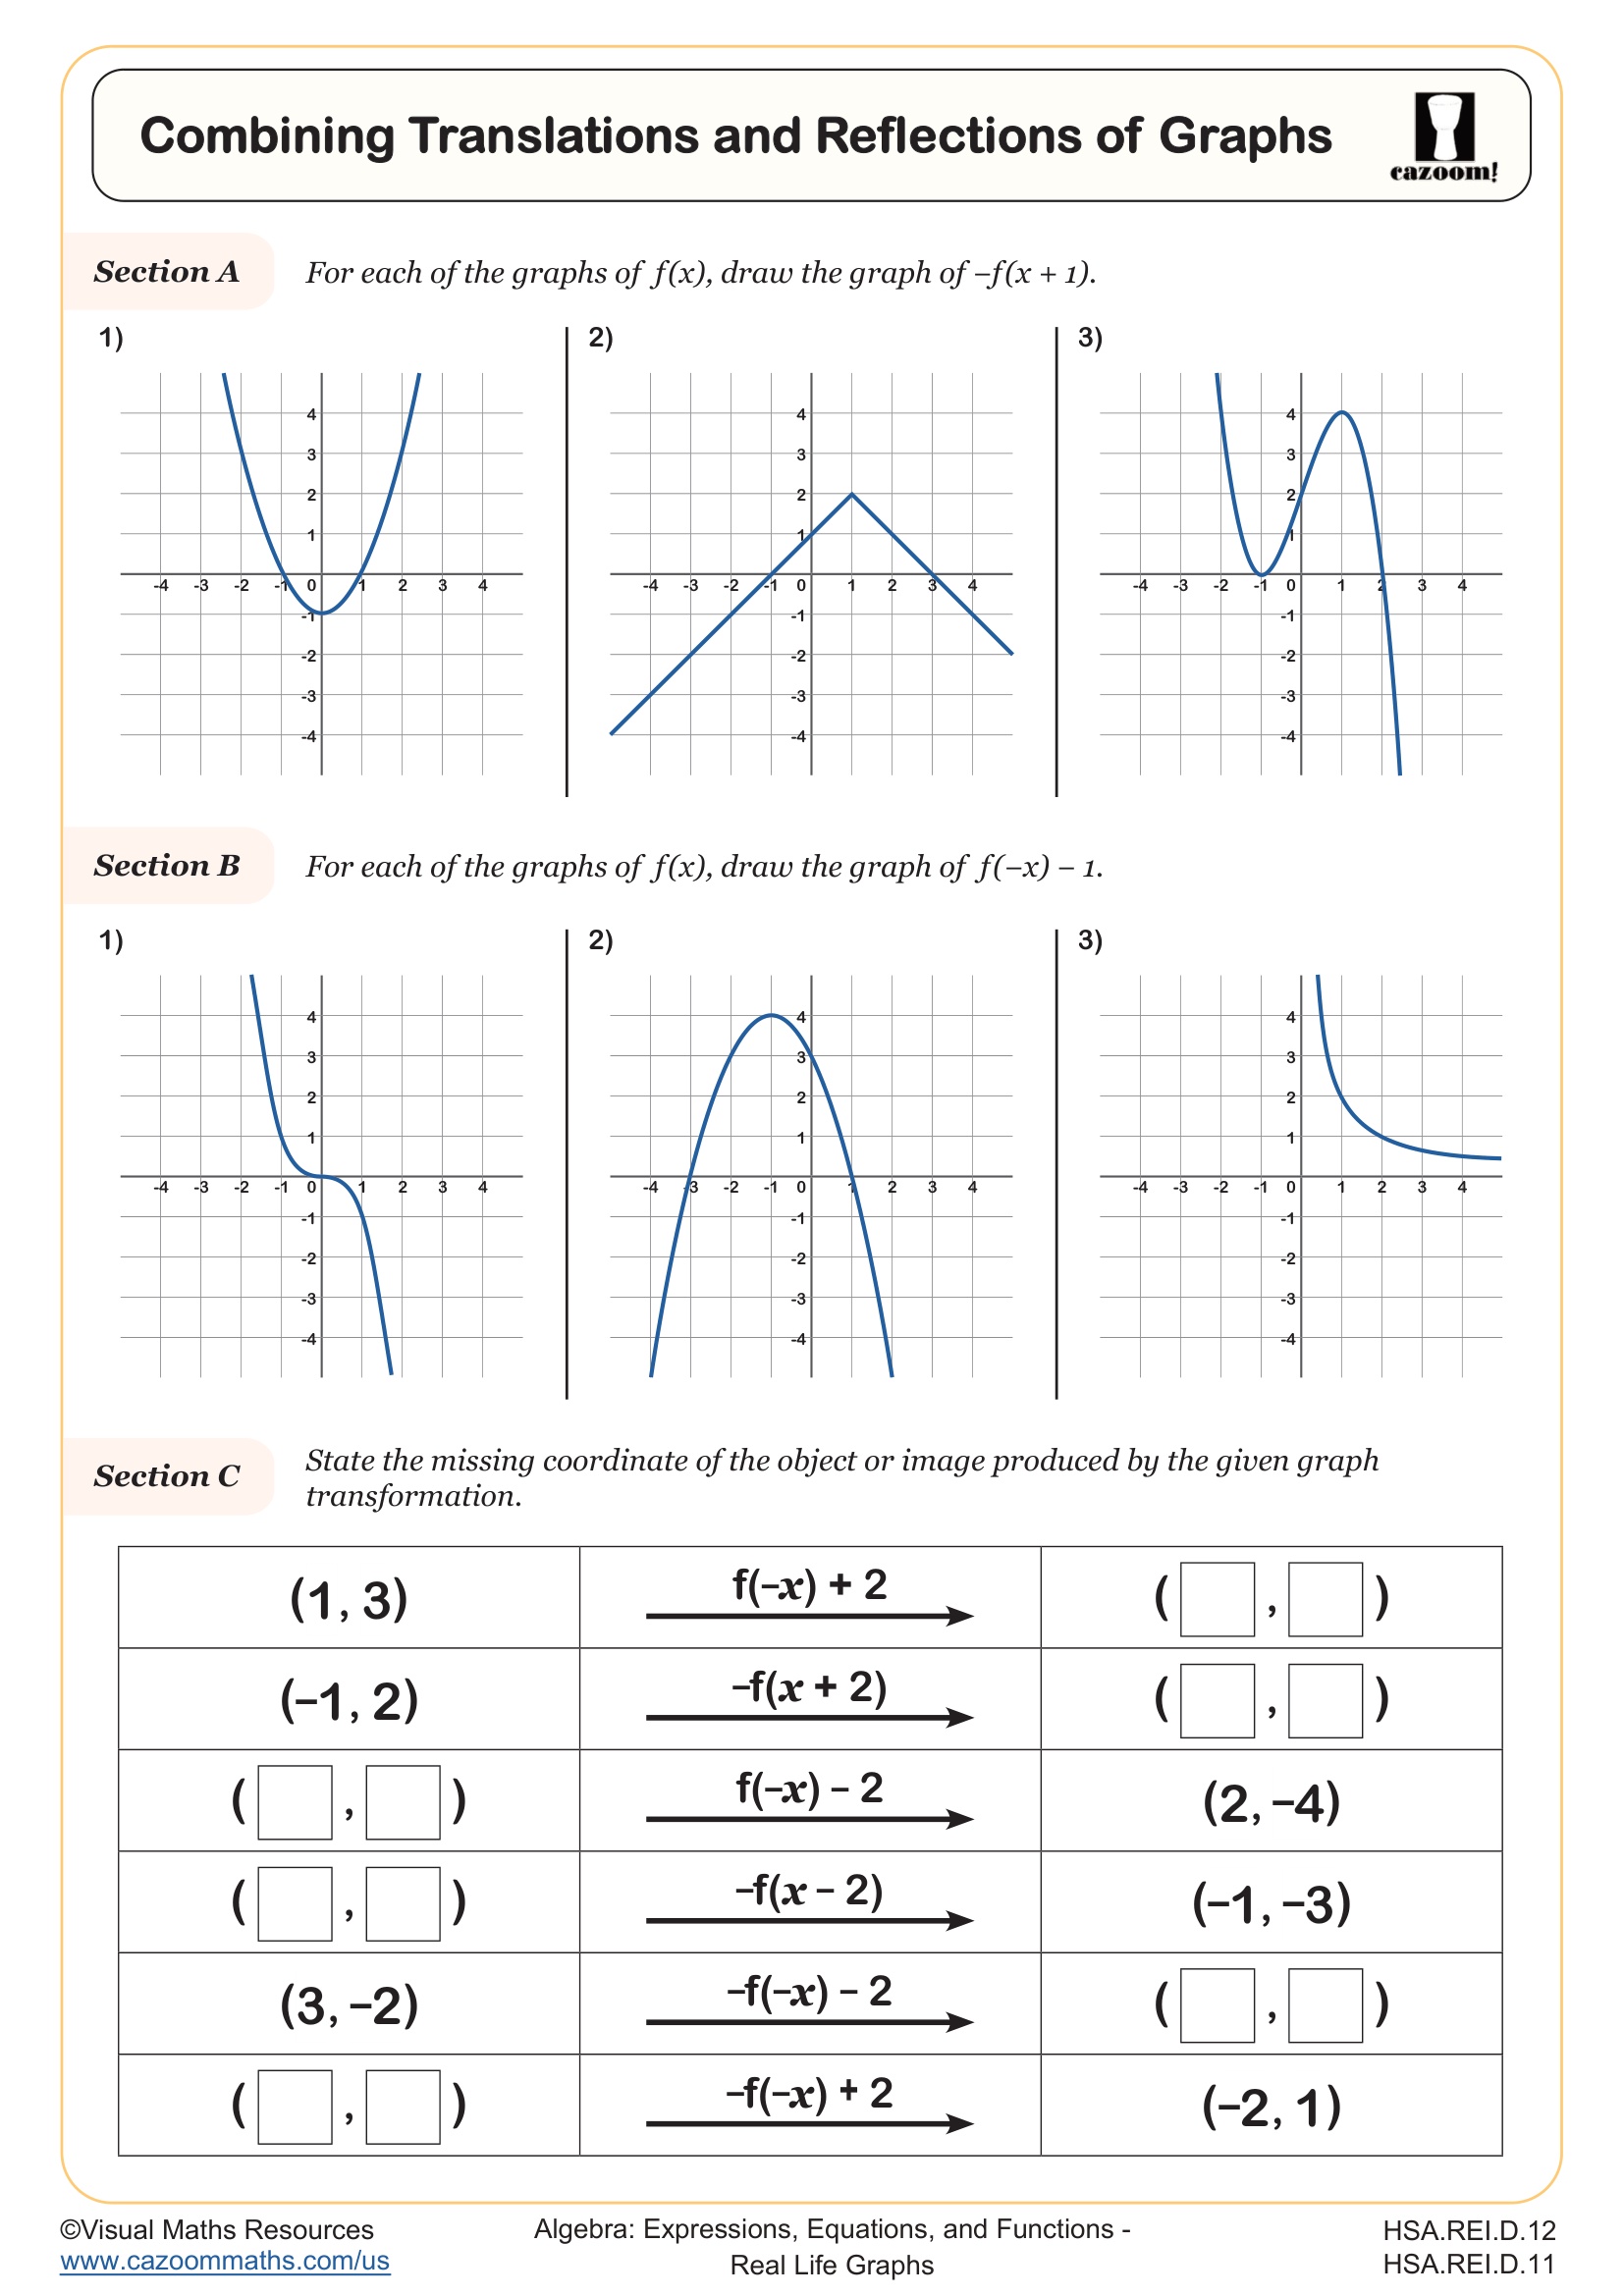
Combining Translations and Reflections of Graphs
Grades: Algebra II, IM 1
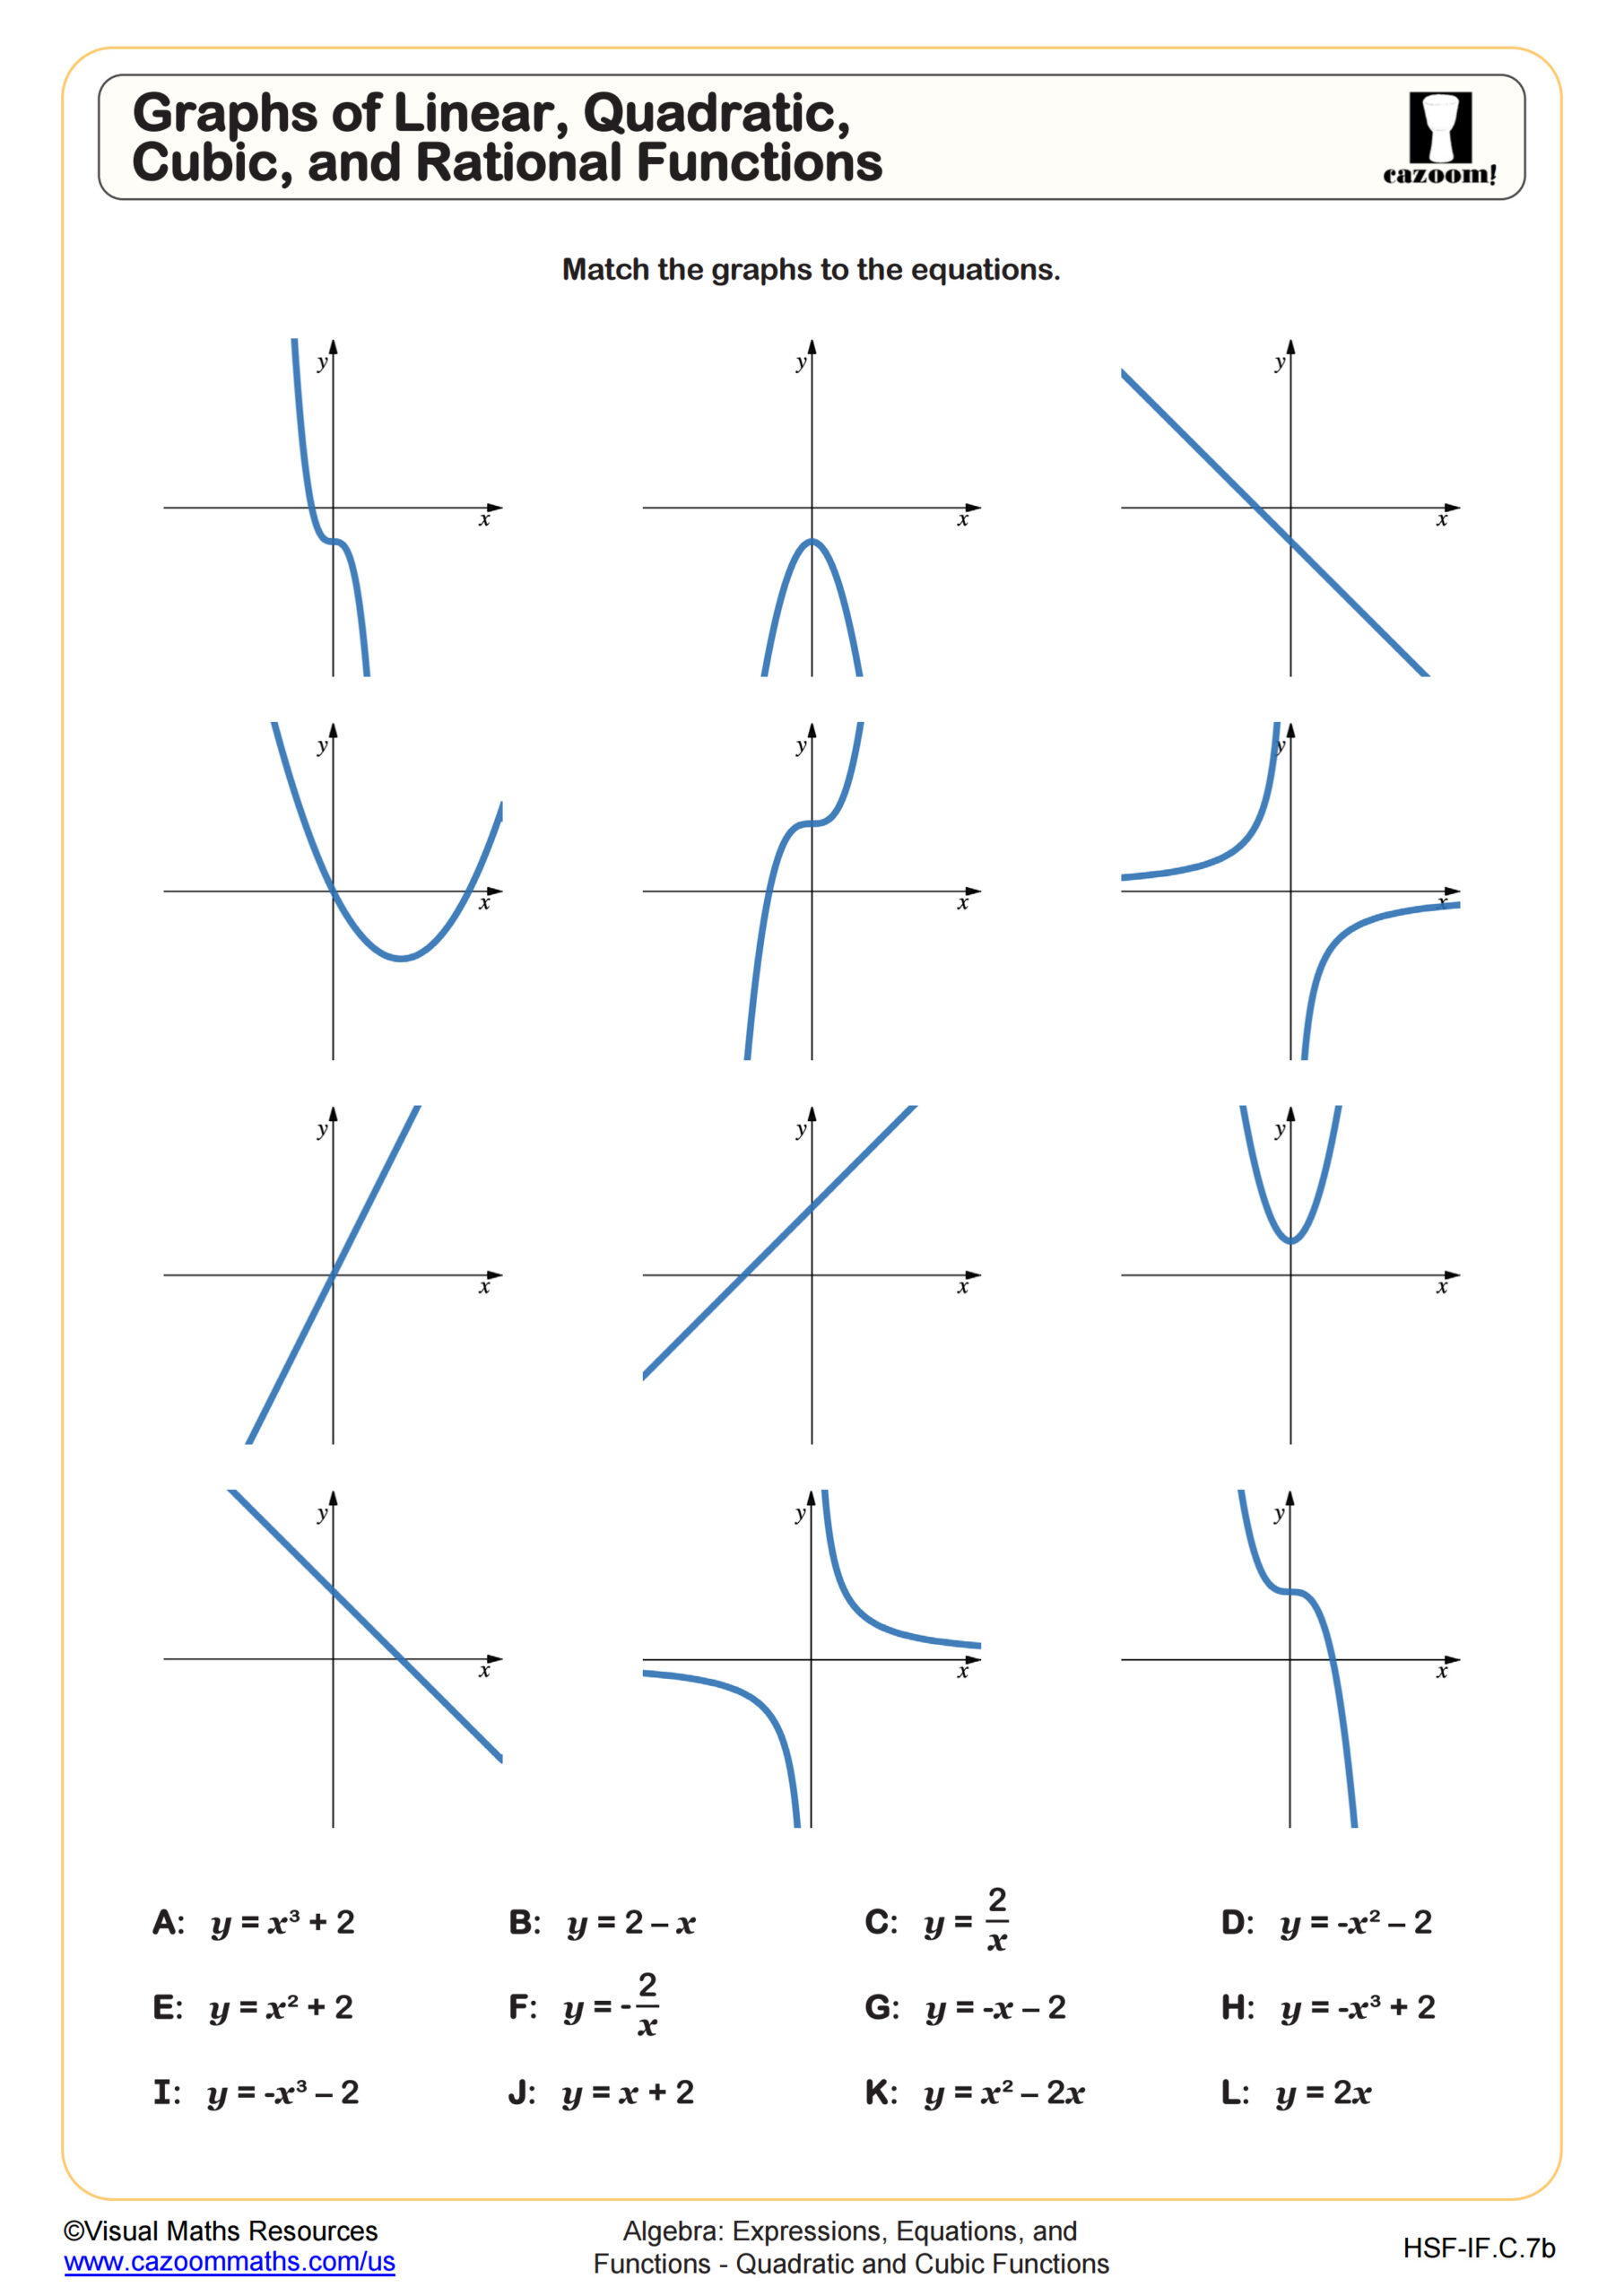
Graphs of Linear, Quadratic, Cubic, and Rational Functions
Grades: Algebra II, IM 3
All worksheets are created by the team of experienced teachers at Cazoom Math.
What types of problems are included in a real life graphs worksheet?
A real life graphs worksheet typically includes scenarios from transportation, weather patterns, business sales, population studies, and scientific experiments. Students encounter distance-time graphs showing car trips, temperature graphs tracking daily weather changes, and linear relationships representing cell phone plans or rental costs. These real life linear graphs worksheet problems align with Common Core standards for interpreting functions and their graphs across middle and high school levels.
Teachers notice that students often misinterpret the axes labels or confuse correlation with causation when analyzing these contextual problems. The most common error occurs when students fail to consider units of measurement, leading to incorrect slope calculations or misunderstanding of what the y-intercept represents in the given situation.
Which grade levels benefit most from real world graphs practice?
Real world graphs appear across multiple grade levels, starting with simple bar graphs and pictographs in elementary grades, progressing to coordinate plane work in grades 6-8, and advancing to complex function analysis in high school algebra and statistics courses. Middle school students typically focus on linear relationships and basic interpretation skills, while high school learners tackle exponential, quadratic, and piecewise functions in real-world contexts.
Educators find that eighth graders particularly benefit from this bridge between concrete thinking and abstract mathematical reasoning. Students at this level can grasp the practical applications while developing the algebraic skills needed for more advanced coursework in geometry and algebra II.
How do real life graphs help students understand slope and intercepts?
Real life contexts give concrete meaning to abstract concepts like slope and y-intercept that students often find confusing in purely algebraic settings. When analyzing a graph showing water draining from a bathtub, students can visualize that the slope represents the rate of water loss per minute, while the y-intercept shows the initial water level. These tangible connections help solidify understanding of linear relationships.
Teachers report that students who struggle with slope-intercept form in isolation often succeed when the same concepts appear in story problems with graphs. The key breakthrough happens when learners realize that slope always represents a rate of change, whether it's miles per hour, dollars per item, or degrees per day in various real-world situations.
What's the most effective way to use real life graphs worksheet PDF resources in the classroom?
Teachers achieve the best results when they introduce real life graphs worksheet PDF materials after students have mastered basic coordinate plane skills but before moving to abstract function notation. Starting with familiar contexts like sports statistics or social media usage helps students connect prior knowledge to new mathematical concepts. The PDF format allows for easy projection during whole-class discussions and individual student access.
Successful implementation involves having students work in pairs to discuss their interpretations before checking answers, as this builds communication skills alongside mathematical reasoning. Teachers find that asking students to create their own real-world scenarios for given graphs deepens understanding and reveals misconceptions that might otherwise go unnoticed during traditional practice sessions.