Bivariate Data Worksheets With Answers
Printable PDF Bivariate Data Worksheets with Answer Keys
Download our printable PDF Bivariate Data resources to give students the push they need when learning different concepts of statistics equations. Our math experts have specifically curated these resources in a way that your students can master the worksheet using simple statistics equations with clear and easy-to-understand instructions. Hence, our statistics resources are great for building a sense of basic statistical problems, algebraic equations and early problem-solving skills.
What Is Bivariate Data?
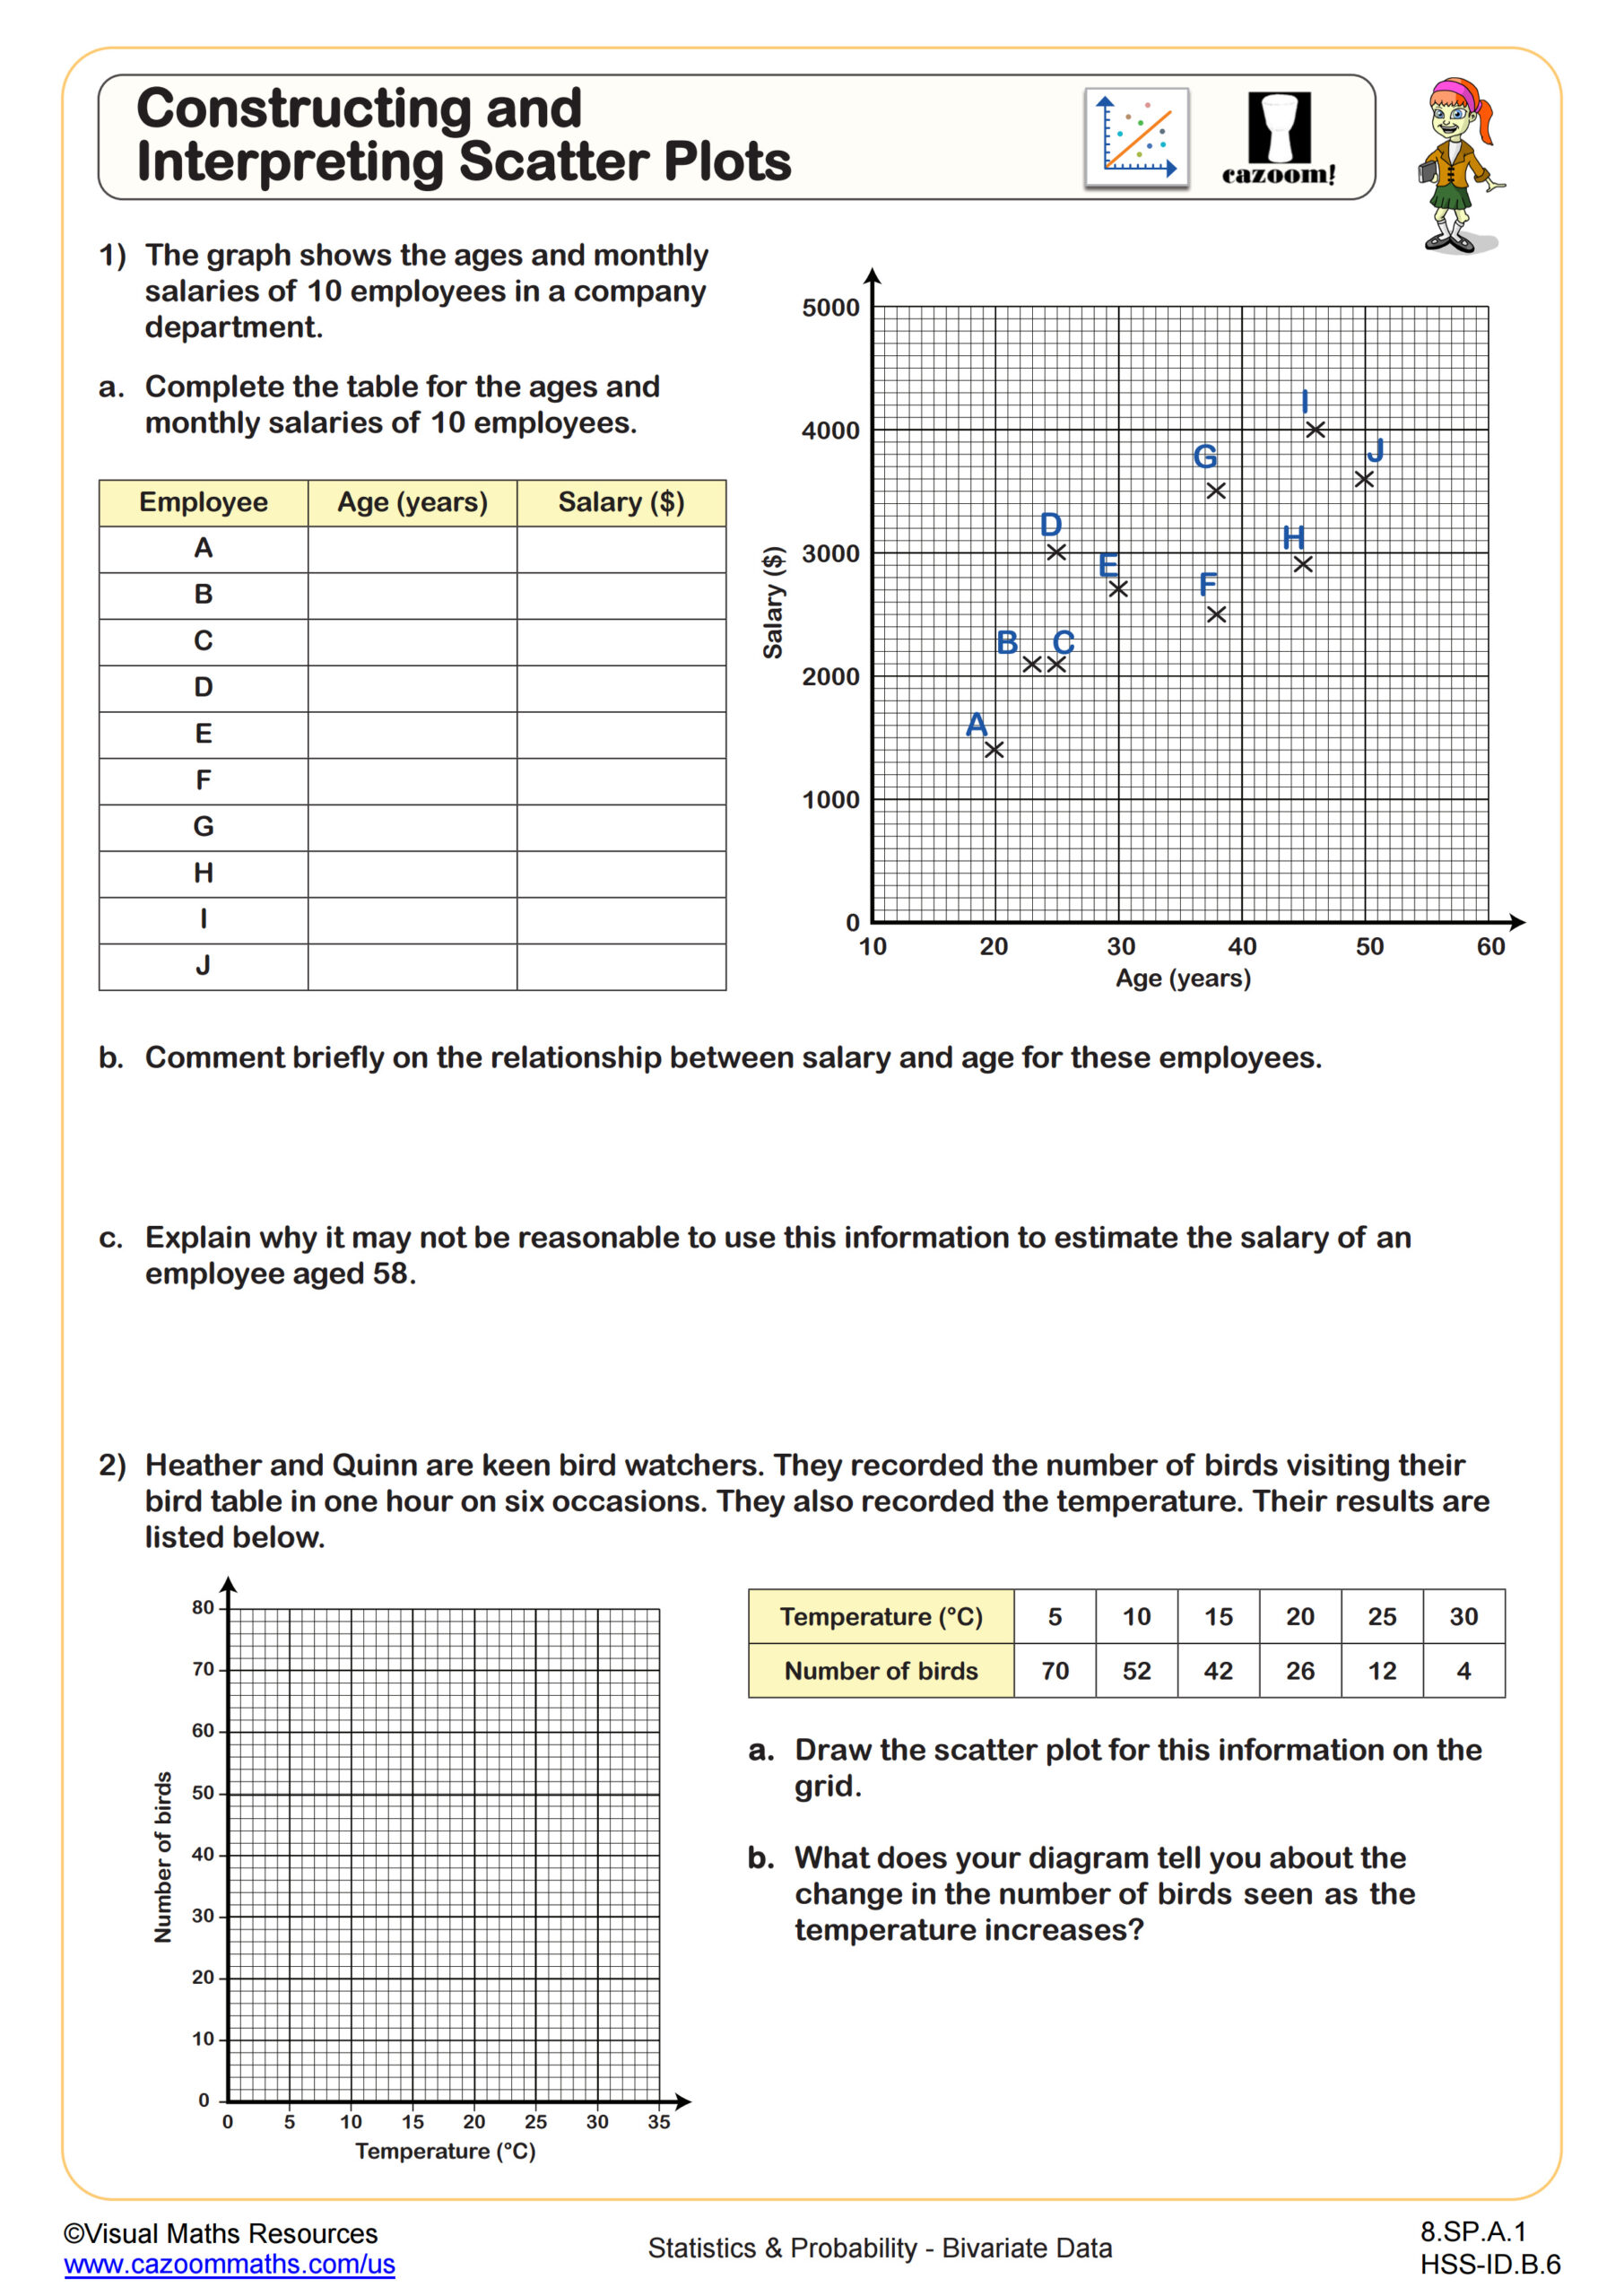
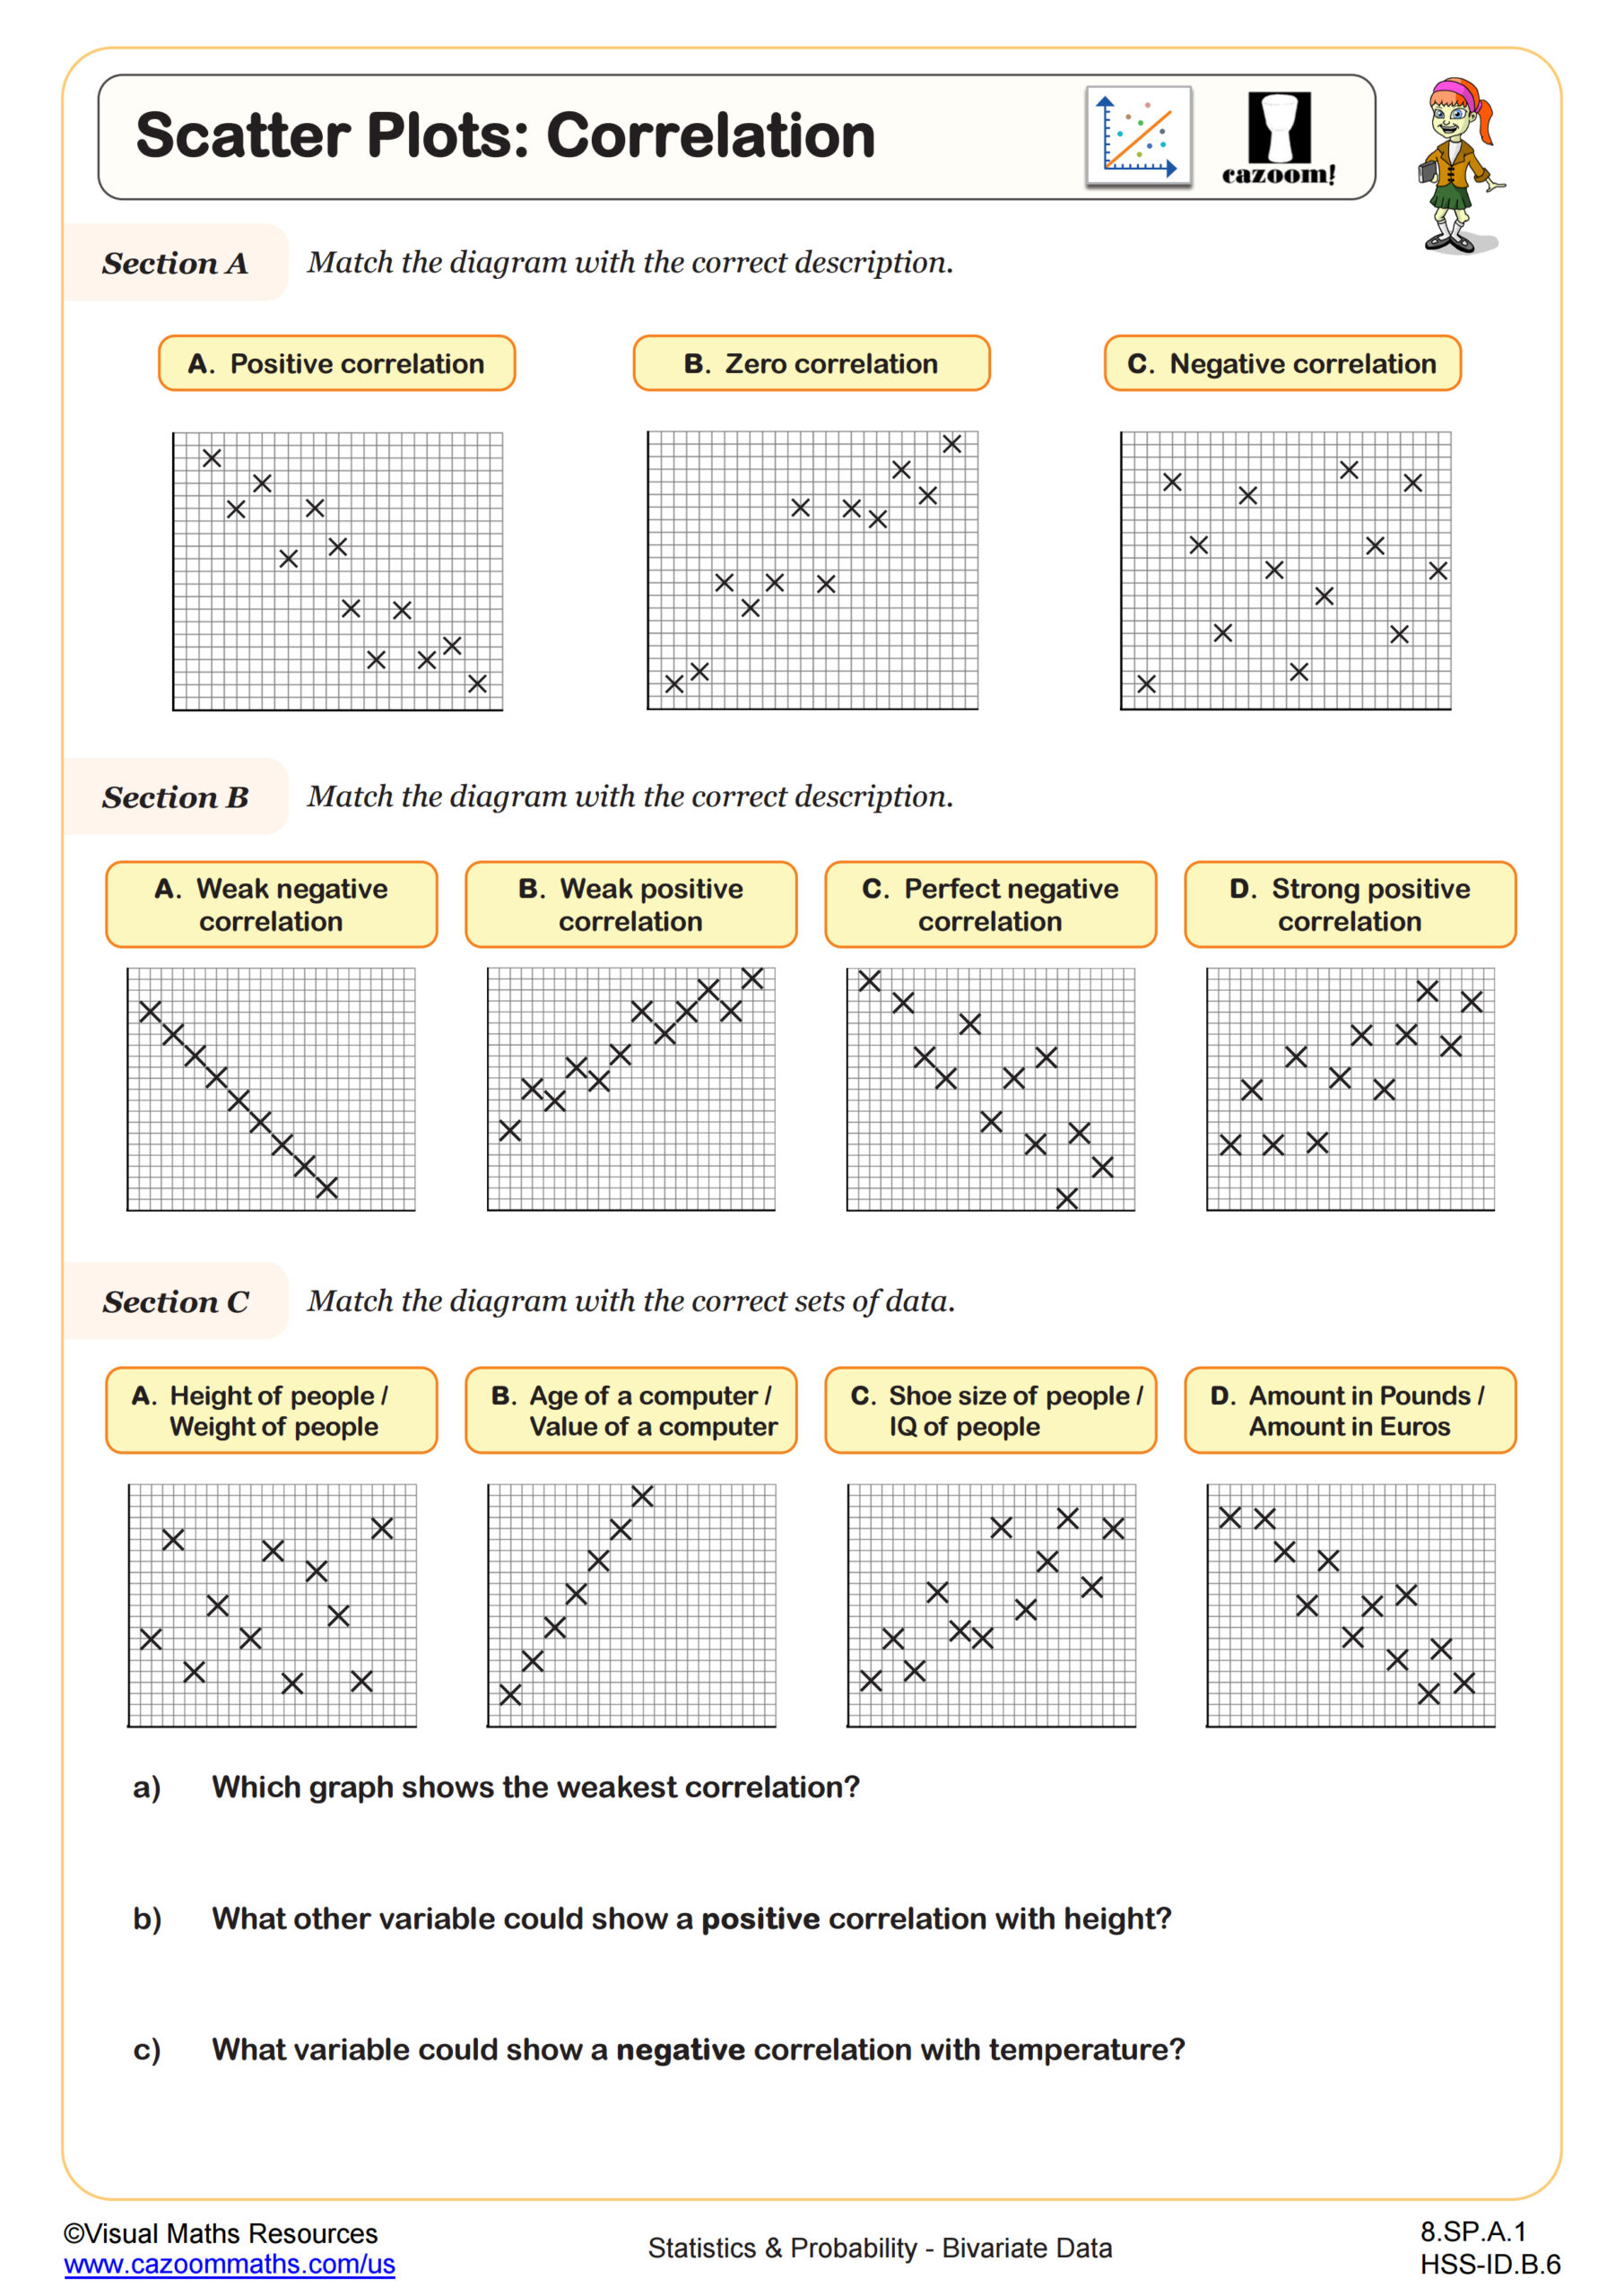
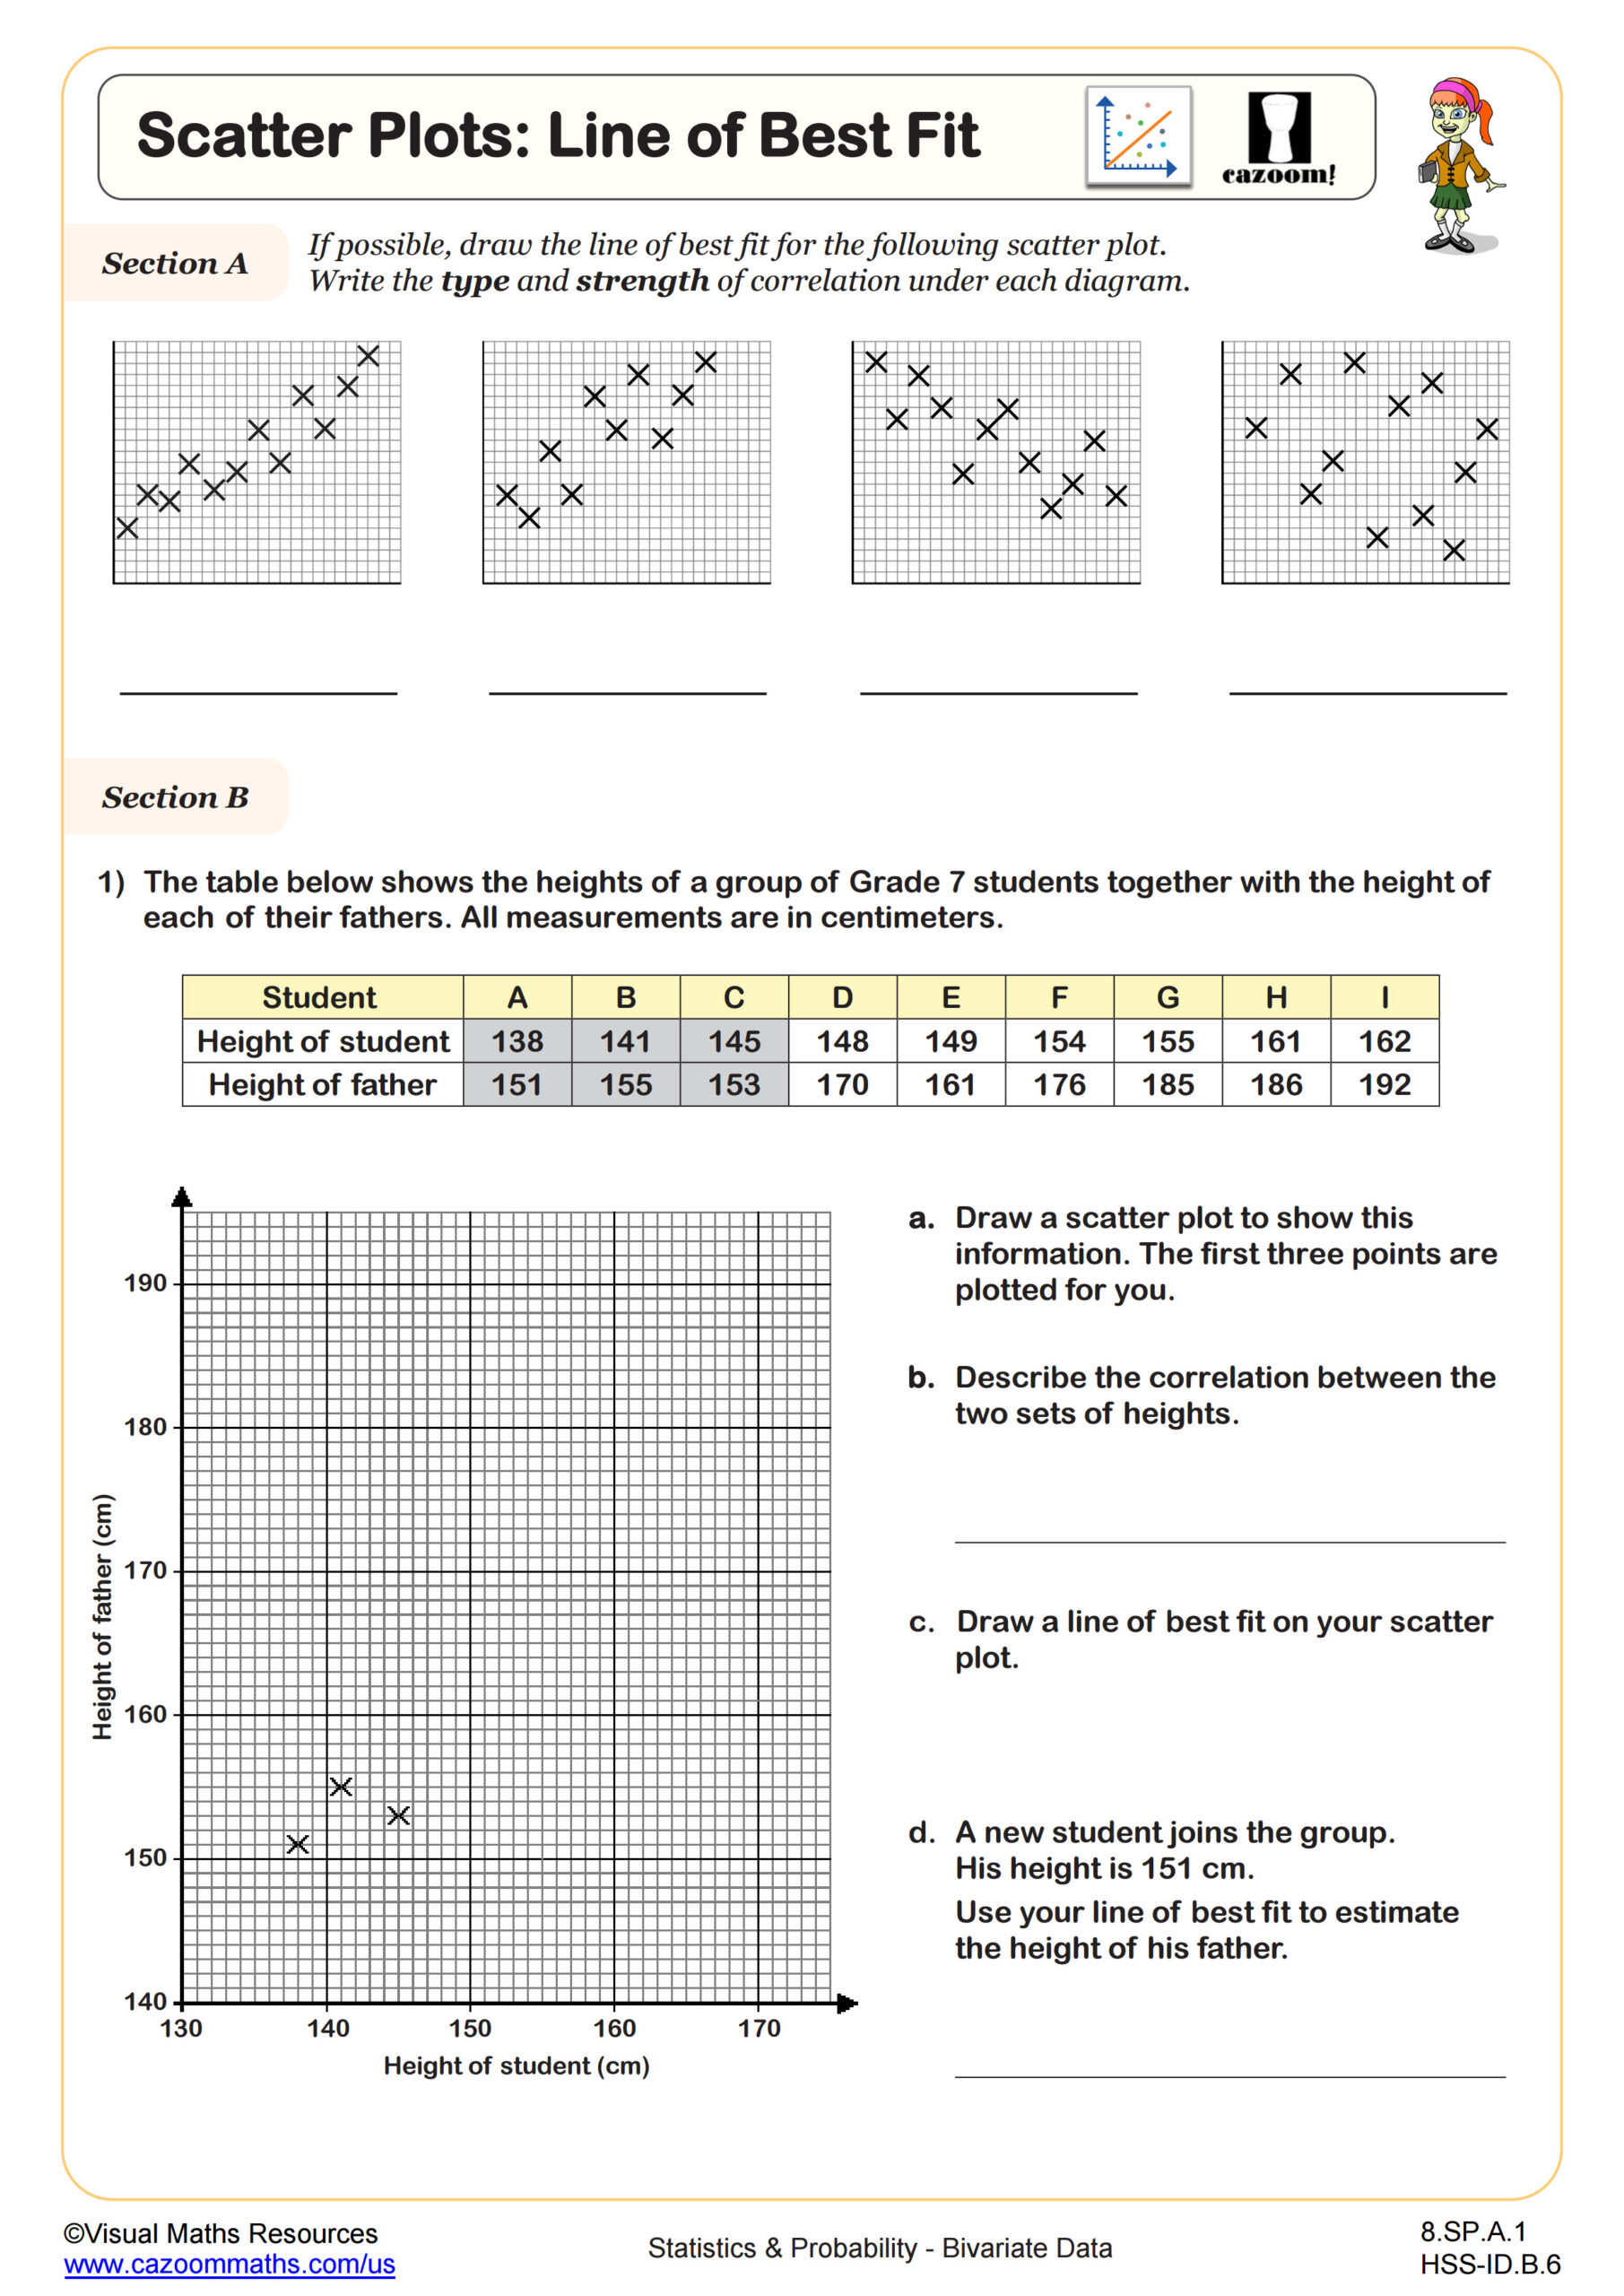
Bivariate data is one of the core concepts of CCSS math. The basic idea of this concept is data that involves two related variables. To give you an example, you might compare the number of hours studied and test scores, or height and weight. This type of data is often shown using scatter plots to identify patterns, trends, or relationships. Learning how to read and analyze bivariate data is a key skill in statistics and real-world problem solving.
Difference Between Univariate and Bivariate Data in Math Analysis
Univariate data involves only one variable and is used to describe or summarize information, such as test scores, ages, or heights. It does not explore any relationships or causes. In contrast, bivariate data involves two variables and is used to find relationships or patterns between them—like studying how hours of study affect test scores. While univariate data focuses on describing, bivariate data aims to explain or predict based on the connection between two variables.
What Is Bivariate Analysis?
The basic idea of Bivariate analysis is used to study the relationship between two variables. It helps identify patterns, trends, or possible causes behind changes in one variable based on the other. Common tools include scatter plots and tables. The type of analysis depends on the variables used:
• Numerical & Numerical: e.g., hours studied vs. test score
• Categorical & Categorical: e.g., favorite color vs. pet type
• Numerical & Categorical: e.g., age group vs. number of books read
Bivariate analysis helps explain how two variables are connected.
Why Practice with Our Bivariate Data Worksheets?
Why Practice with Our Bivariate Data Worksheets?
Bivariate data is used in math, science, and everyday decision-making. Learning to compare two variables helps students understand how data works and how to look for trends. These worksheets build confidence in interpreting graphs and making data-driven predictions—skills that are helpful in class and beyond.
Real-Life Uses of Bivariate Data
Bivariate data is used in real life to study things like weather patterns, health data, business trends, and more. Let’s take some examples, comparing time spent exercising with energy levels can help students understand fitness. Our worksheets use real-life themes to make learning about data both meaningful and relevant.
FAQs: Understanding Univariate and Bivariate Data
Q: How do you differentiate univariate data from bivariate data?
A: Univariate data has only one variable and is used to describe something, like the height of students. Bivariate data has two variables and shows how they relate—for example, height and age.
Q: What is bivariate data with an example?
A: Bivariate data includes two variables that may be related. For example, tracking how many hours a student studies and the score they get on a test is bivariate data.
Q: What is an example of bivariate data in math?
A: In math, an example is comparing the number of hours a person exercises and how many calories they burn. You graph both sets of data to see the pattern or trend.
Q: In which grade do you learn bivariate data?
A: Most students learn about bivariate data in 6th to 8th grade, depending on the math curriculum. It’s part of learning how to analyze and graph data.
Q: Why is learning bivariate data important?
A: Learning bivariate data helps students understand patterns and relationships between two things. It improves data analysis skills and is useful in science, business, and real-life problem solving.


