Geometry Samples and Surveys Worksheets
All worksheets are created by the team of experienced teachers at Cazoom Math.
What Do Samples and Surveys Worksheets Cover in Geometry?
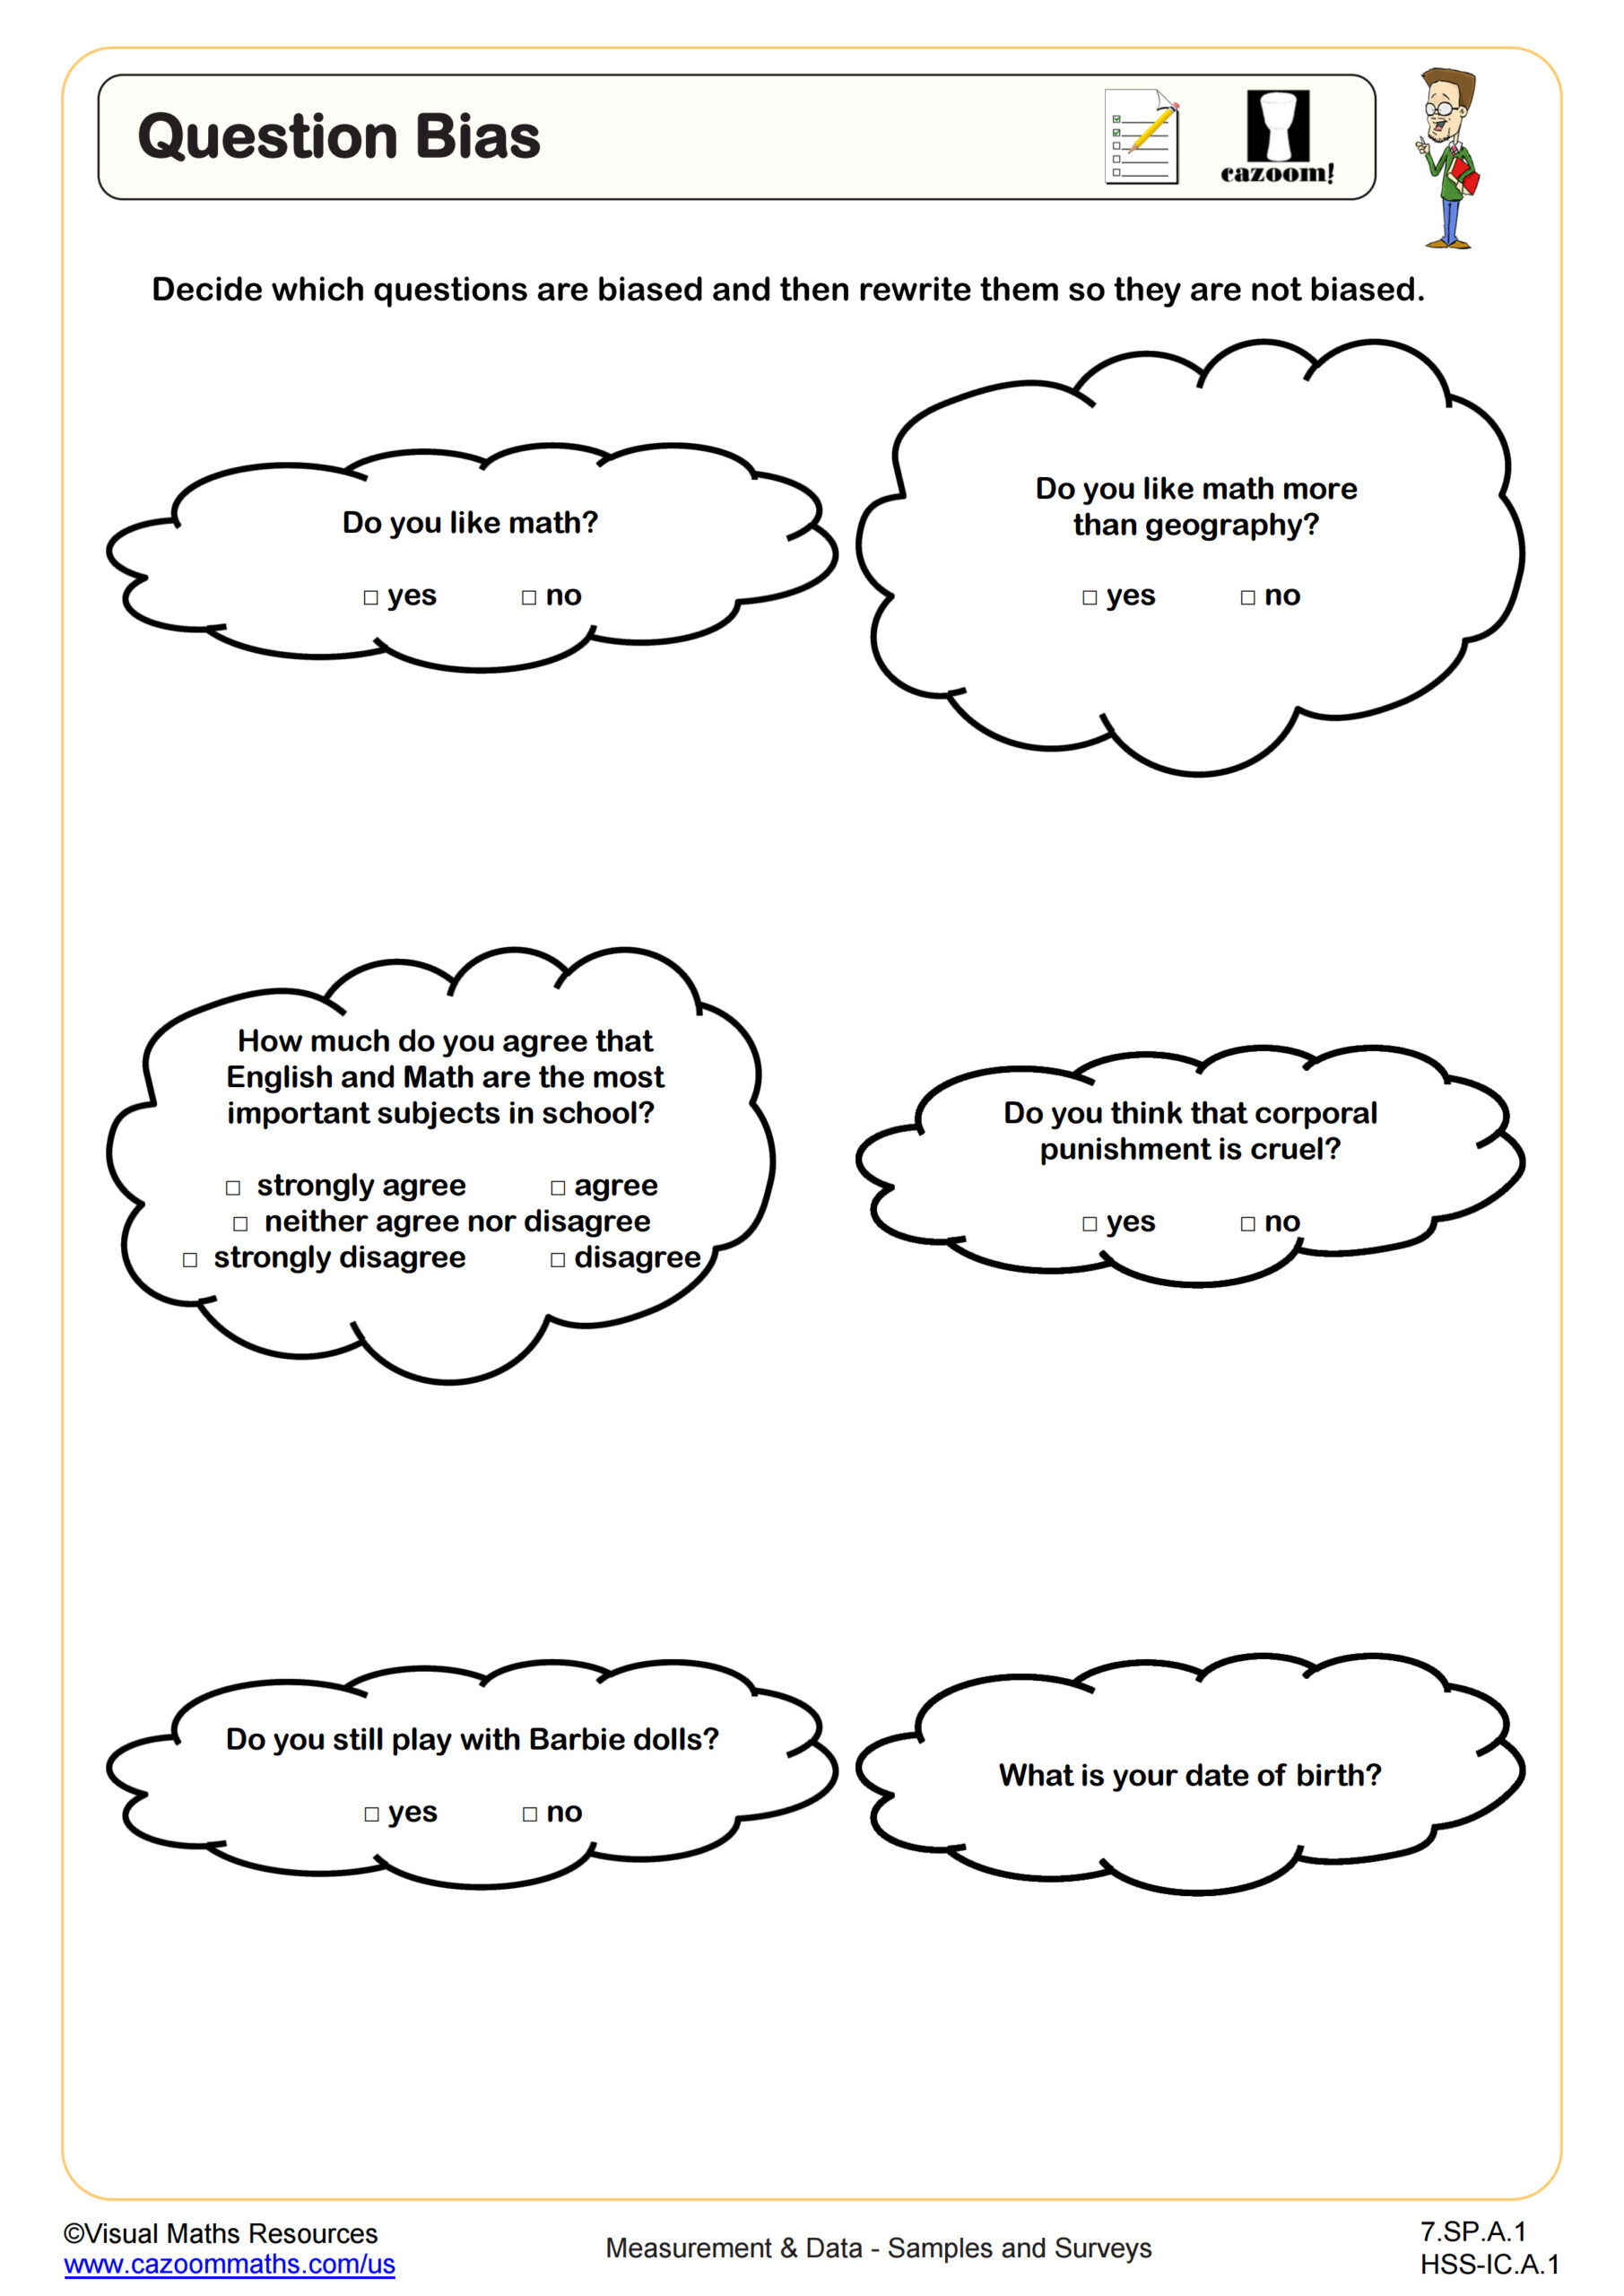
Samples and surveys worksheets in Geometry focus on statistical reasoning standards that prepare students for data analysis in higher mathematics. Students learn to distinguish between random and biased samples, understand stratified sampling as a method for representative data collection, and identify leading or confusing questions that compromise survey validity. These skills connect directly to Geometry's emphasis on logical reasoning and proof construction.
Teachers frequently observe that students initially assume all surveys produce reliable data, missing subtle wording that influences responses. The worksheets address this misconception by presenting parallel scenarios where students compare biased versus unbiased approaches. Students analyze real survey questions to spot loaded language, double-barreled questions, or false dichotomies that skew results, developing the analytical skills needed for experimental design in science courses.
How Do Samples and Surveys Appear on Standardized Tests?
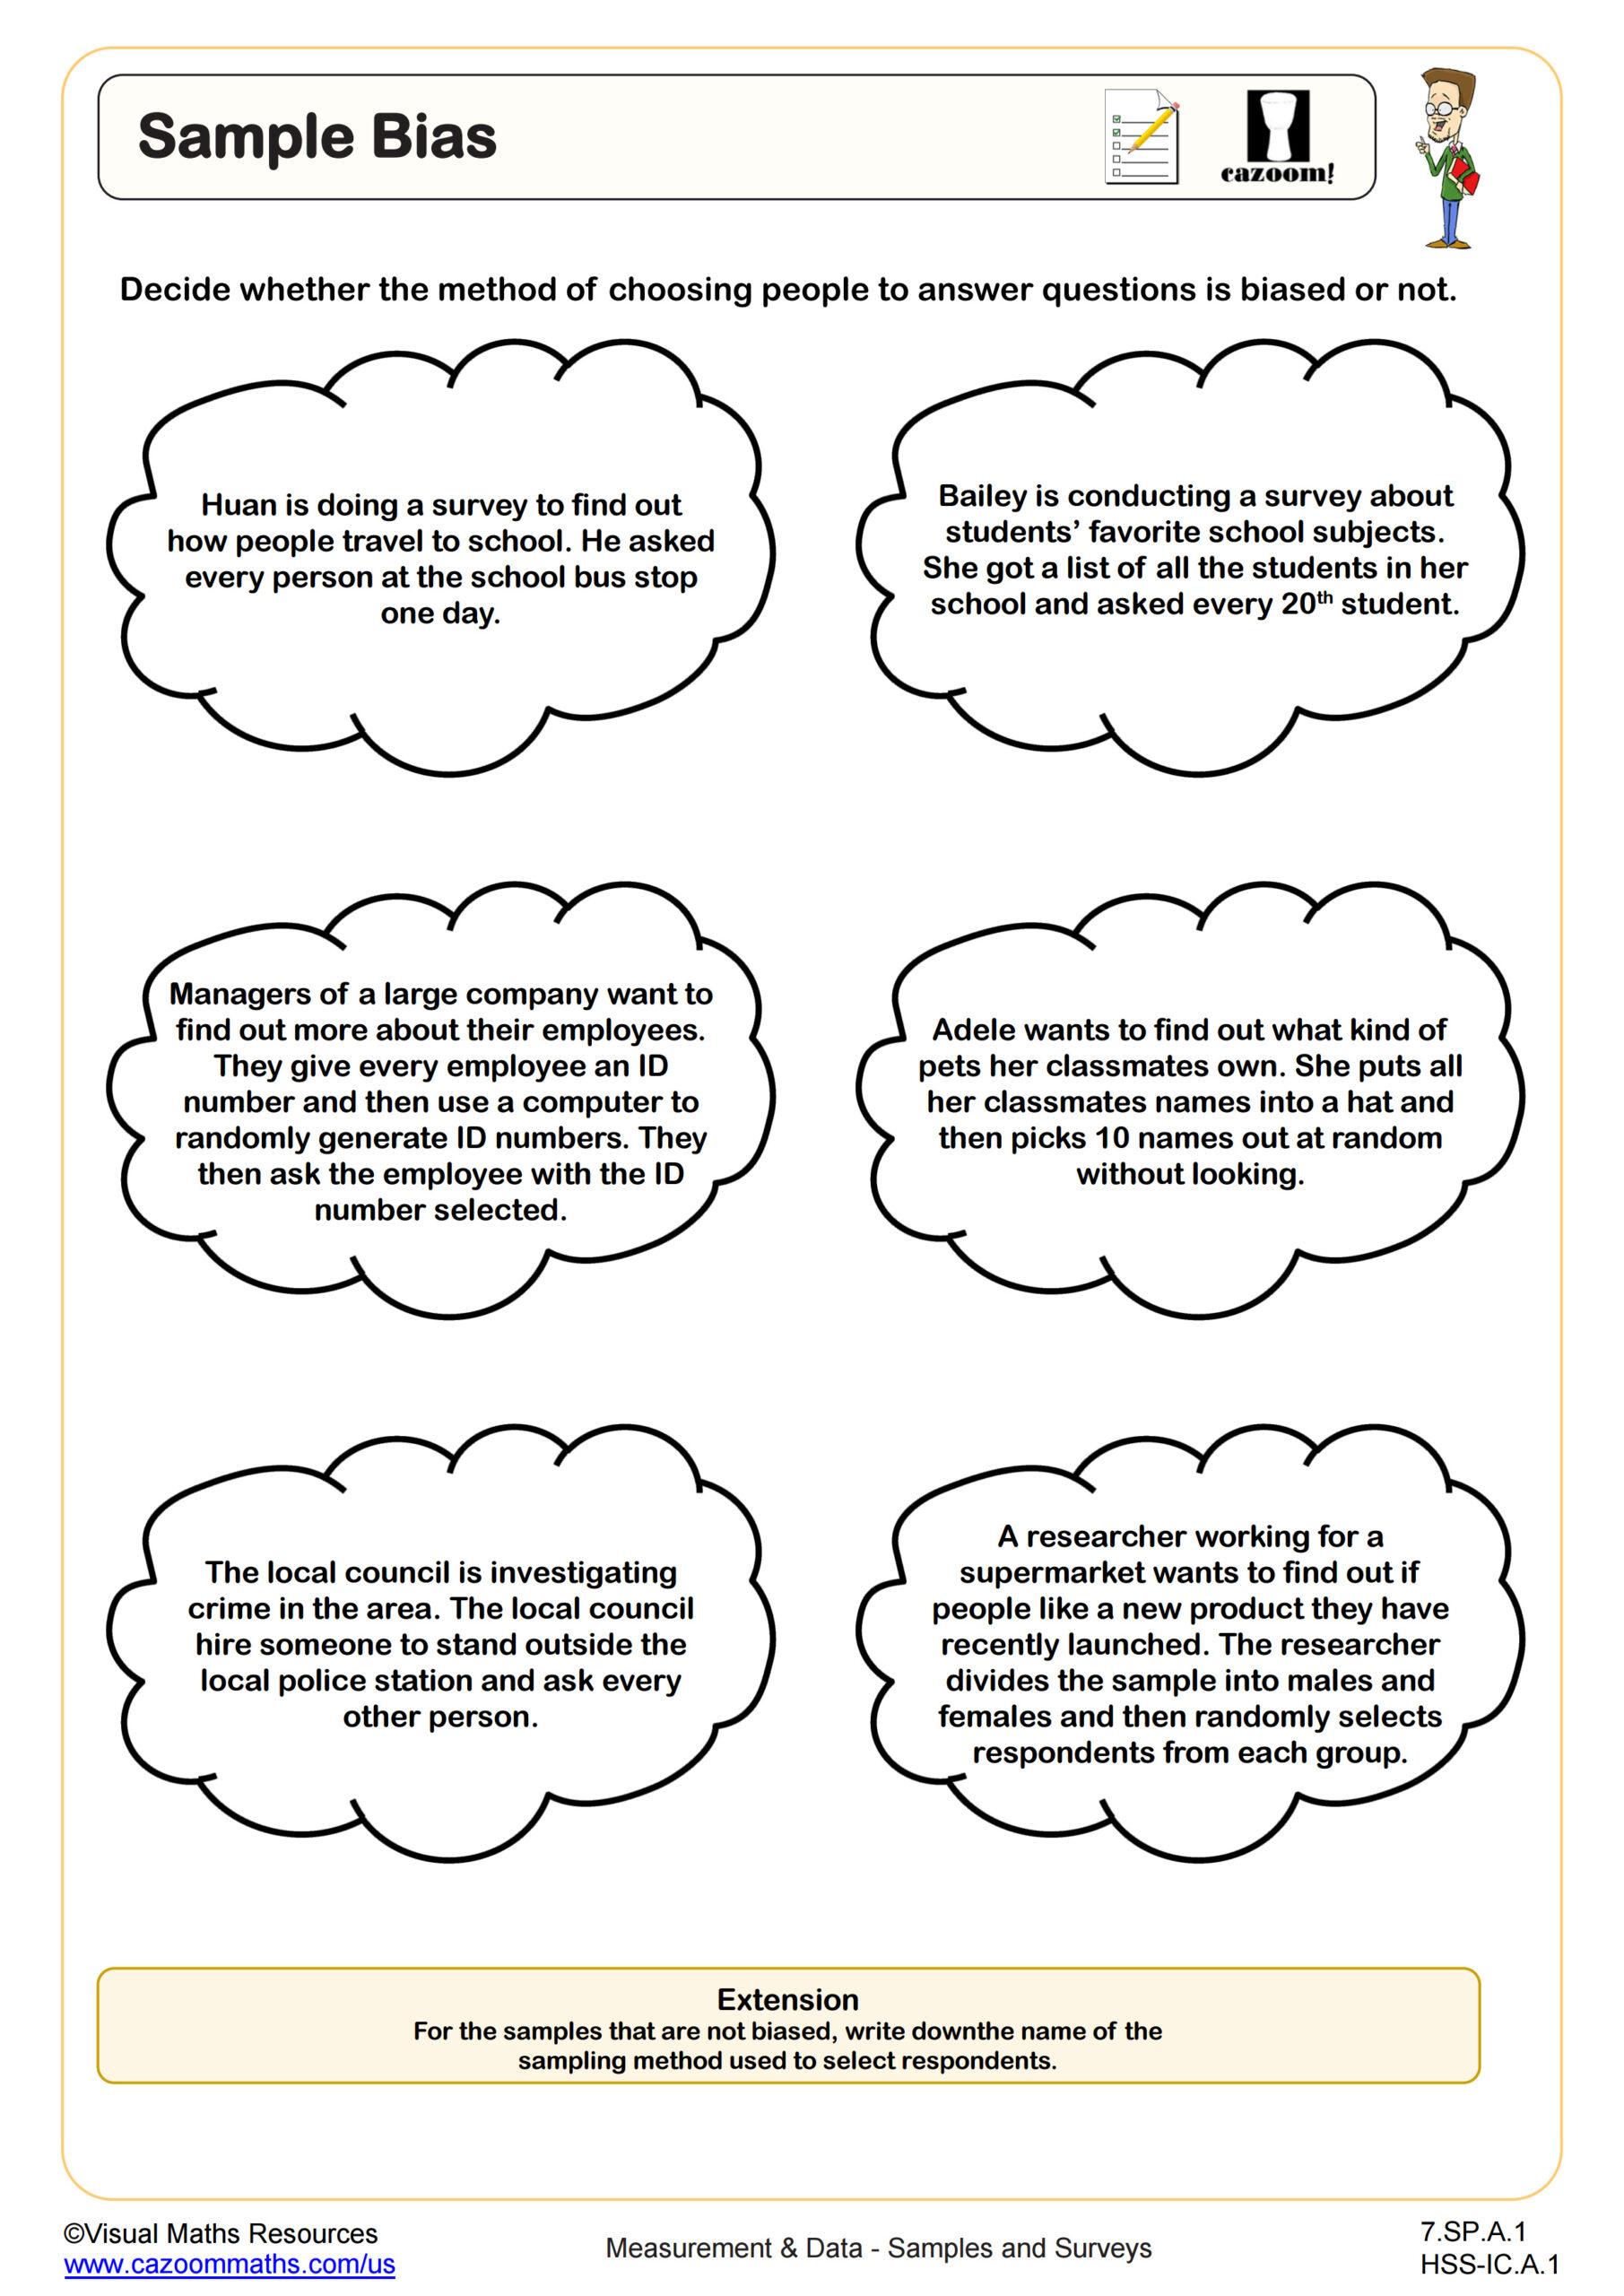
The SAT and ACT regularly include data analysis questions requiring students to evaluate sampling methods and identify flawed survey designs. Students must determine whether a sample accurately represents a population, recognize when convenience sampling creates bias, or explain why certain conclusions cannot be drawn from given data. State assessments typically present scenarios where students choose appropriate sampling methods or critique research designs, often within real-world contexts like school surveys or scientific studies.
Students lose points when they confuse sample size with sample quality, assuming larger samples always eliminate bias. A common error involves failing to recognize selection bias when samples are drawn from non-representative groups, such as surveying only volunteers or using responses from a single location. Standardized tests specifically target these misconceptions by presenting plausible but flawed sampling scenarios that require careful analysis of who was included and excluded from the sample.
What Is Stratified Sampling and Why Does It Matter?
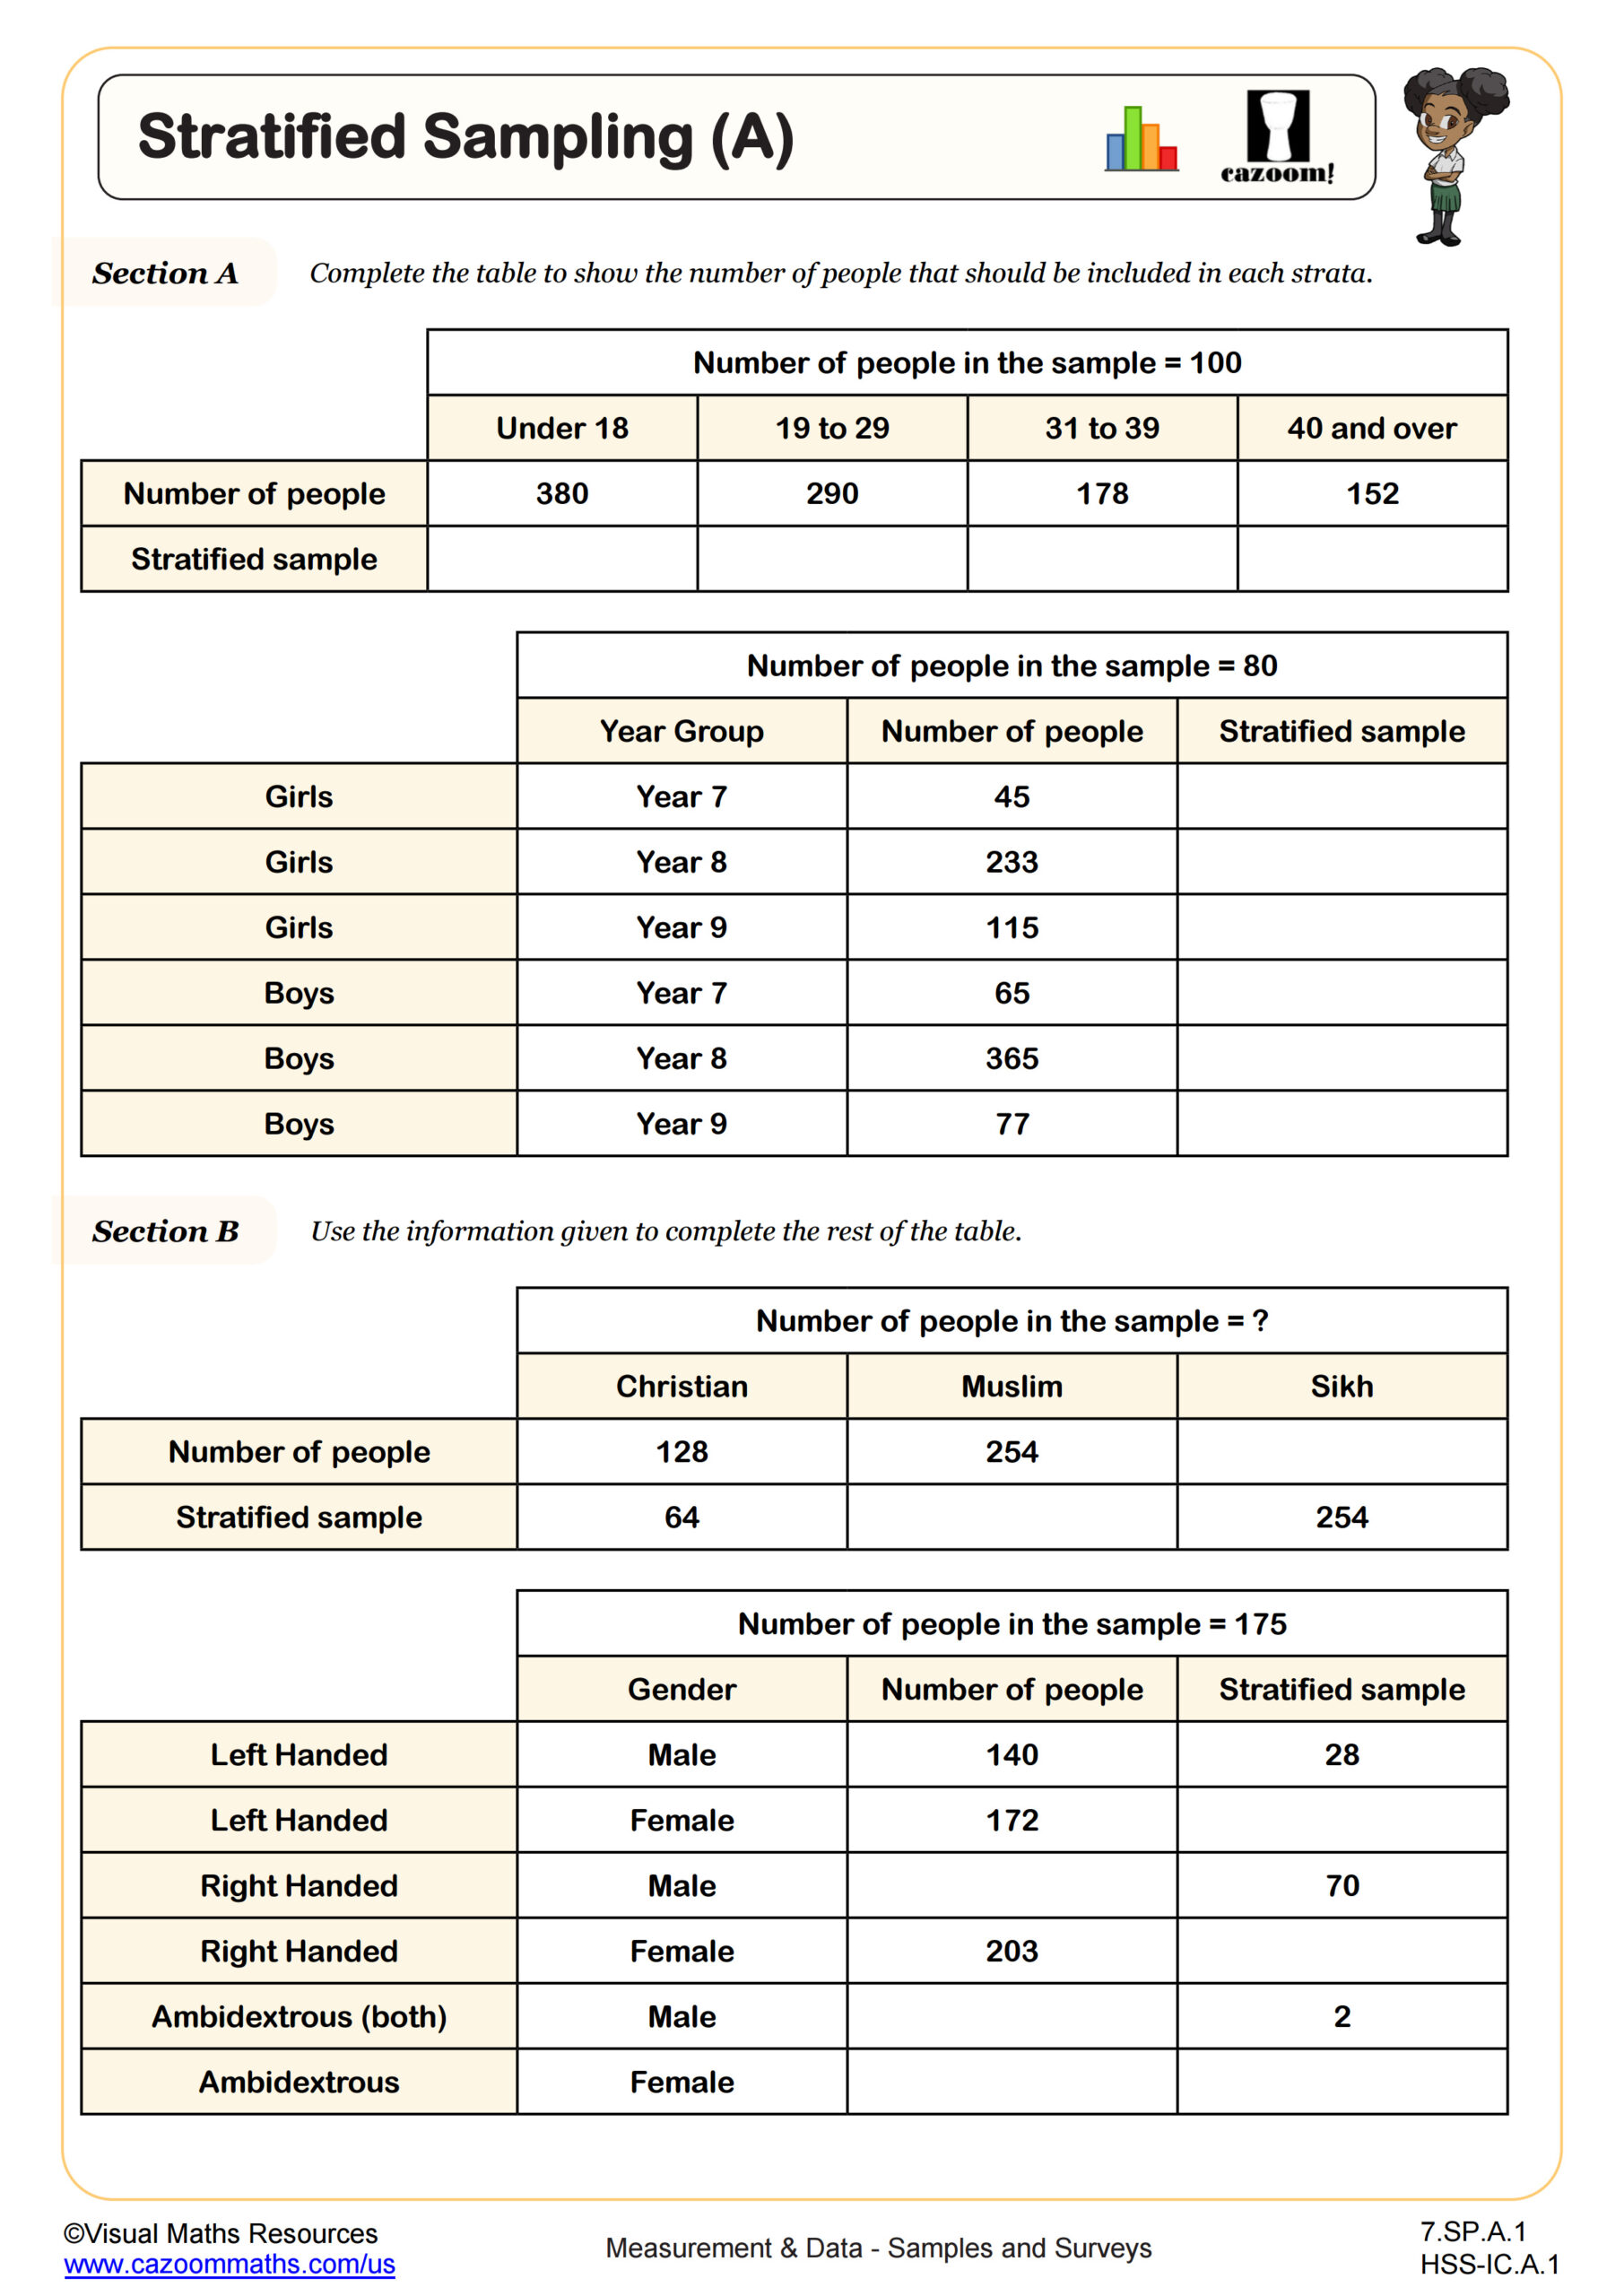
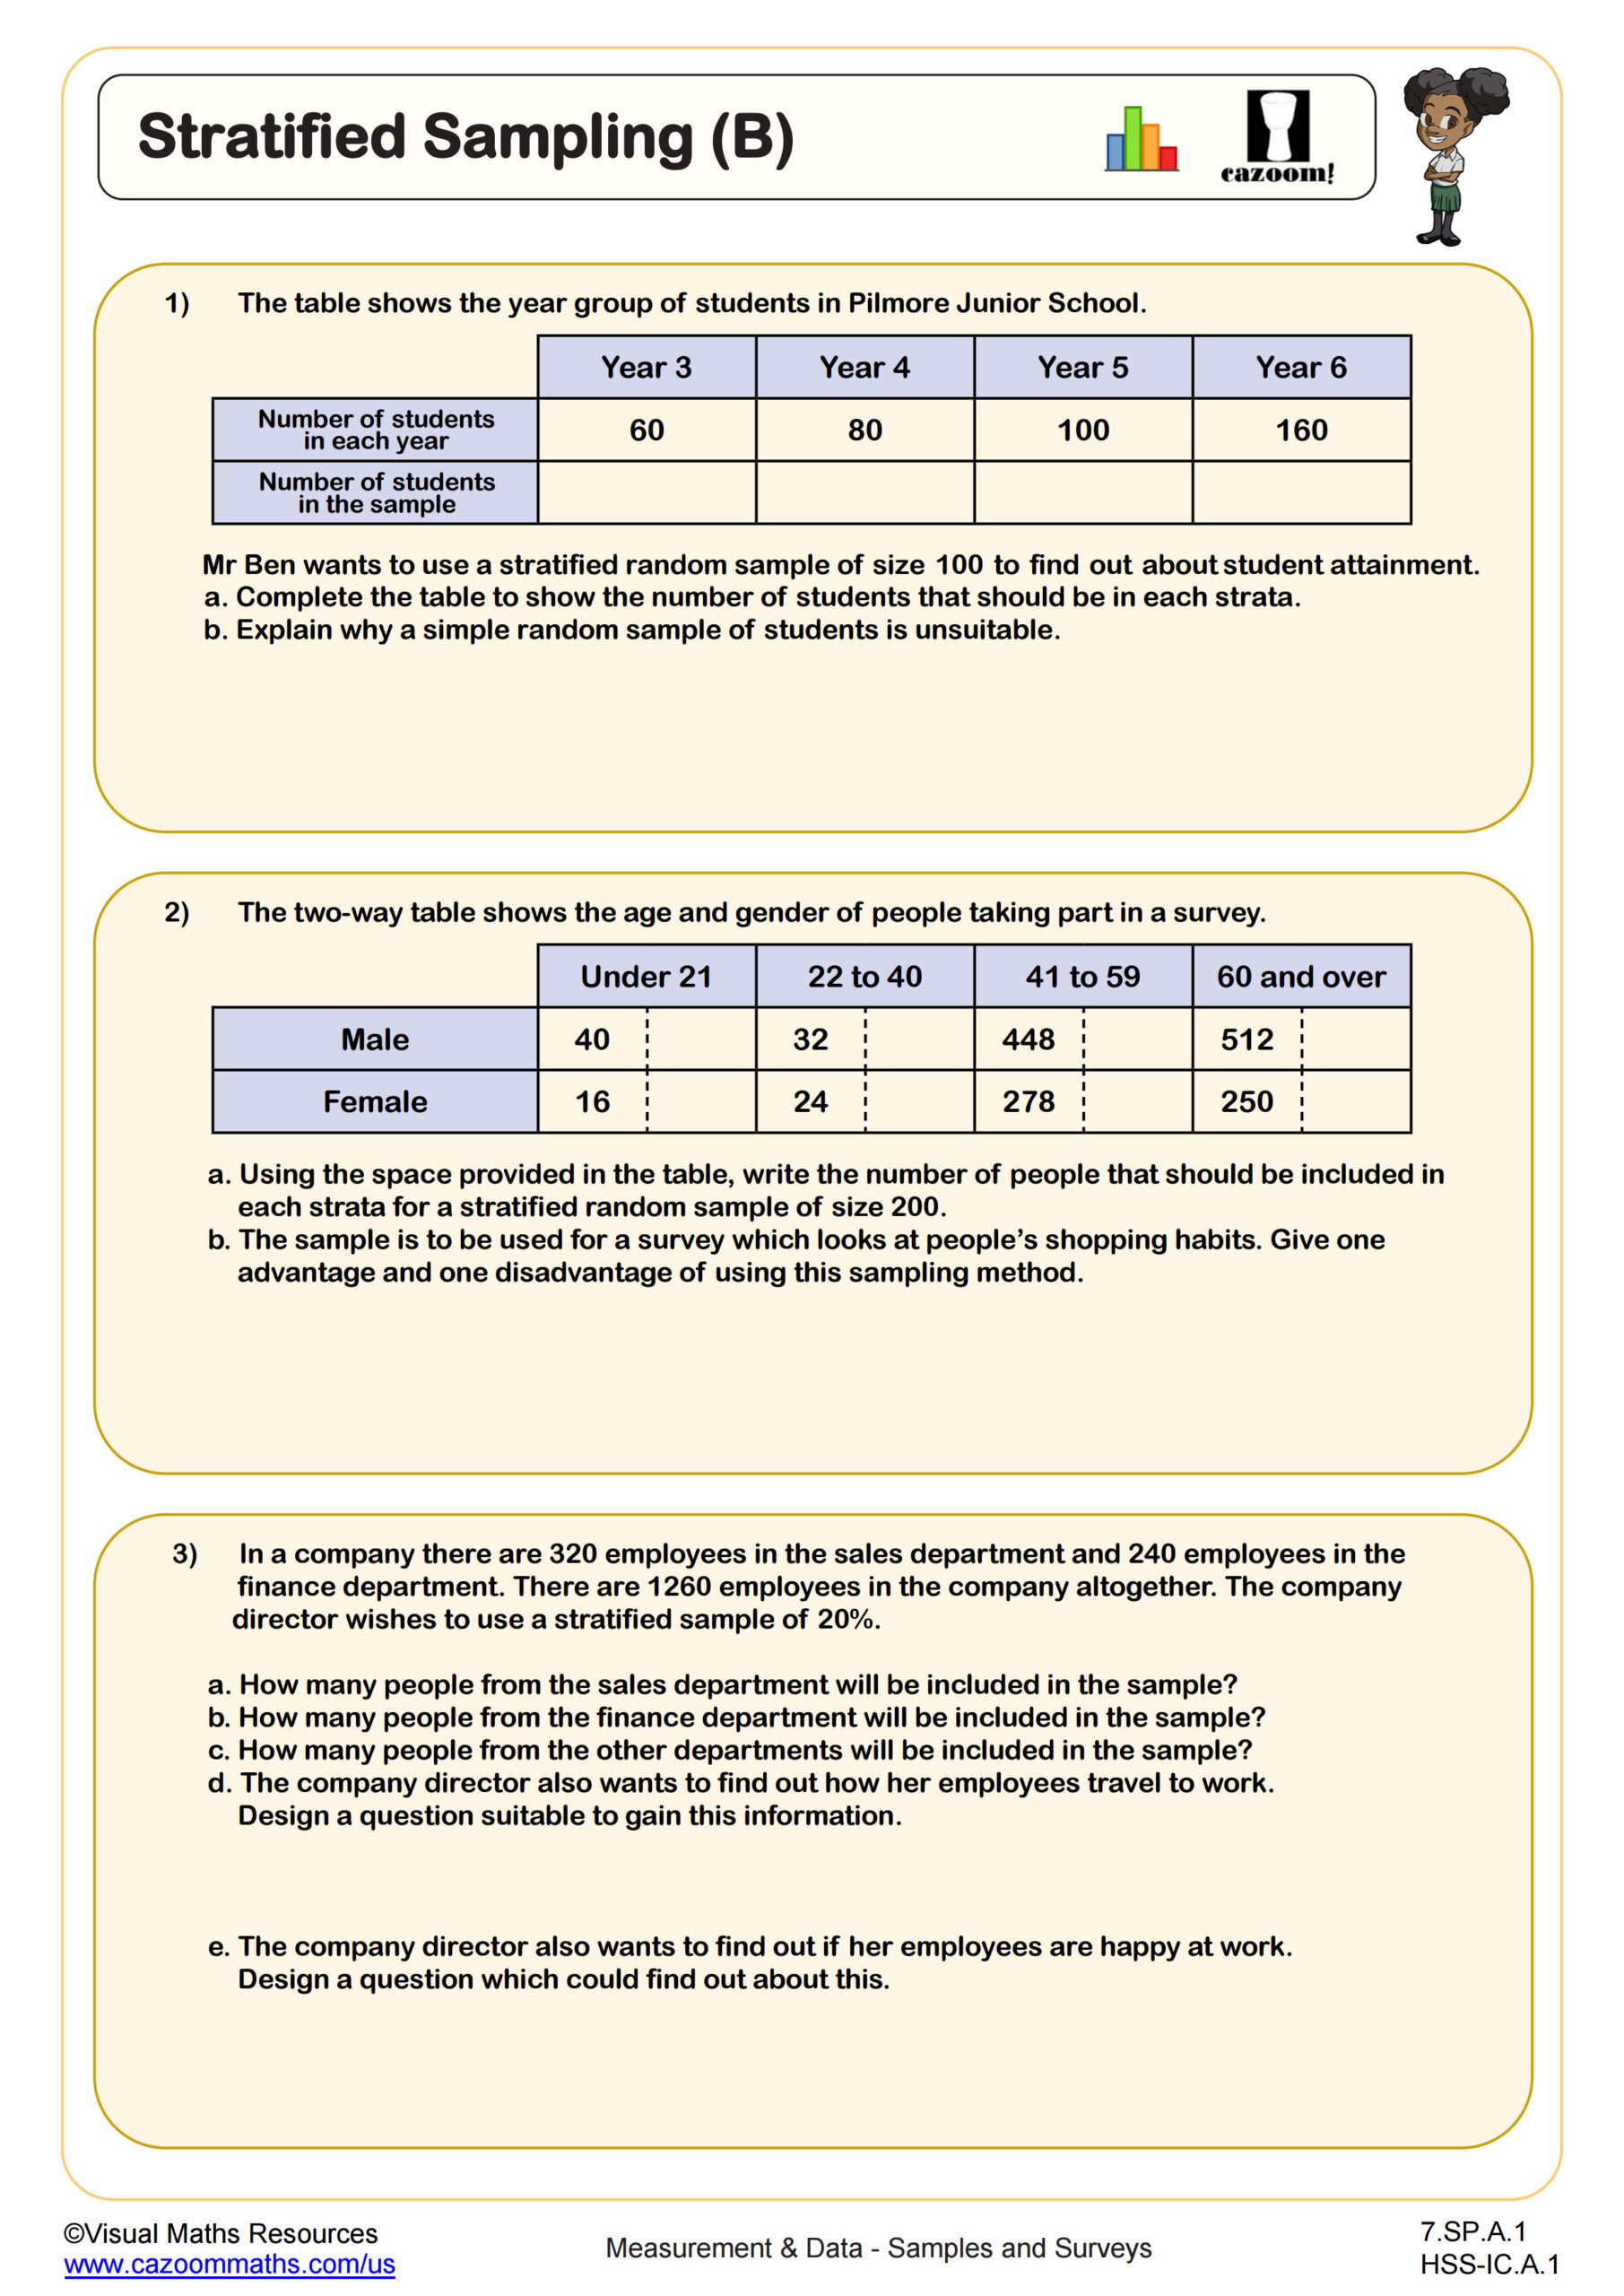
Stratified sampling divides a population into distinct subgroups, or strata, then randomly selects participants from each group proportionally. This method ensures that important demographic characteristics are properly represented in the sample, producing more accurate results than simple random sampling when populations have clear subgroups. Students learn to identify relevant strata such as grade level, geographic location, or demographic categories, then calculate appropriate sample sizes from each group to maintain proportional representation.
This technique directly applies to real-world research in medicine, marketing, and social science. Pharmaceutical companies use stratified sampling in clinical trials to ensure diverse patient populations are represented when testing new treatments. Environmental scientists stratify samples by ecosystem zones when studying wildlife populations. Students preparing for STEM careers encounter stratified sampling in college statistics courses and research methodology, making this foundational knowledge valuable beyond high school mathematics. The method demonstrates how thoughtful experimental design produces more reliable data than convenience-based approaches.
How Can Teachers Use These Samples and Surveys Worksheets in Geometry Class?
The worksheets provide scaffolded practice that builds from identifying obvious bias to analyzing subtle flaws in survey design and sampling methods. Teachers report that starting with clear examples of sample bias helps students develop pattern recognition skills they then apply to more complex stratified sampling problems. The progression from basic identification to method comparison allows students at different skill levels to engage meaningfully with statistical reasoning concepts that support data analysis throughout the curriculum.
Many teachers use these worksheets during statistics units as formative assessments or intervention tools when students struggle with data interpretation on practice tests. The answer keys enable independent practice or paired peer review activities where students justify their reasoning about bias and sampling validity. Because these concepts appear on both the SAT and ACT, the worksheets serve as targeted test preparation while reinforcing critical thinking skills that transfer to science lab design, social studies research projects, and AP Statistics coursework.