Geometry Stem and Leaf Diagrams Worksheets
All worksheets are created by the team of experienced teachers at Cazoom Math.
What Do Stem and Leaf Diagrams Cover in High School Geometry?
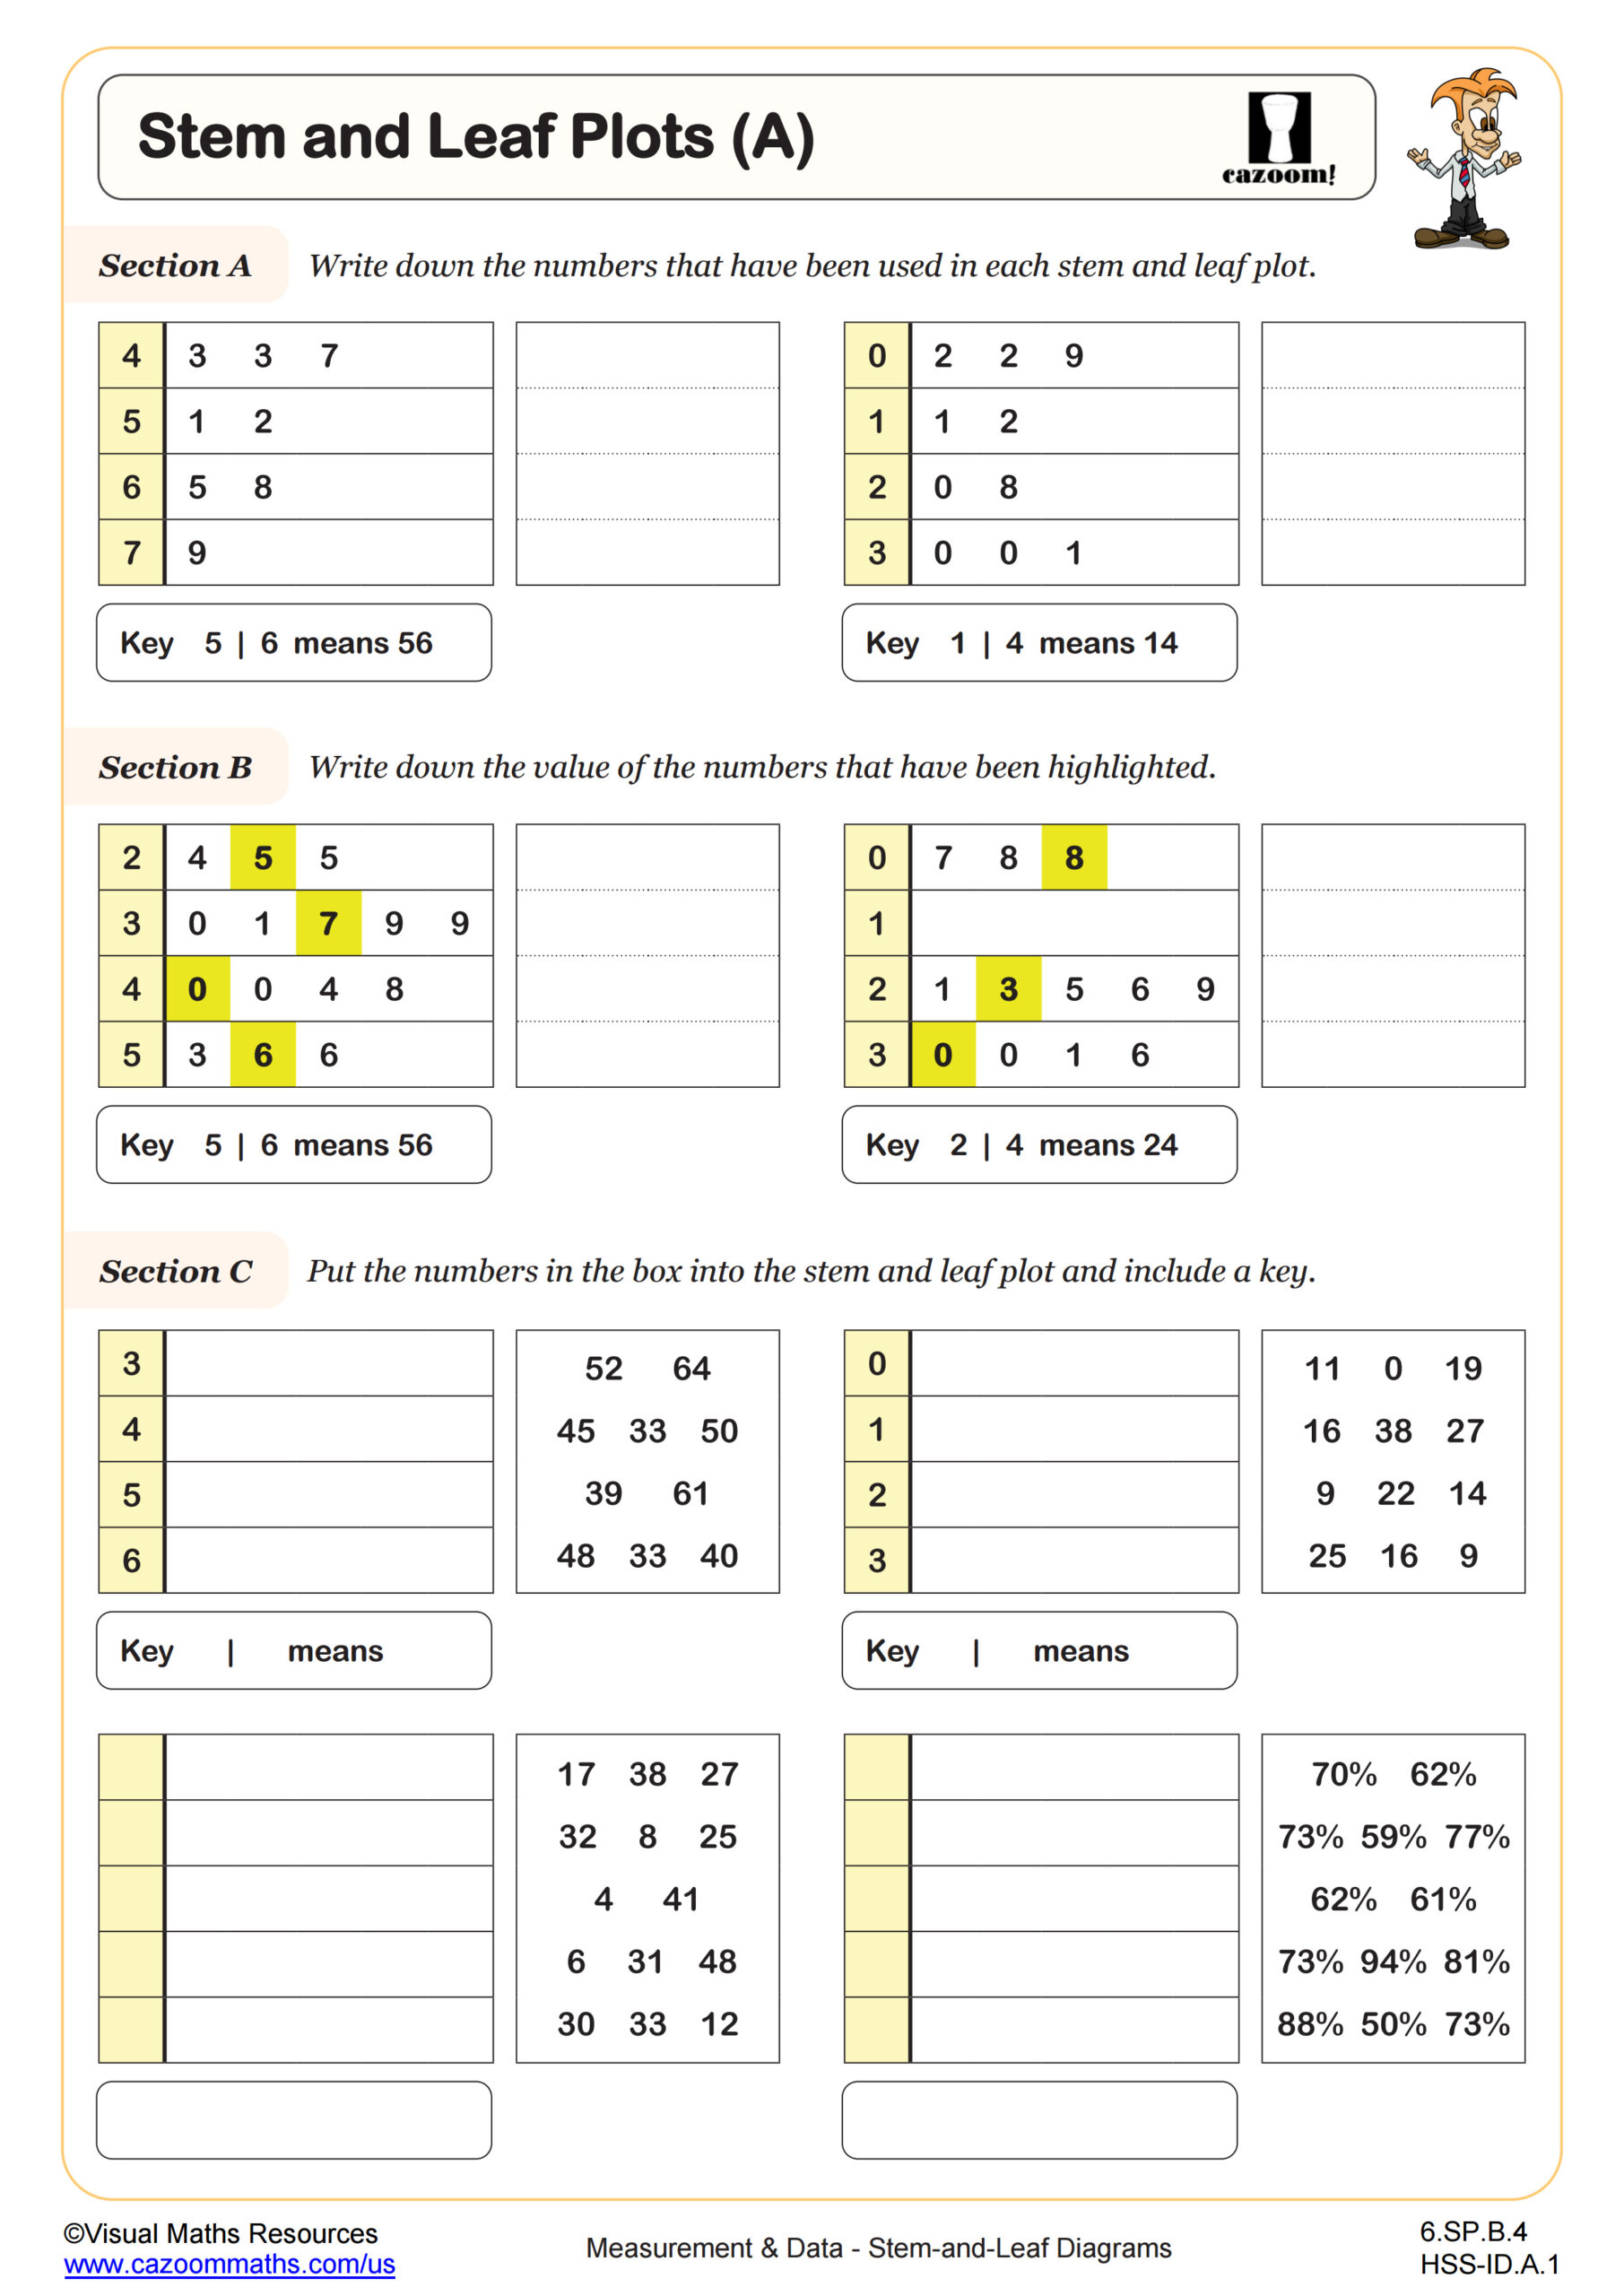
Stem and leaf diagrams in Geometry typically focus on organizing data sets to analyze measurements, dimensions, and experimental results. Students practice splitting numerical values into stems (leading digits) and leaves (trailing digits), arranging data in ascending order, and creating back-to-back stem and leaf plots to compare two related data sets. This topic connects directly to statistical concepts that support geometric problem-solving, particularly when students collect measurement data during hands-on investigations.
A common error occurs when students forget to reorder the leaves from smallest to largest within each stem, which disrupts the visual clarity of the distribution. Teachers notice that students who understand place value concepts transition more smoothly to stem and leaf construction, recognizing immediately how the tens digit becomes the stem and the ones digit forms the leaf in two-digit datasets.
How Do Stem and Leaf Diagrams Appear on the SAT and State Assessments?
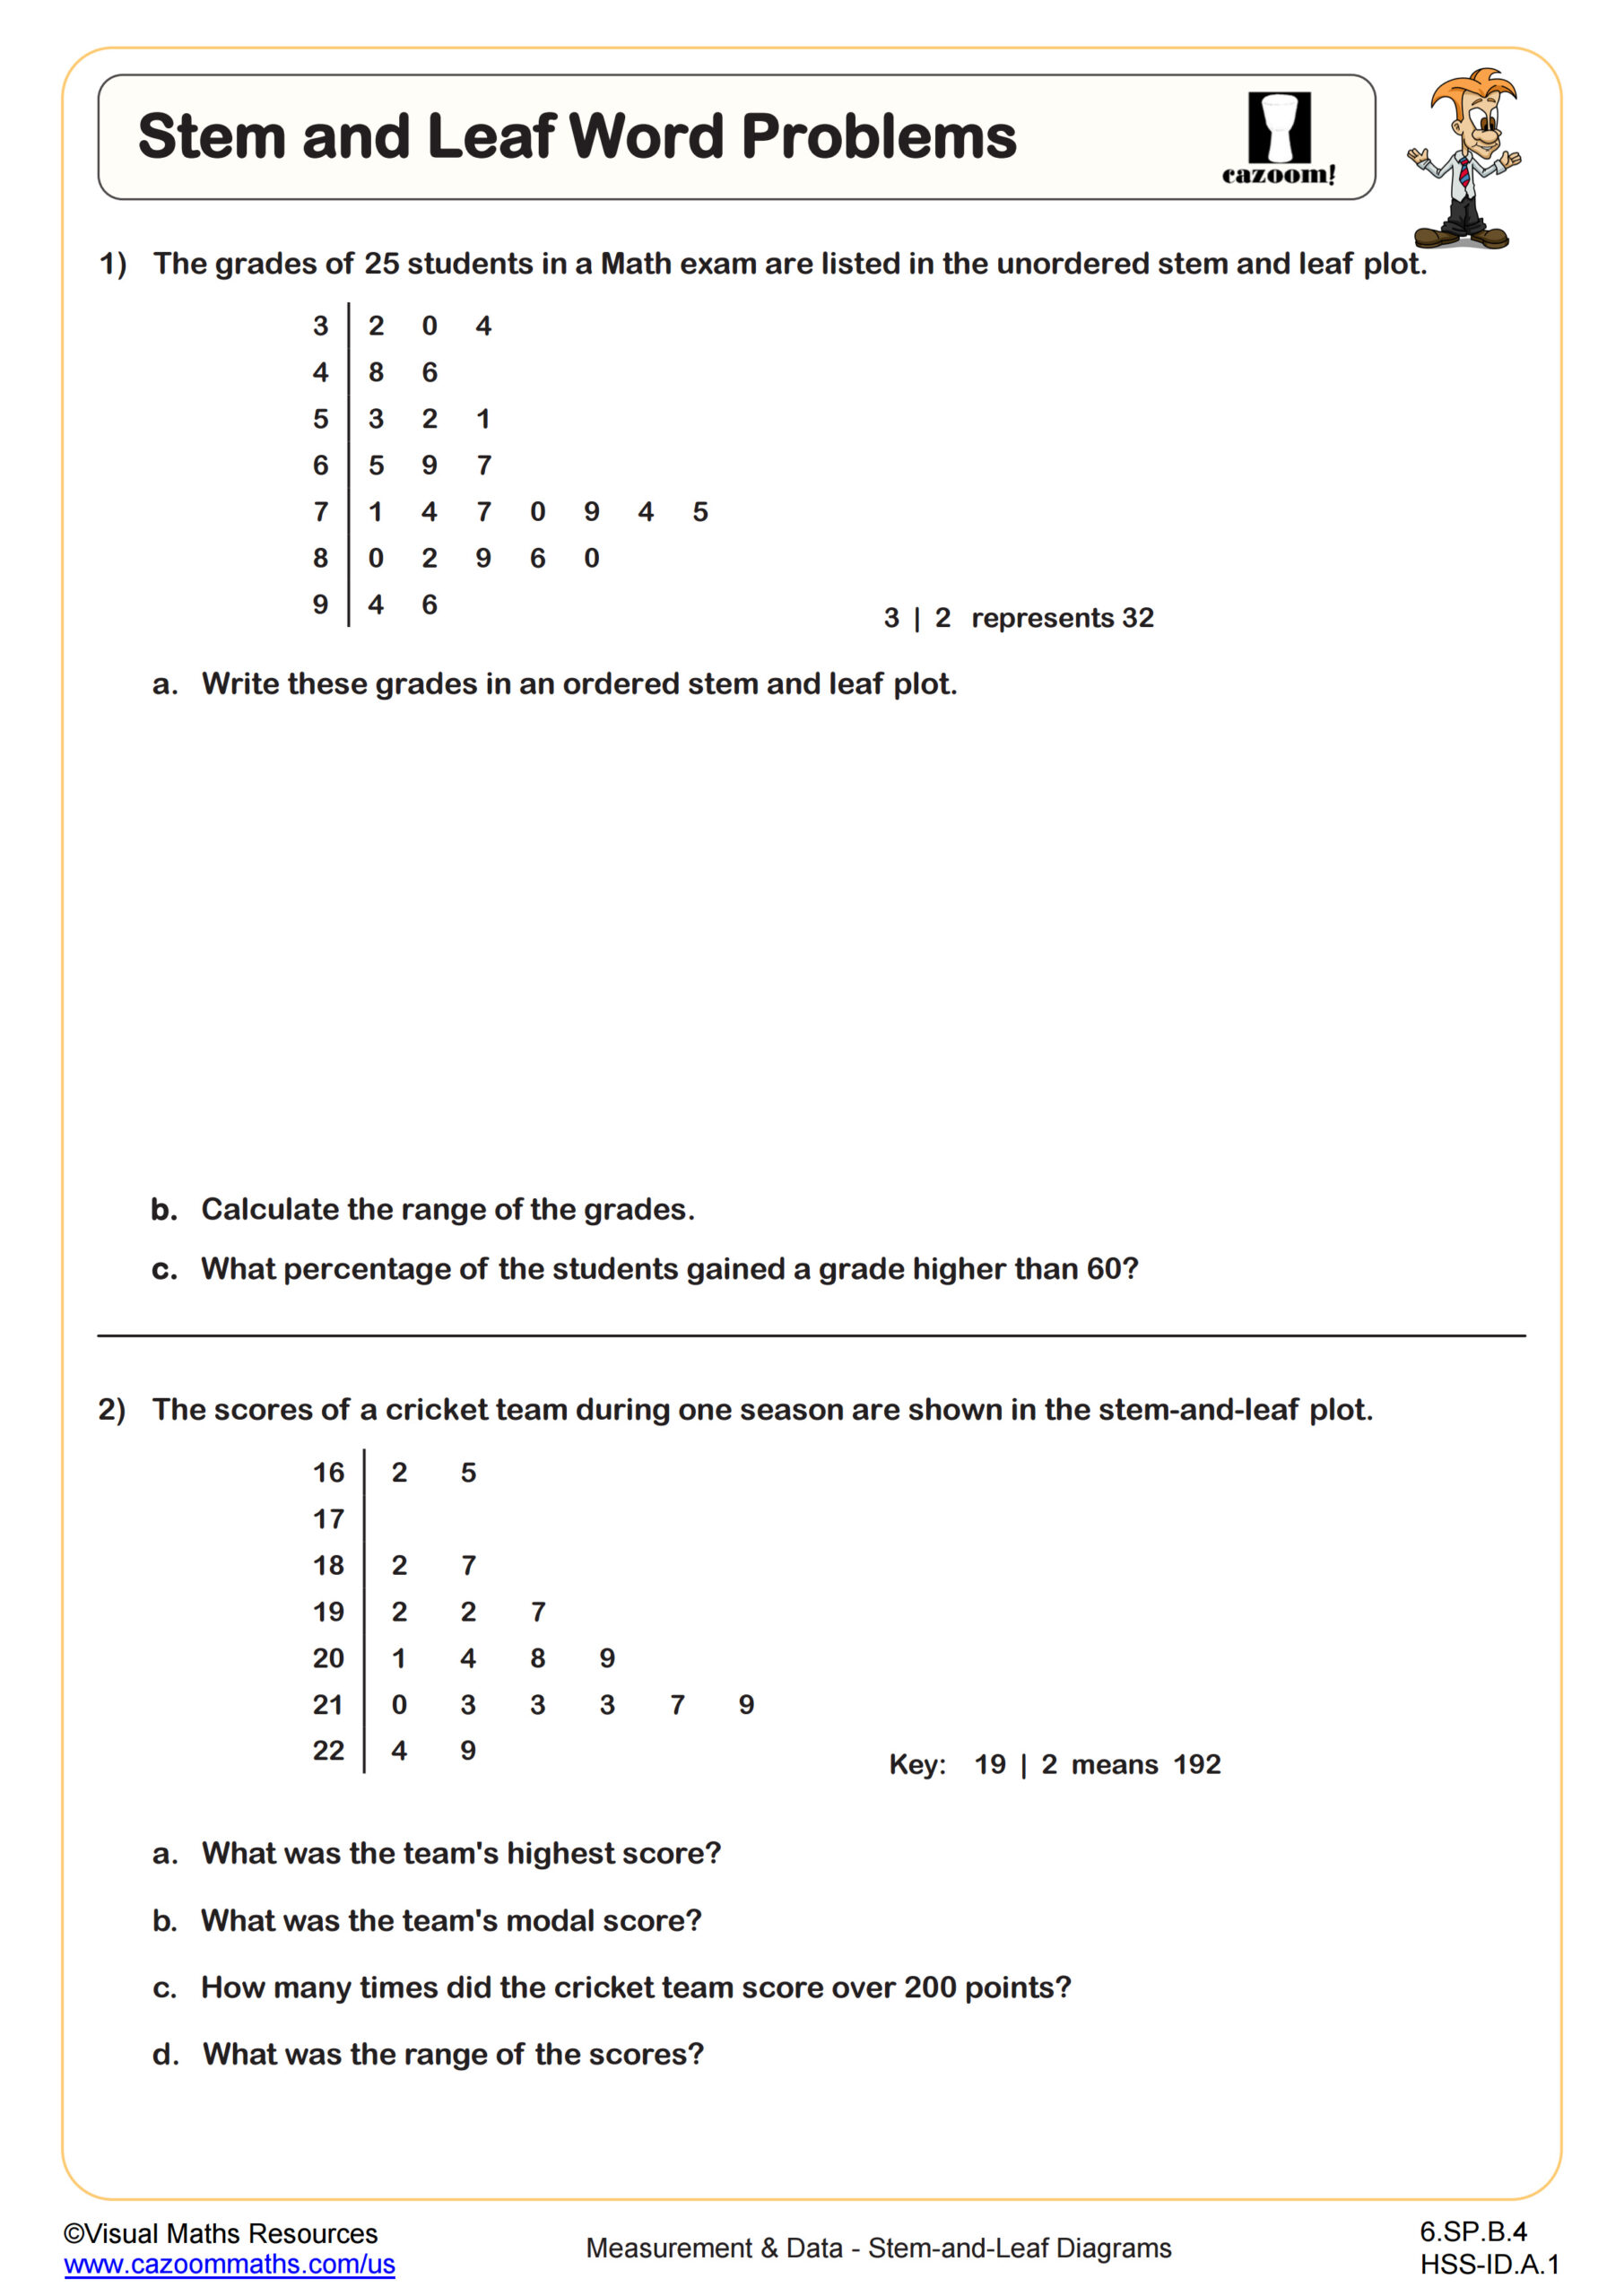
Standardized tests like the SAT and state assessments present stem and leaf diagrams within data analysis questions that require students to find median, mode, range, or identify specific data values from the plot. Test questions often ask students to interpret an existing stem and leaf plot rather than construct one from scratch, focusing on reading comprehension and statistical reasoning. Students must demonstrate they can extract individual data points and perform calculations using values displayed in stem and leaf format.
Students lose points when they misread the key or legend that explains how stems and leaves combine to form actual values. Another frequent mistake involves counting the number of data points incorrectly when finding the median, especially in larger datasets where careful counting becomes critical. Teachers report that timed practice with interpretation questions helps students develop the quick recognition skills needed for test success.
How Do Students Create Back-to-Back Stem and Leaf Plots?
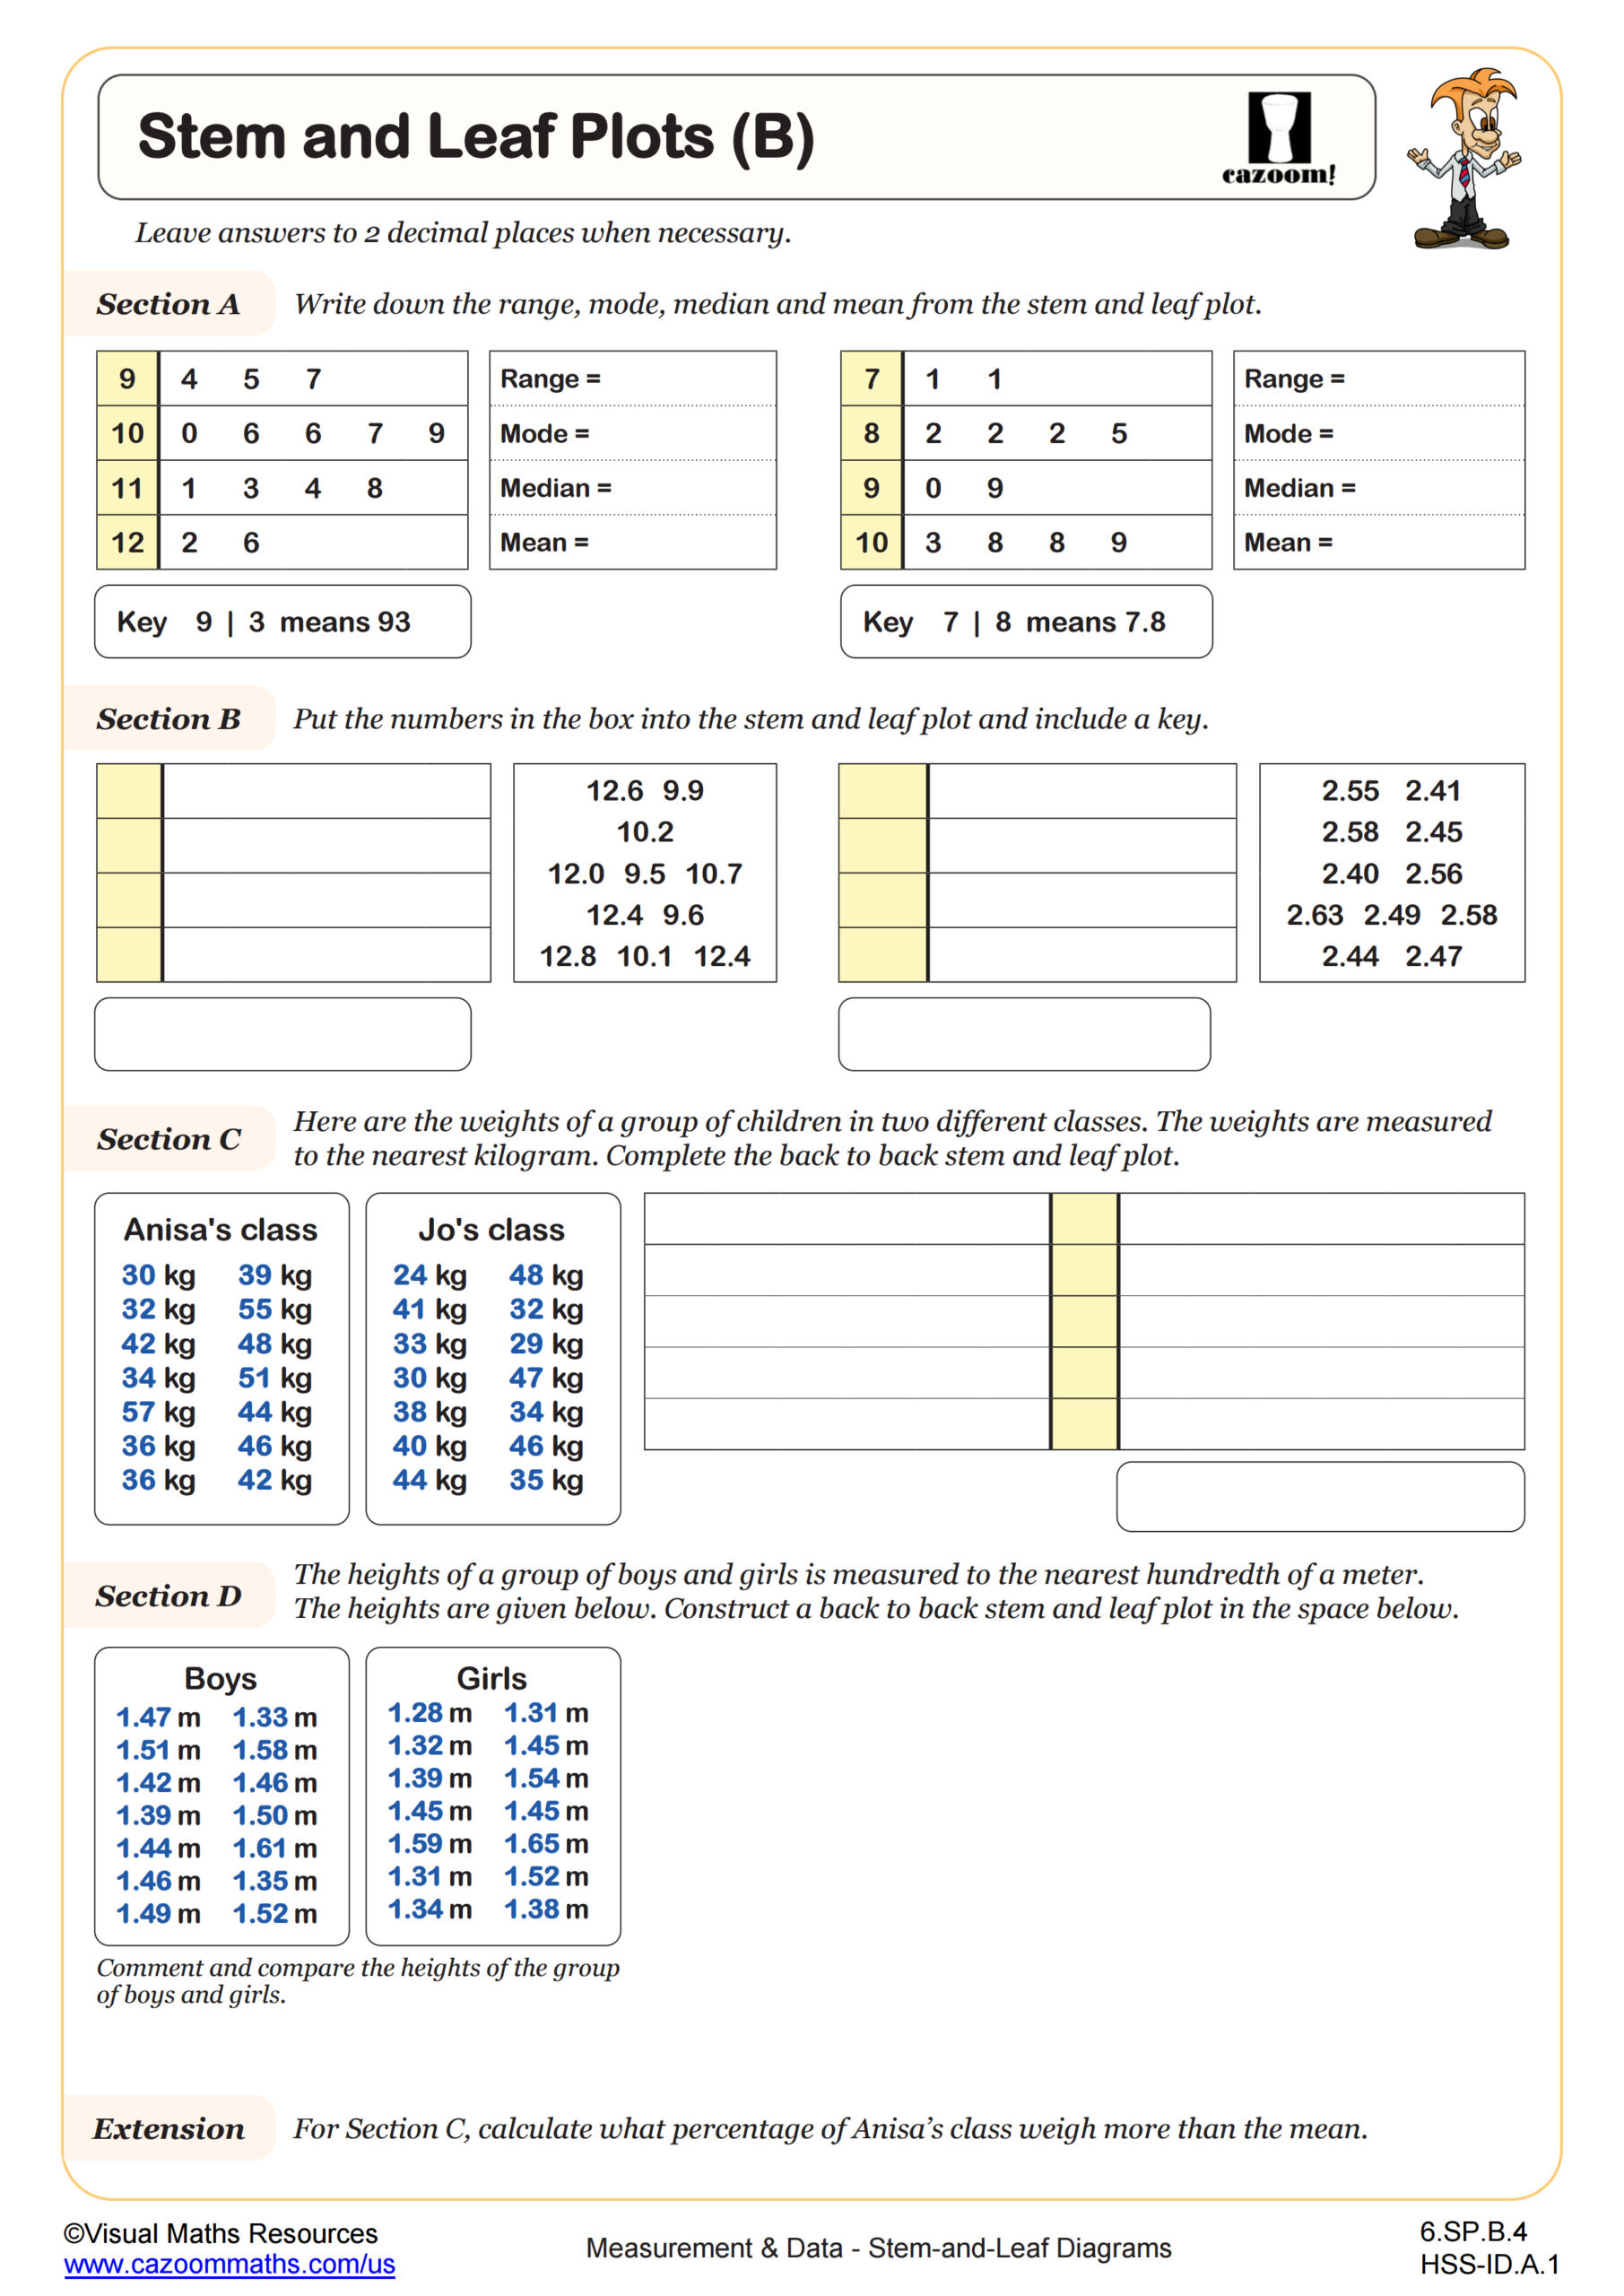
Back-to-back stem and leaf plots display two related datasets side by side, sharing a common stem column in the center with leaves extending in opposite directions. Students arrange one dataset's leaves to the left of the stem and the second dataset's leaves to the right, maintaining ascending order within each stem row. This format allows direct visual comparison between two groups, making it easier to identify differences in center, spread, and shape between distributions.
This visualization method appears in STEM fields when comparing experimental results, such as comparing reaction times between two groups in a biology study or analyzing measurement precision across different testing conditions. Environmental scientists use back-to-back stem and leaf plots to compare pollution levels before and after interventions, while quality control engineers compare product dimensions from different manufacturing shifts to identify consistency patterns.
How Can Teachers Use These Stem and Leaf Diagram Worksheets in Geometry Class?
These worksheets provide structured practice moving from basic stem and leaf construction to more complex interpretation tasks and word problems that require students to extract information from completed plots. The progression helps students develop both technical skills in organizing data and analytical skills in recognizing patterns, outliers, and distribution characteristics. Word problem worksheets particularly strengthen the connection between abstract plots and real measurement scenarios that Geometry students encounter.
Teachers use these resources for quick warm-up activities when reviewing data analysis before state assessments, as homework assignments that reinforce classroom instruction, or as station activities where students work in pairs to check each other's plots against the answer keys. The worksheets work well for differentiated instruction since struggling students can focus on construction basics while advanced students tackle comparison problems that require deeper statistical reasoning about shape and spread.