Geometry Two-Way Tables and Pictograms Worksheets
All worksheets are created by the team of experienced teachers at Cazoom Math.
What Do Students Learn with Two-Way Tables and Pictographs in Geometry?
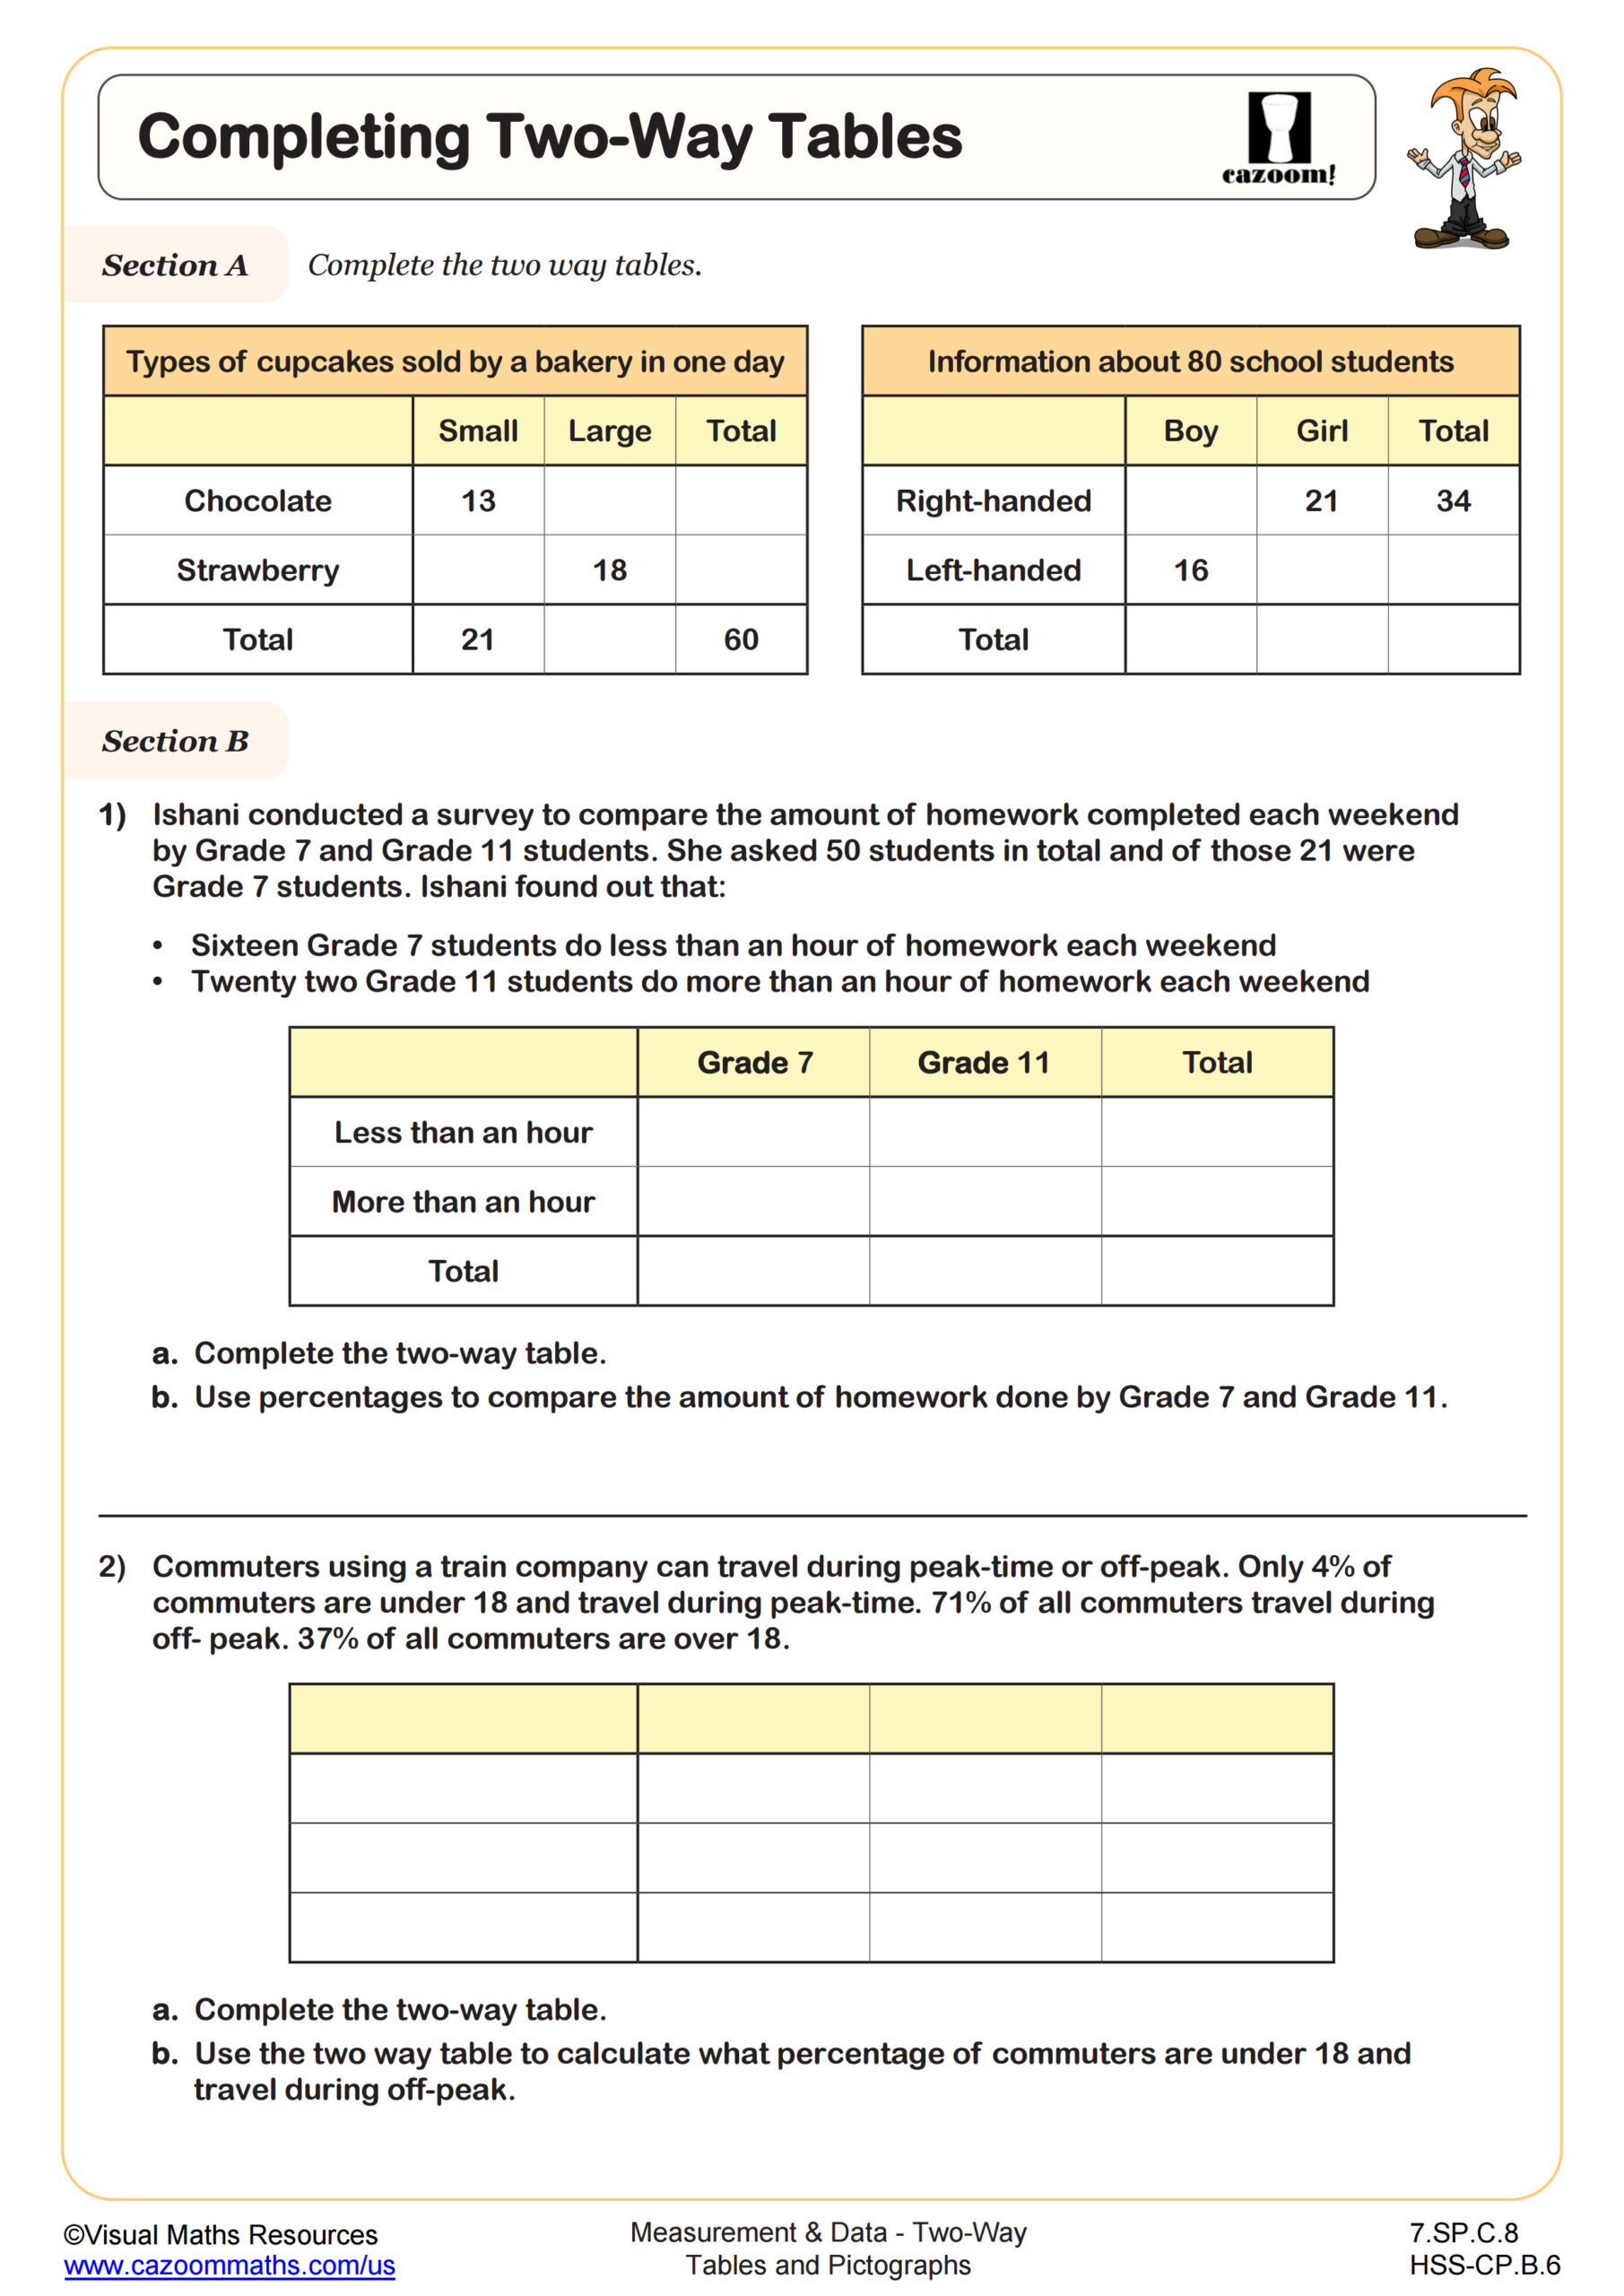
Students learn to organize bivariate categorical data into two-way frequency tables and interpret pictographs that use symbols to represent quantities. While these topics connect more closely to statistics standards, many geometry courses incorporate data analysis as students prepare for standardized assessments. The work includes completing partial tables using given totals, creating pictographs with appropriate scales, and calculating probabilities from organized data.
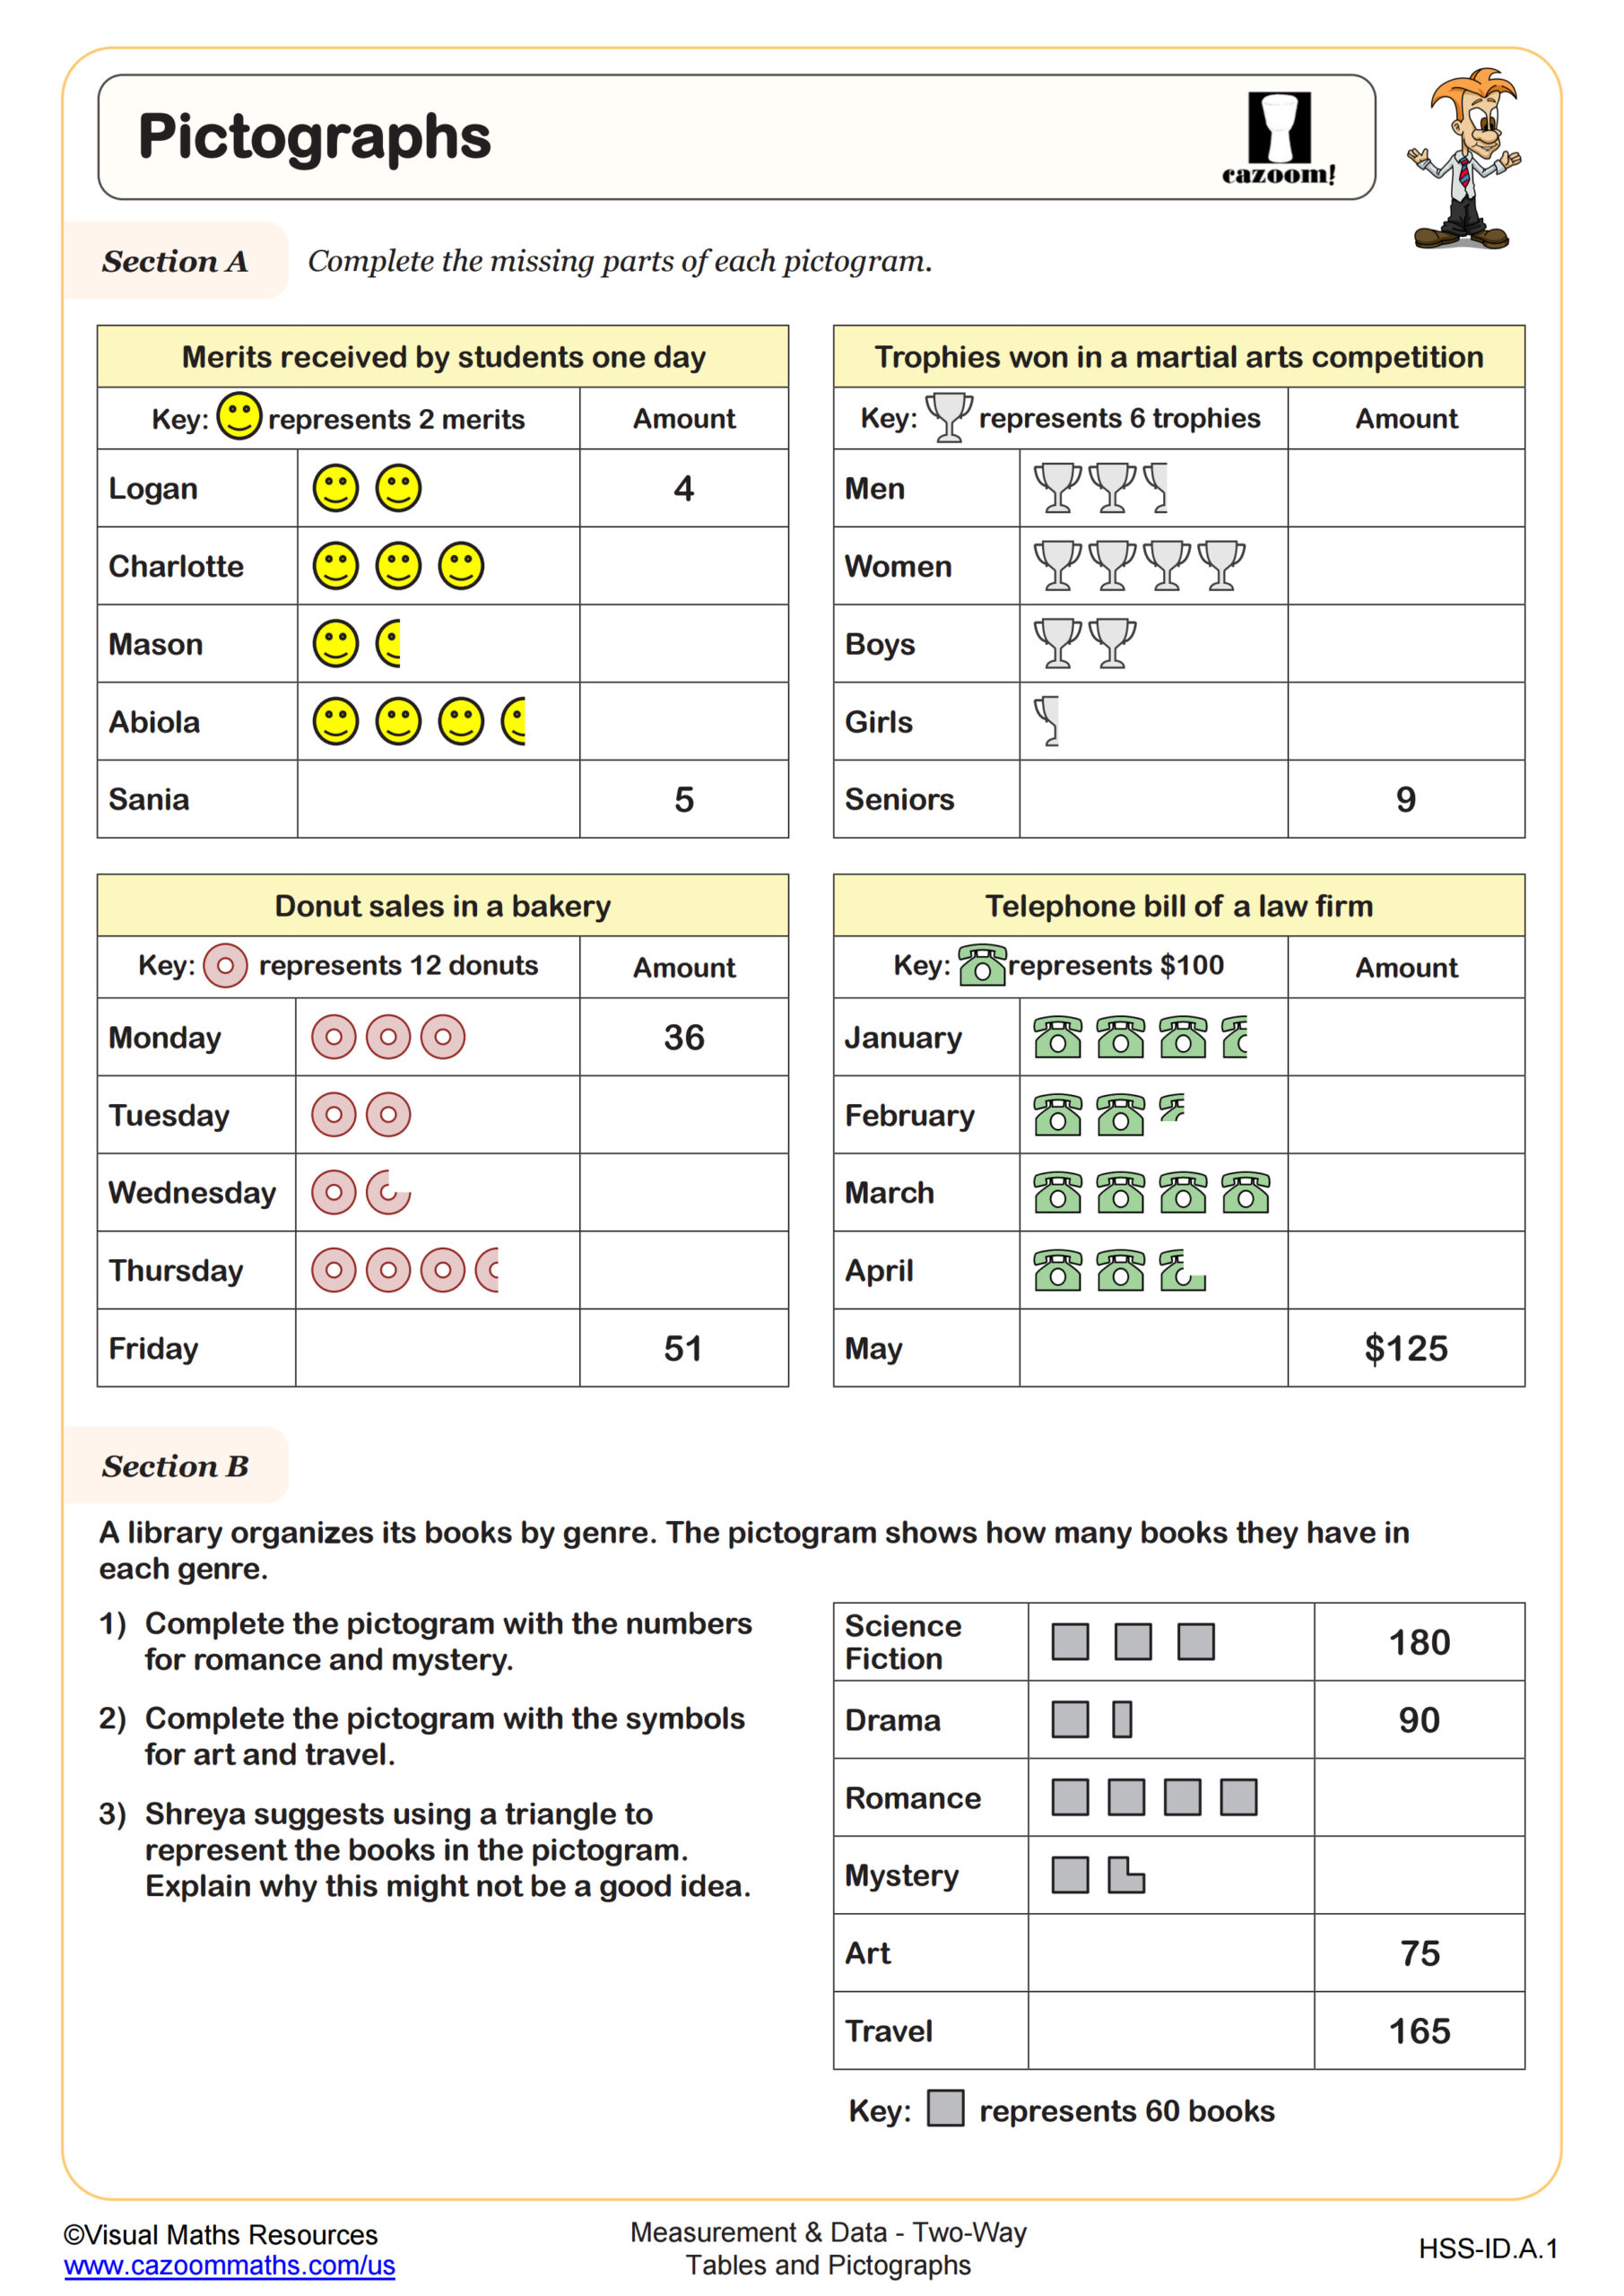
A common mistake occurs when students add frequencies incorrectly because they don't verify that row totals plus column totals should equal twice the grand total (since each data point gets counted in both a row and a column). Teachers frequently notice students rushing through pictograph keys without checking whether their symbol represents a reasonable quantity for the context, leading to scales like "one symbol equals 0.3 people."
How Do Two-Way Tables Appear on the SAT and ACT?
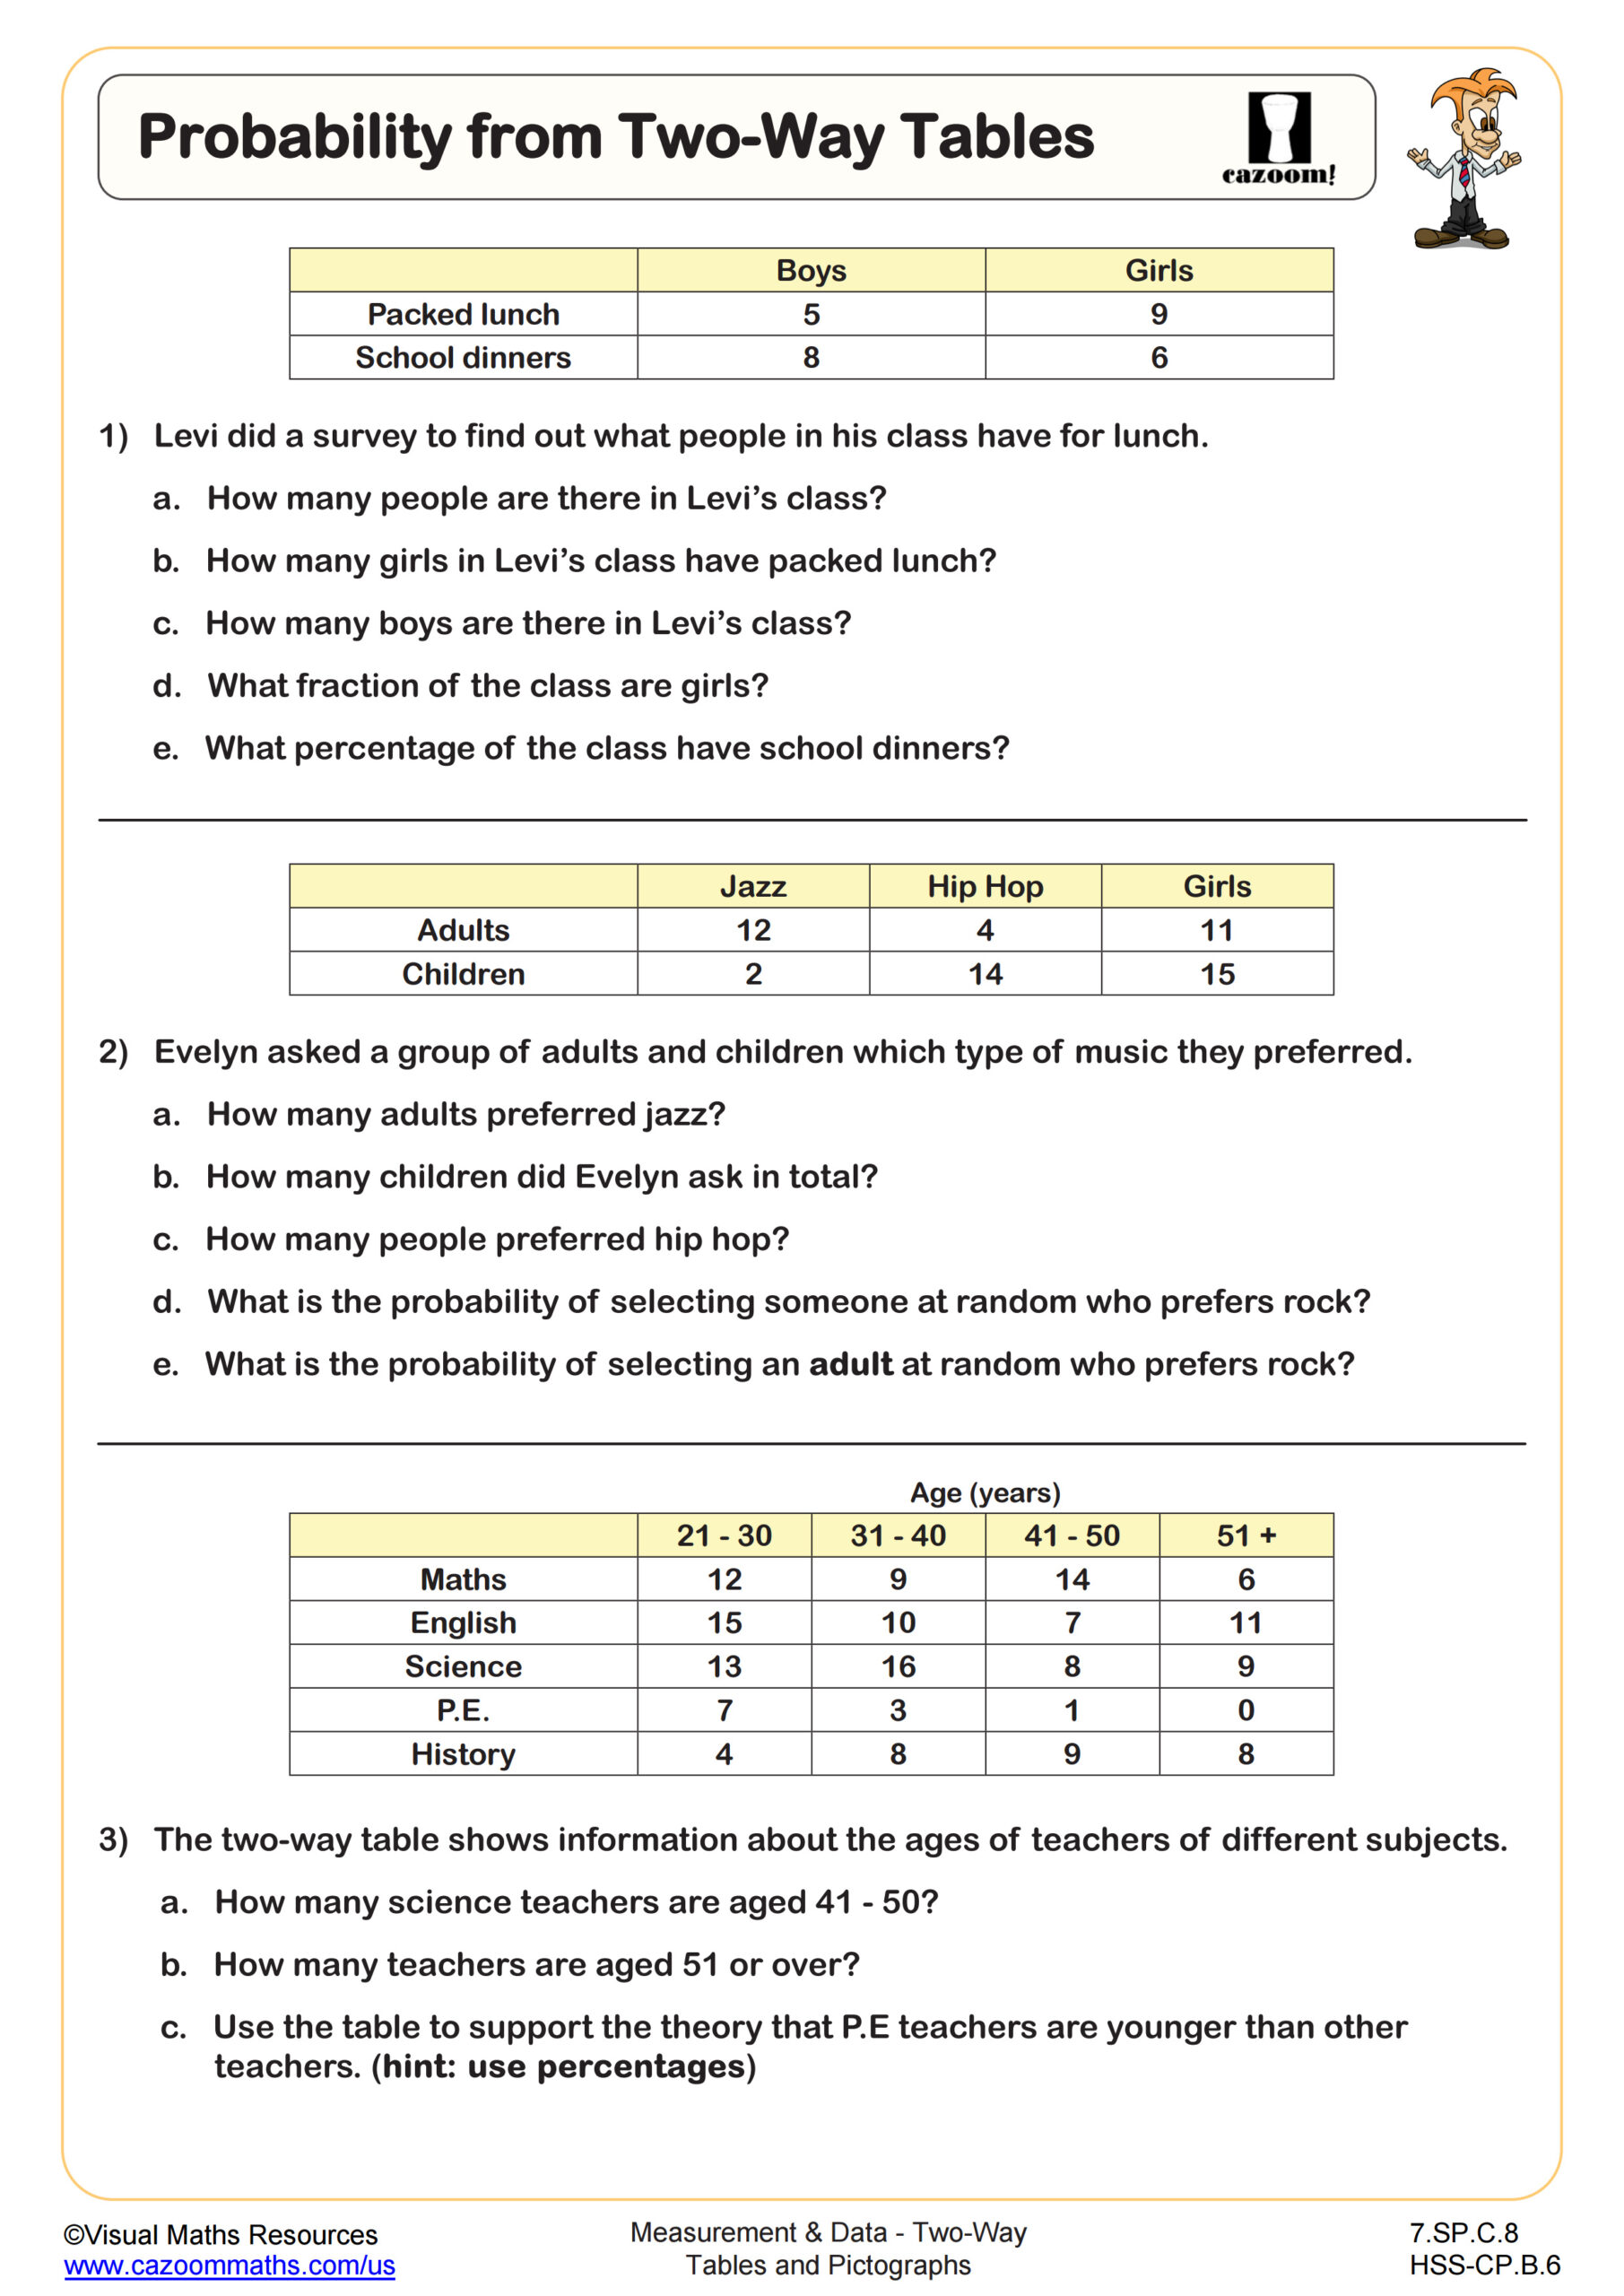
Both the SAT and ACT include questions requiring students to interpret two-way tables and calculate conditional probabilities. Test questions typically provide a completed table with real-world context (survey results, demographic data, or experimental outcomes) and ask students to find probabilities, compare groups, or identify relationships between variables. The ACT particularly favors questions about relative frequencies and conditional probability expressed as percentages.
Students lose points when they confuse conditional probability with joint probability, such as finding P(A and B) when the question asks for P(A given B). Another frequent error occurs when students calculate probabilities using row totals instead of the grand total, or fail to reduce fractions to simplest form. Standardized tests expect students to move fluidly between fraction, decimal, and percentage representations of the same probability.
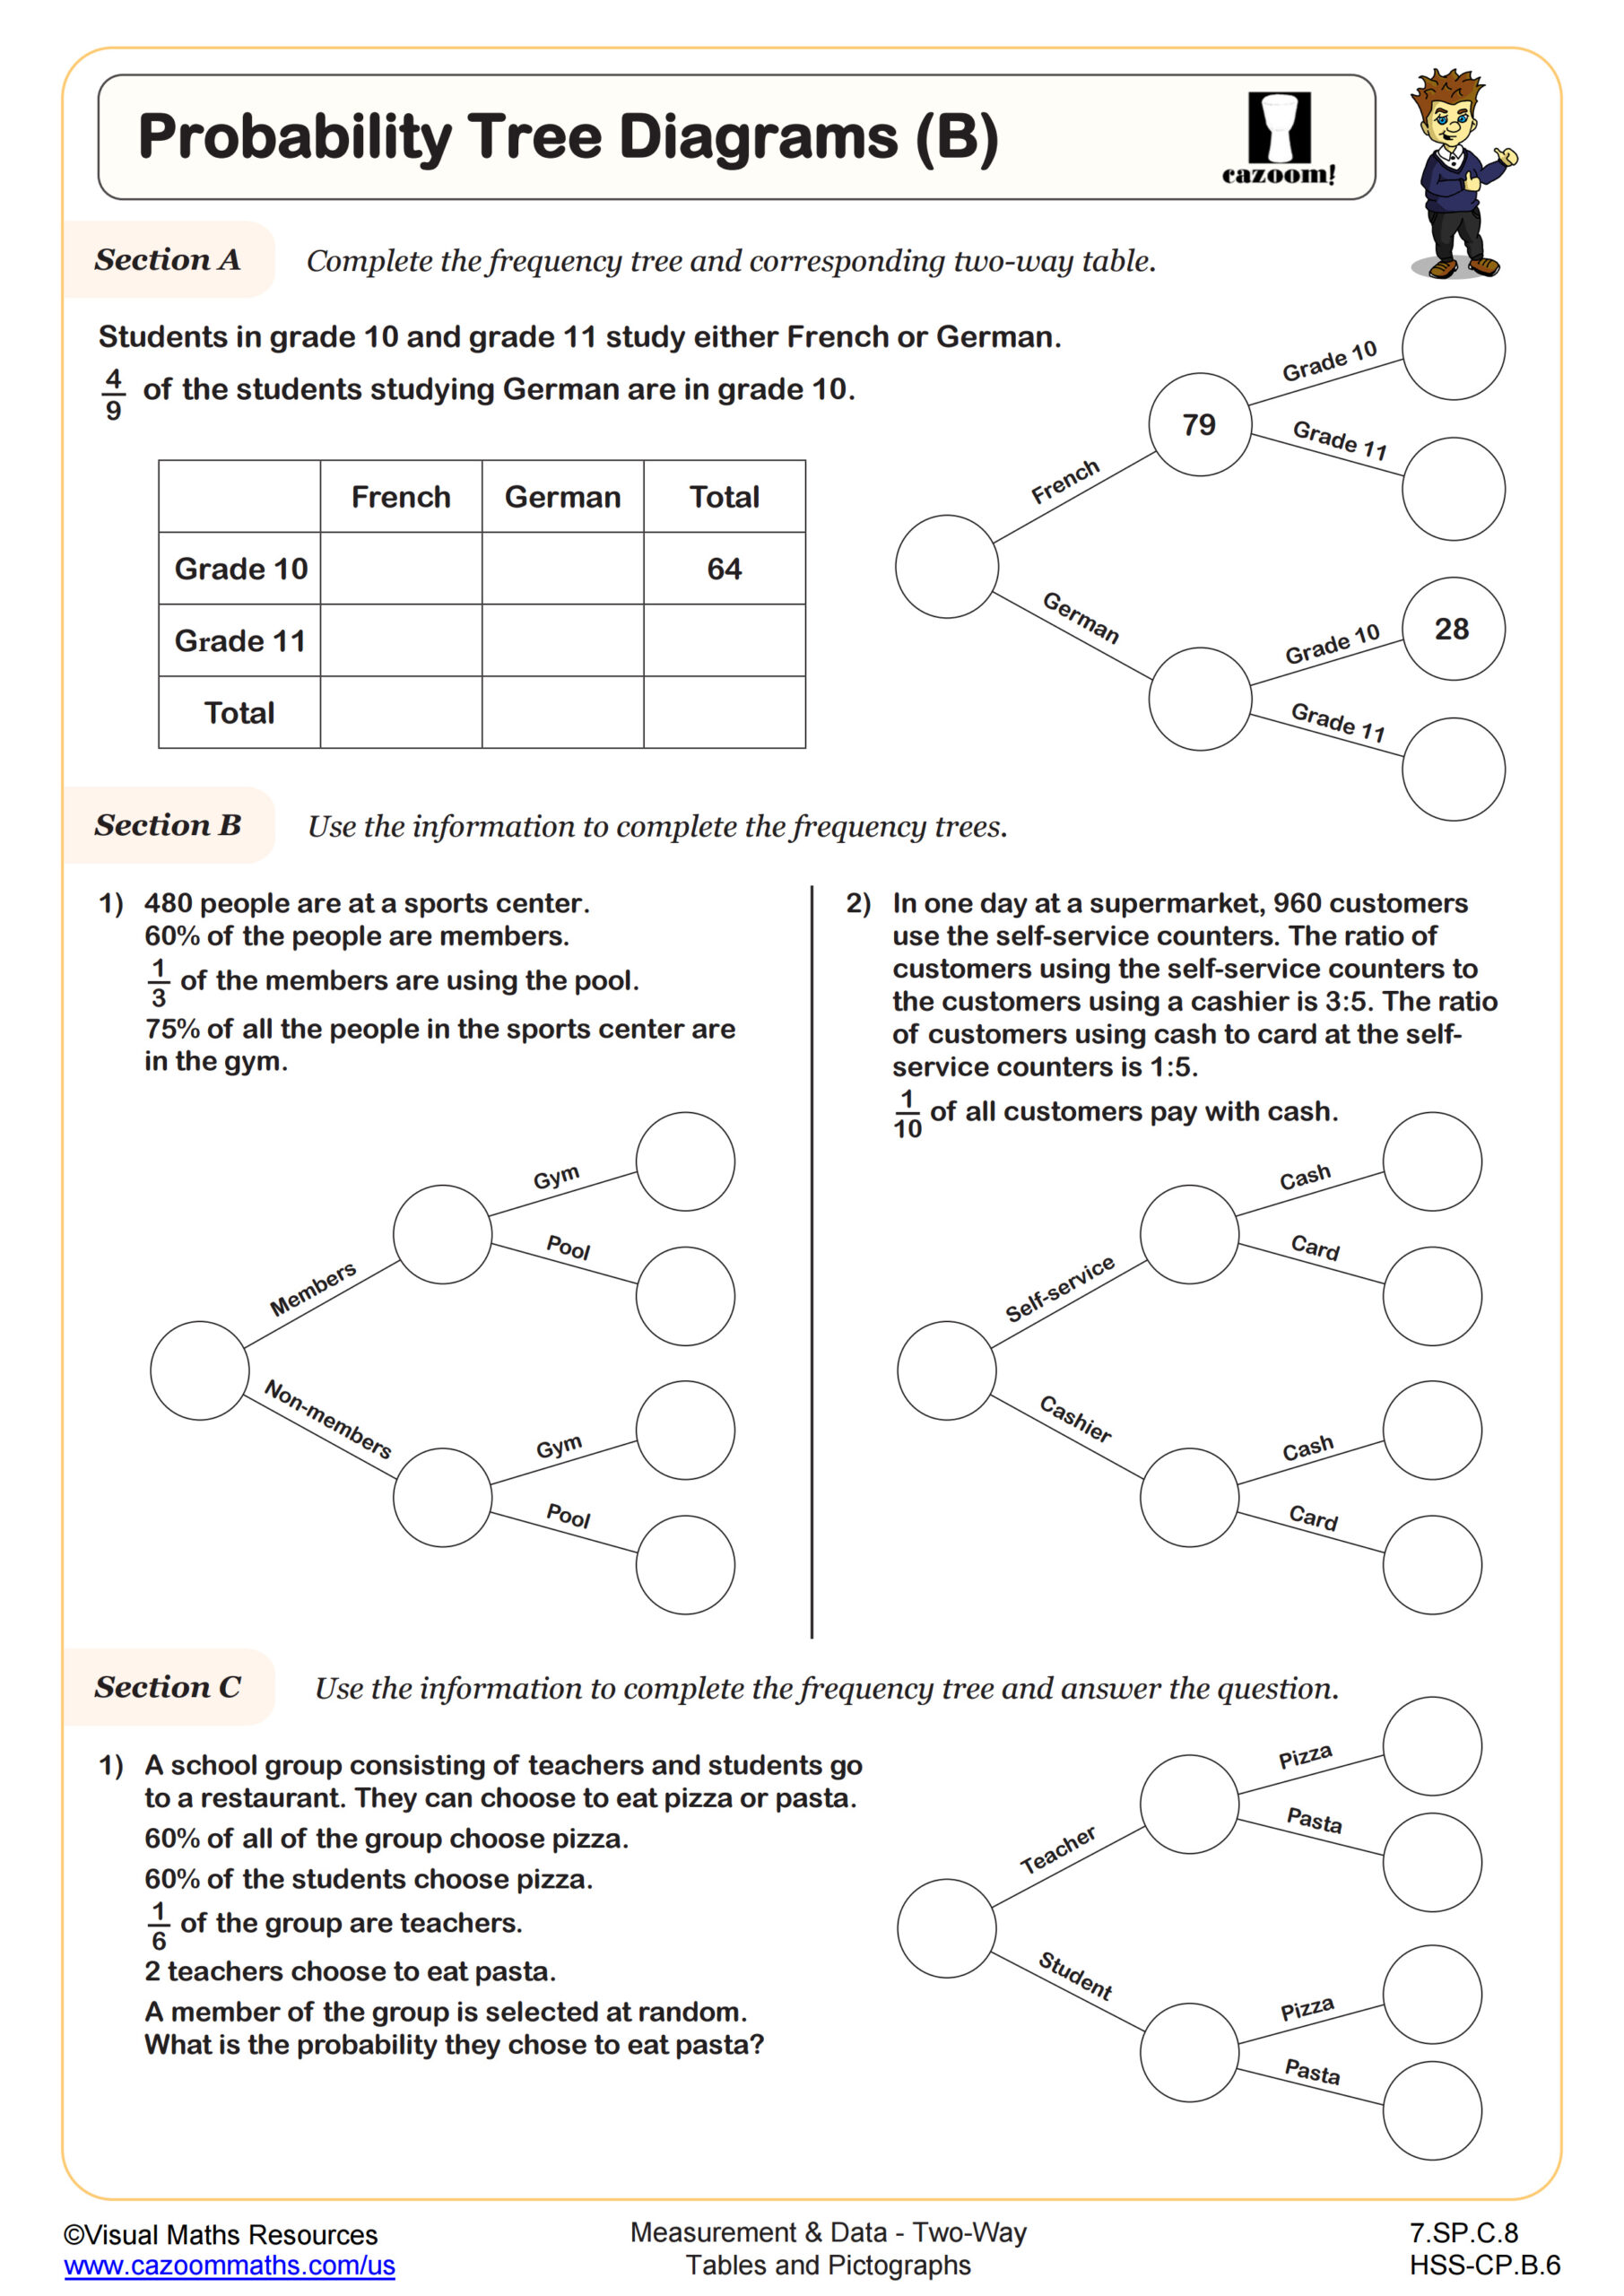
How Do Probability Tree Diagrams Connect to Two-Way Tables?
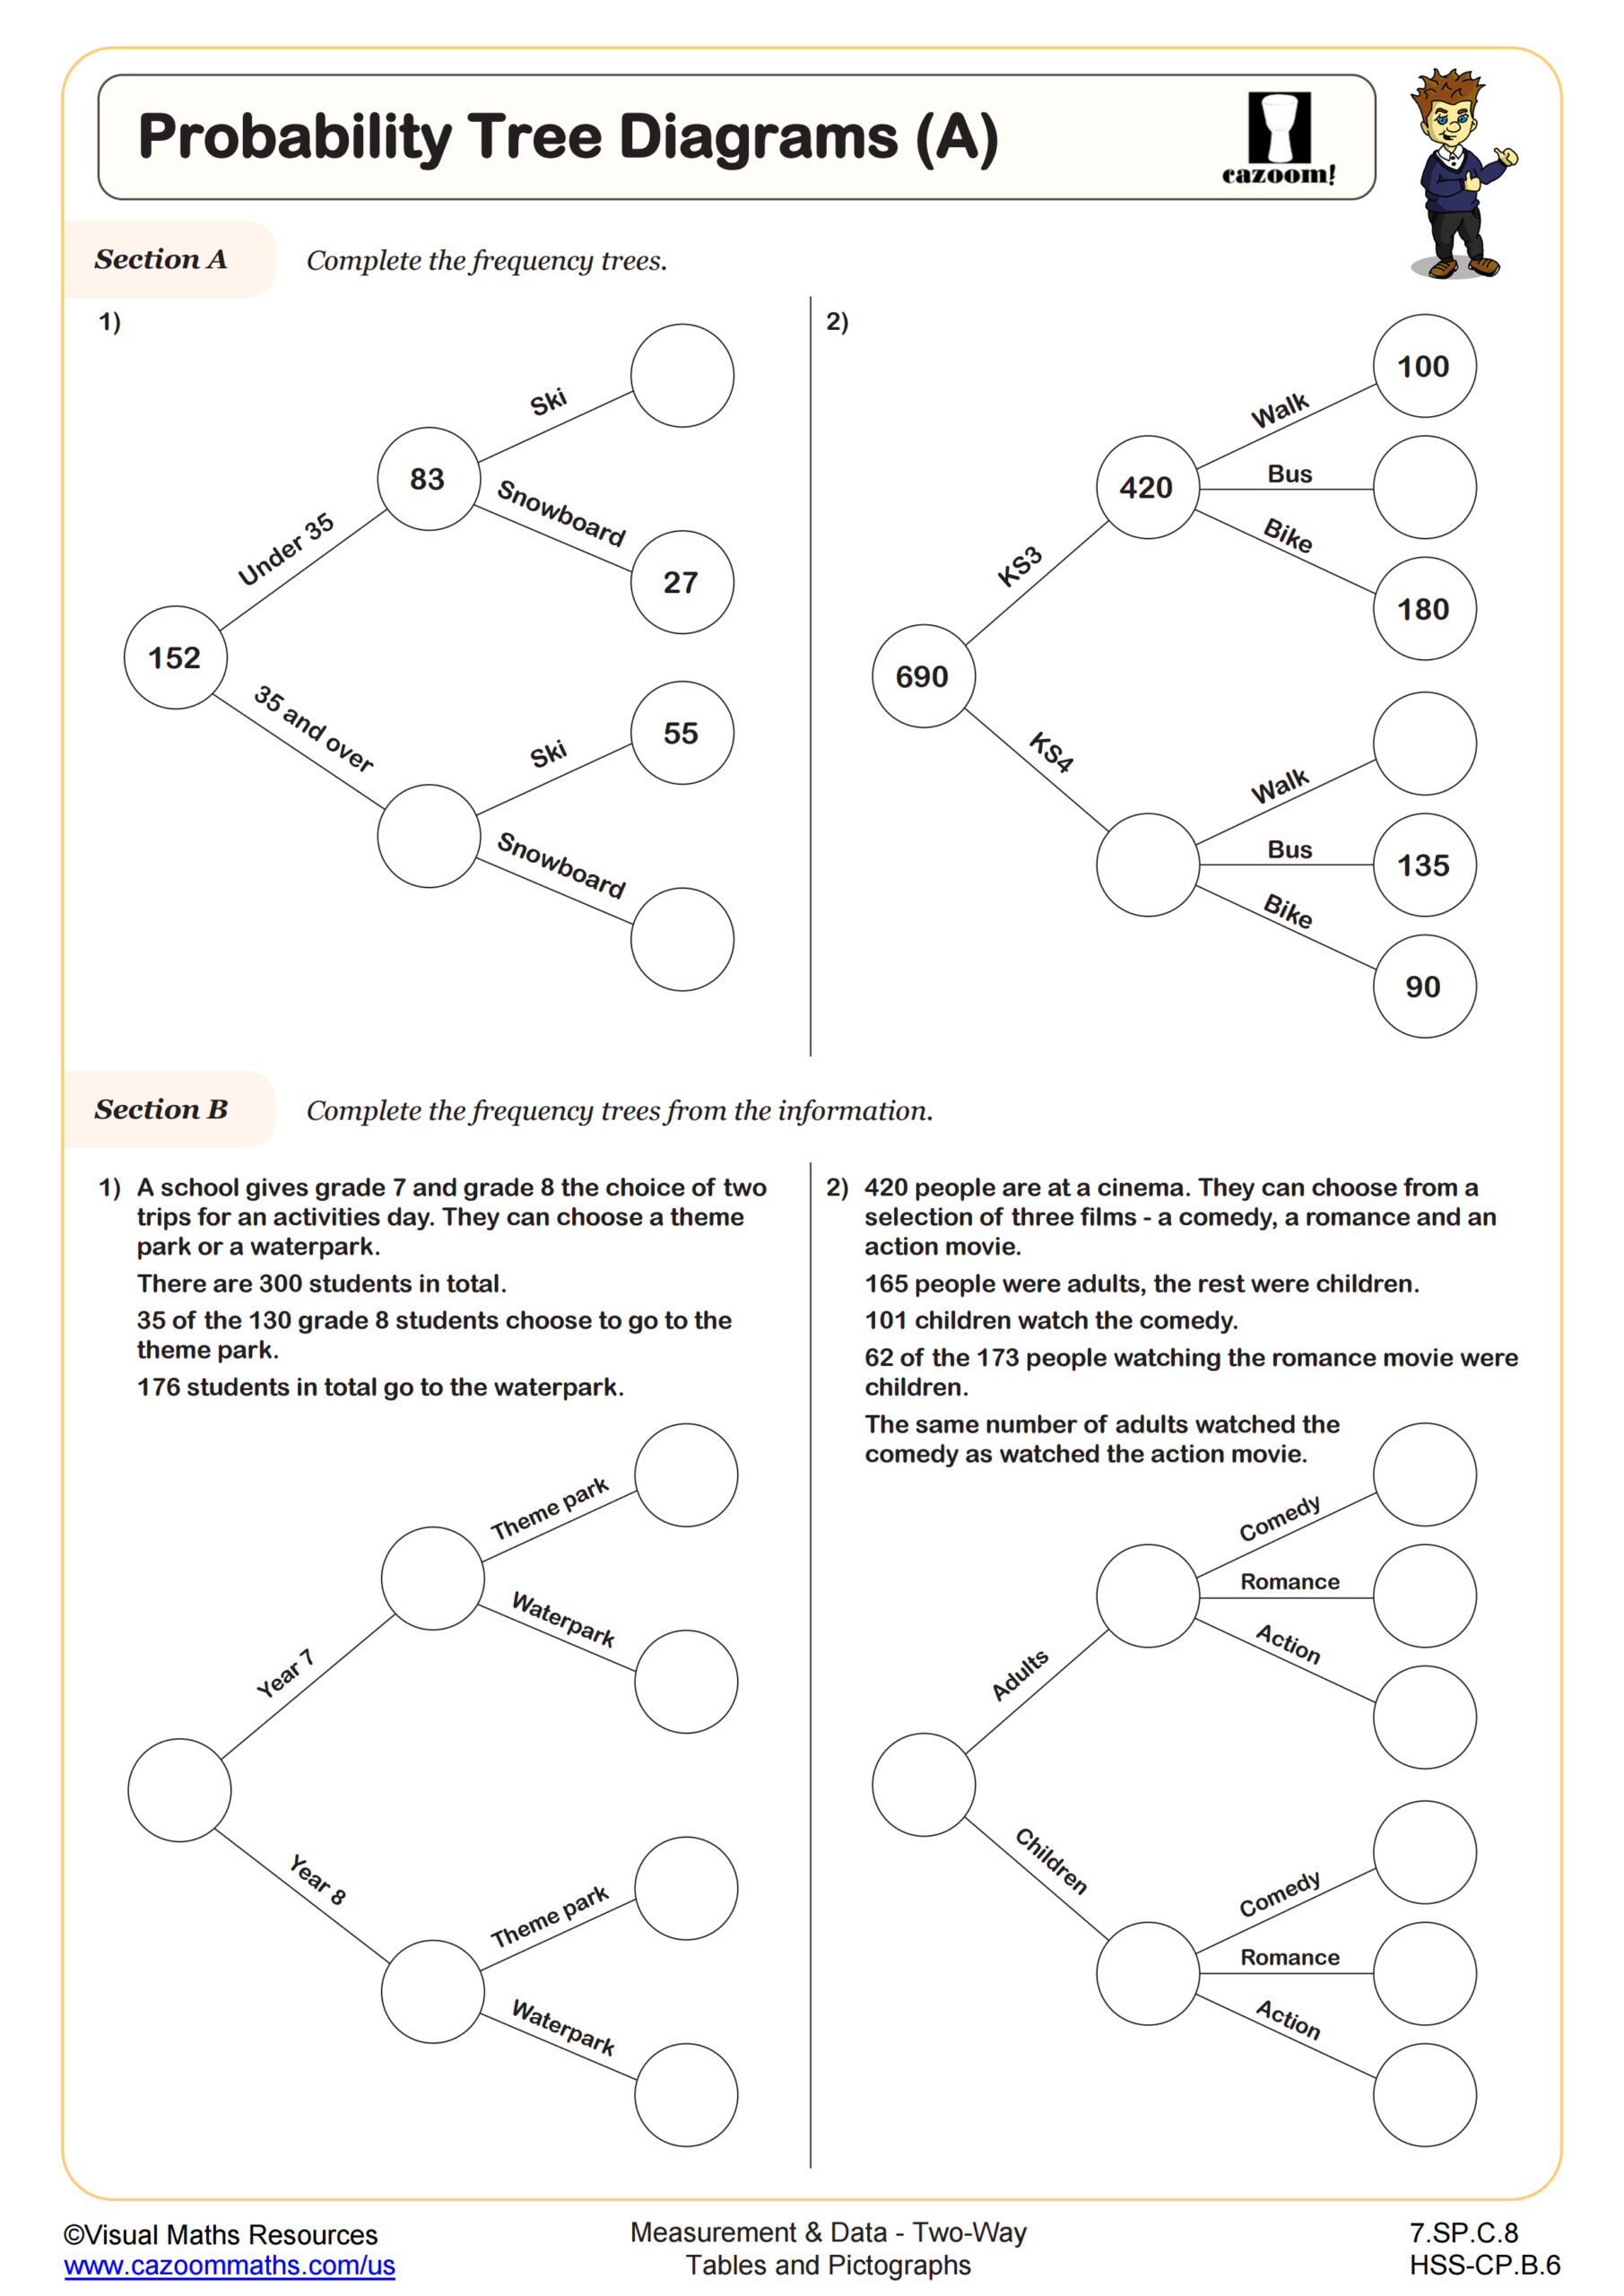
Probability tree diagrams provide an alternative visual representation of the same information contained in two-way tables, showing sequential events and their associated probabilities along branches. Students learn to multiply probabilities along paths to find joint probabilities and add probabilities across different paths to find marginal probabilities. This dual representation helps students understand that P(A and B) comes from multiplying along a branch, while totals come from combining different branches.
This skill appears in STEM fields whenever researchers analyze sequential decision-making or multi-stage processes. Medical professionals use tree diagrams to calculate the probability of test accuracy given disease prevalence, while engineers use them to assess the reliability of systems with multiple components. Quality control specialists in manufacturing rely on these methods to predict defect rates across production stages, making this more than an abstract math exercise.
How Can Teachers Use These Worksheets in Geometry Class?
The worksheets progress from basic table completion to complex probability calculations, allowing teachers to differentiate instruction based on student readiness. Worked examples demonstrate proper setup for probability calculations from two-way tables, while varied problem types ensure students don't simply memorize one procedure. The pictograph worksheets help students understand that data visualization requires careful attention to scale and accurate symbol representation.
Many teachers use these worksheets during statistics units as retrieval practice before introducing more complex concepts like scatter plots or linear regression. The probability tree diagram worksheets work well for paired practice, with students checking each other's branch probabilities before calculating final answers. The complete answer keys make these suitable for test preparation sessions where students need immediate feedback, or for homework assignments where self-checking builds confidence before assessments.