High school Bivariate Data Worksheets
All worksheets are created by the team of experienced teachers at Cazoom Math.
What concepts does a bivariate data worksheet typically cover?
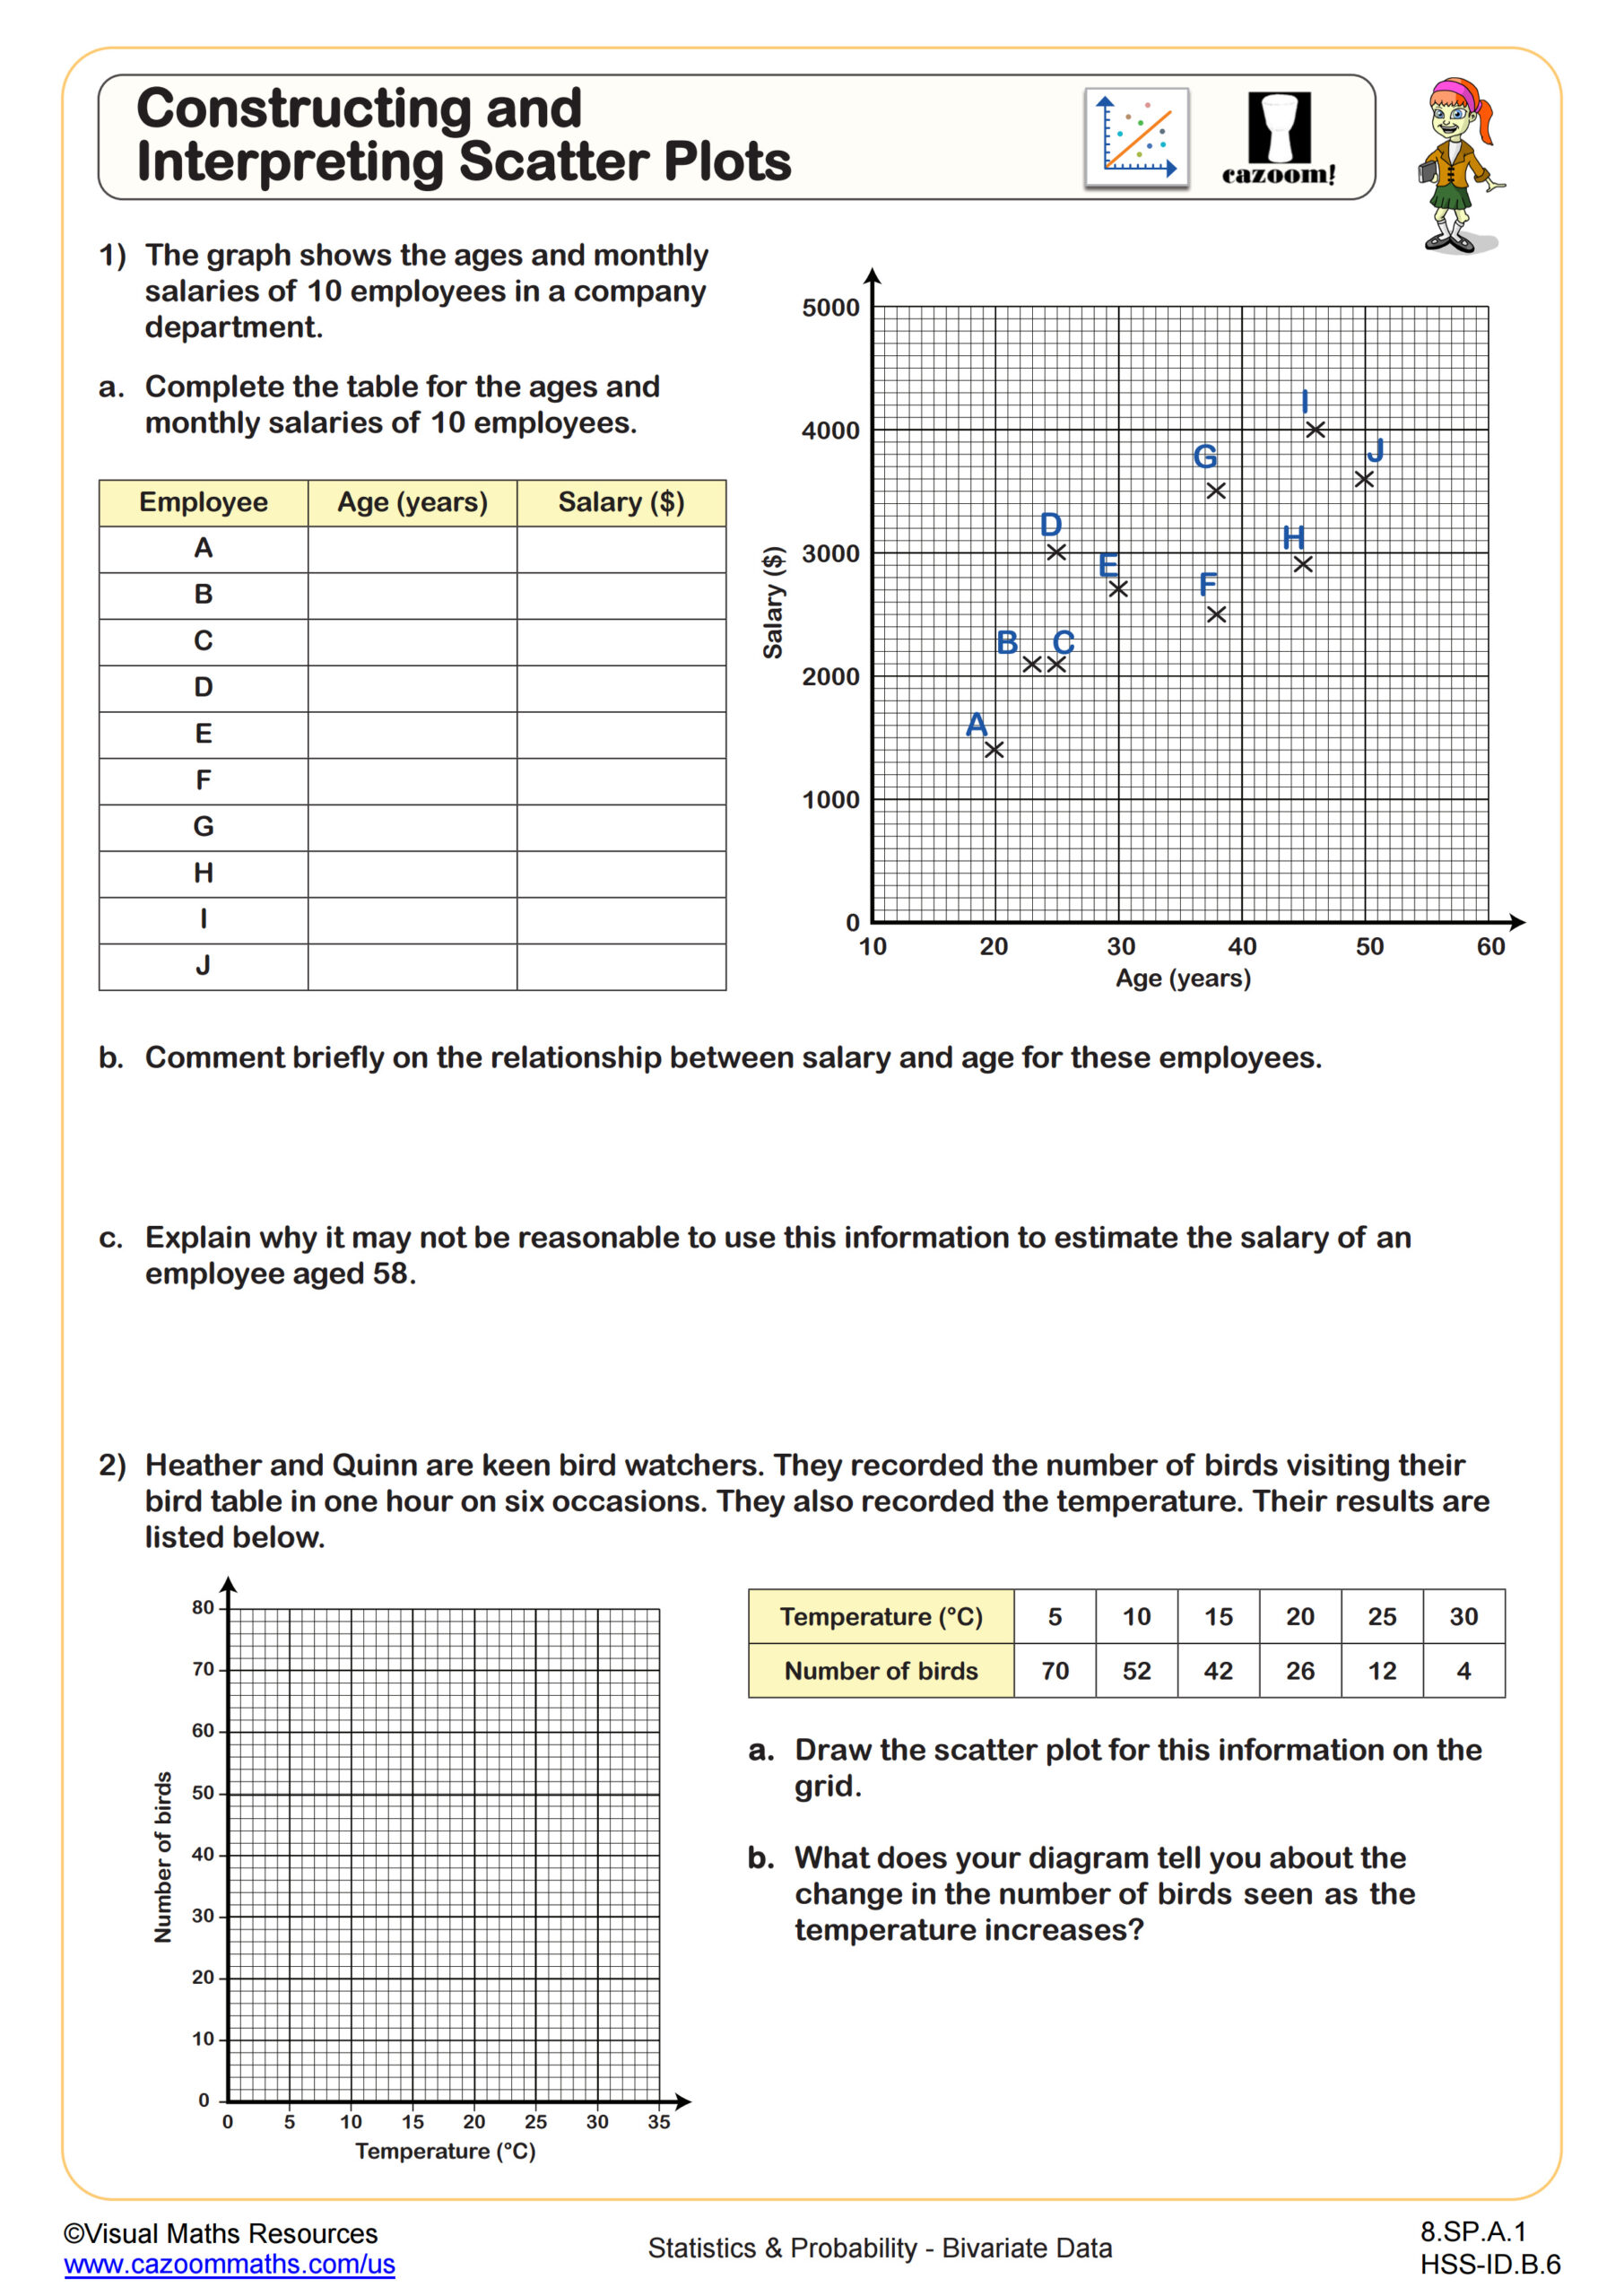
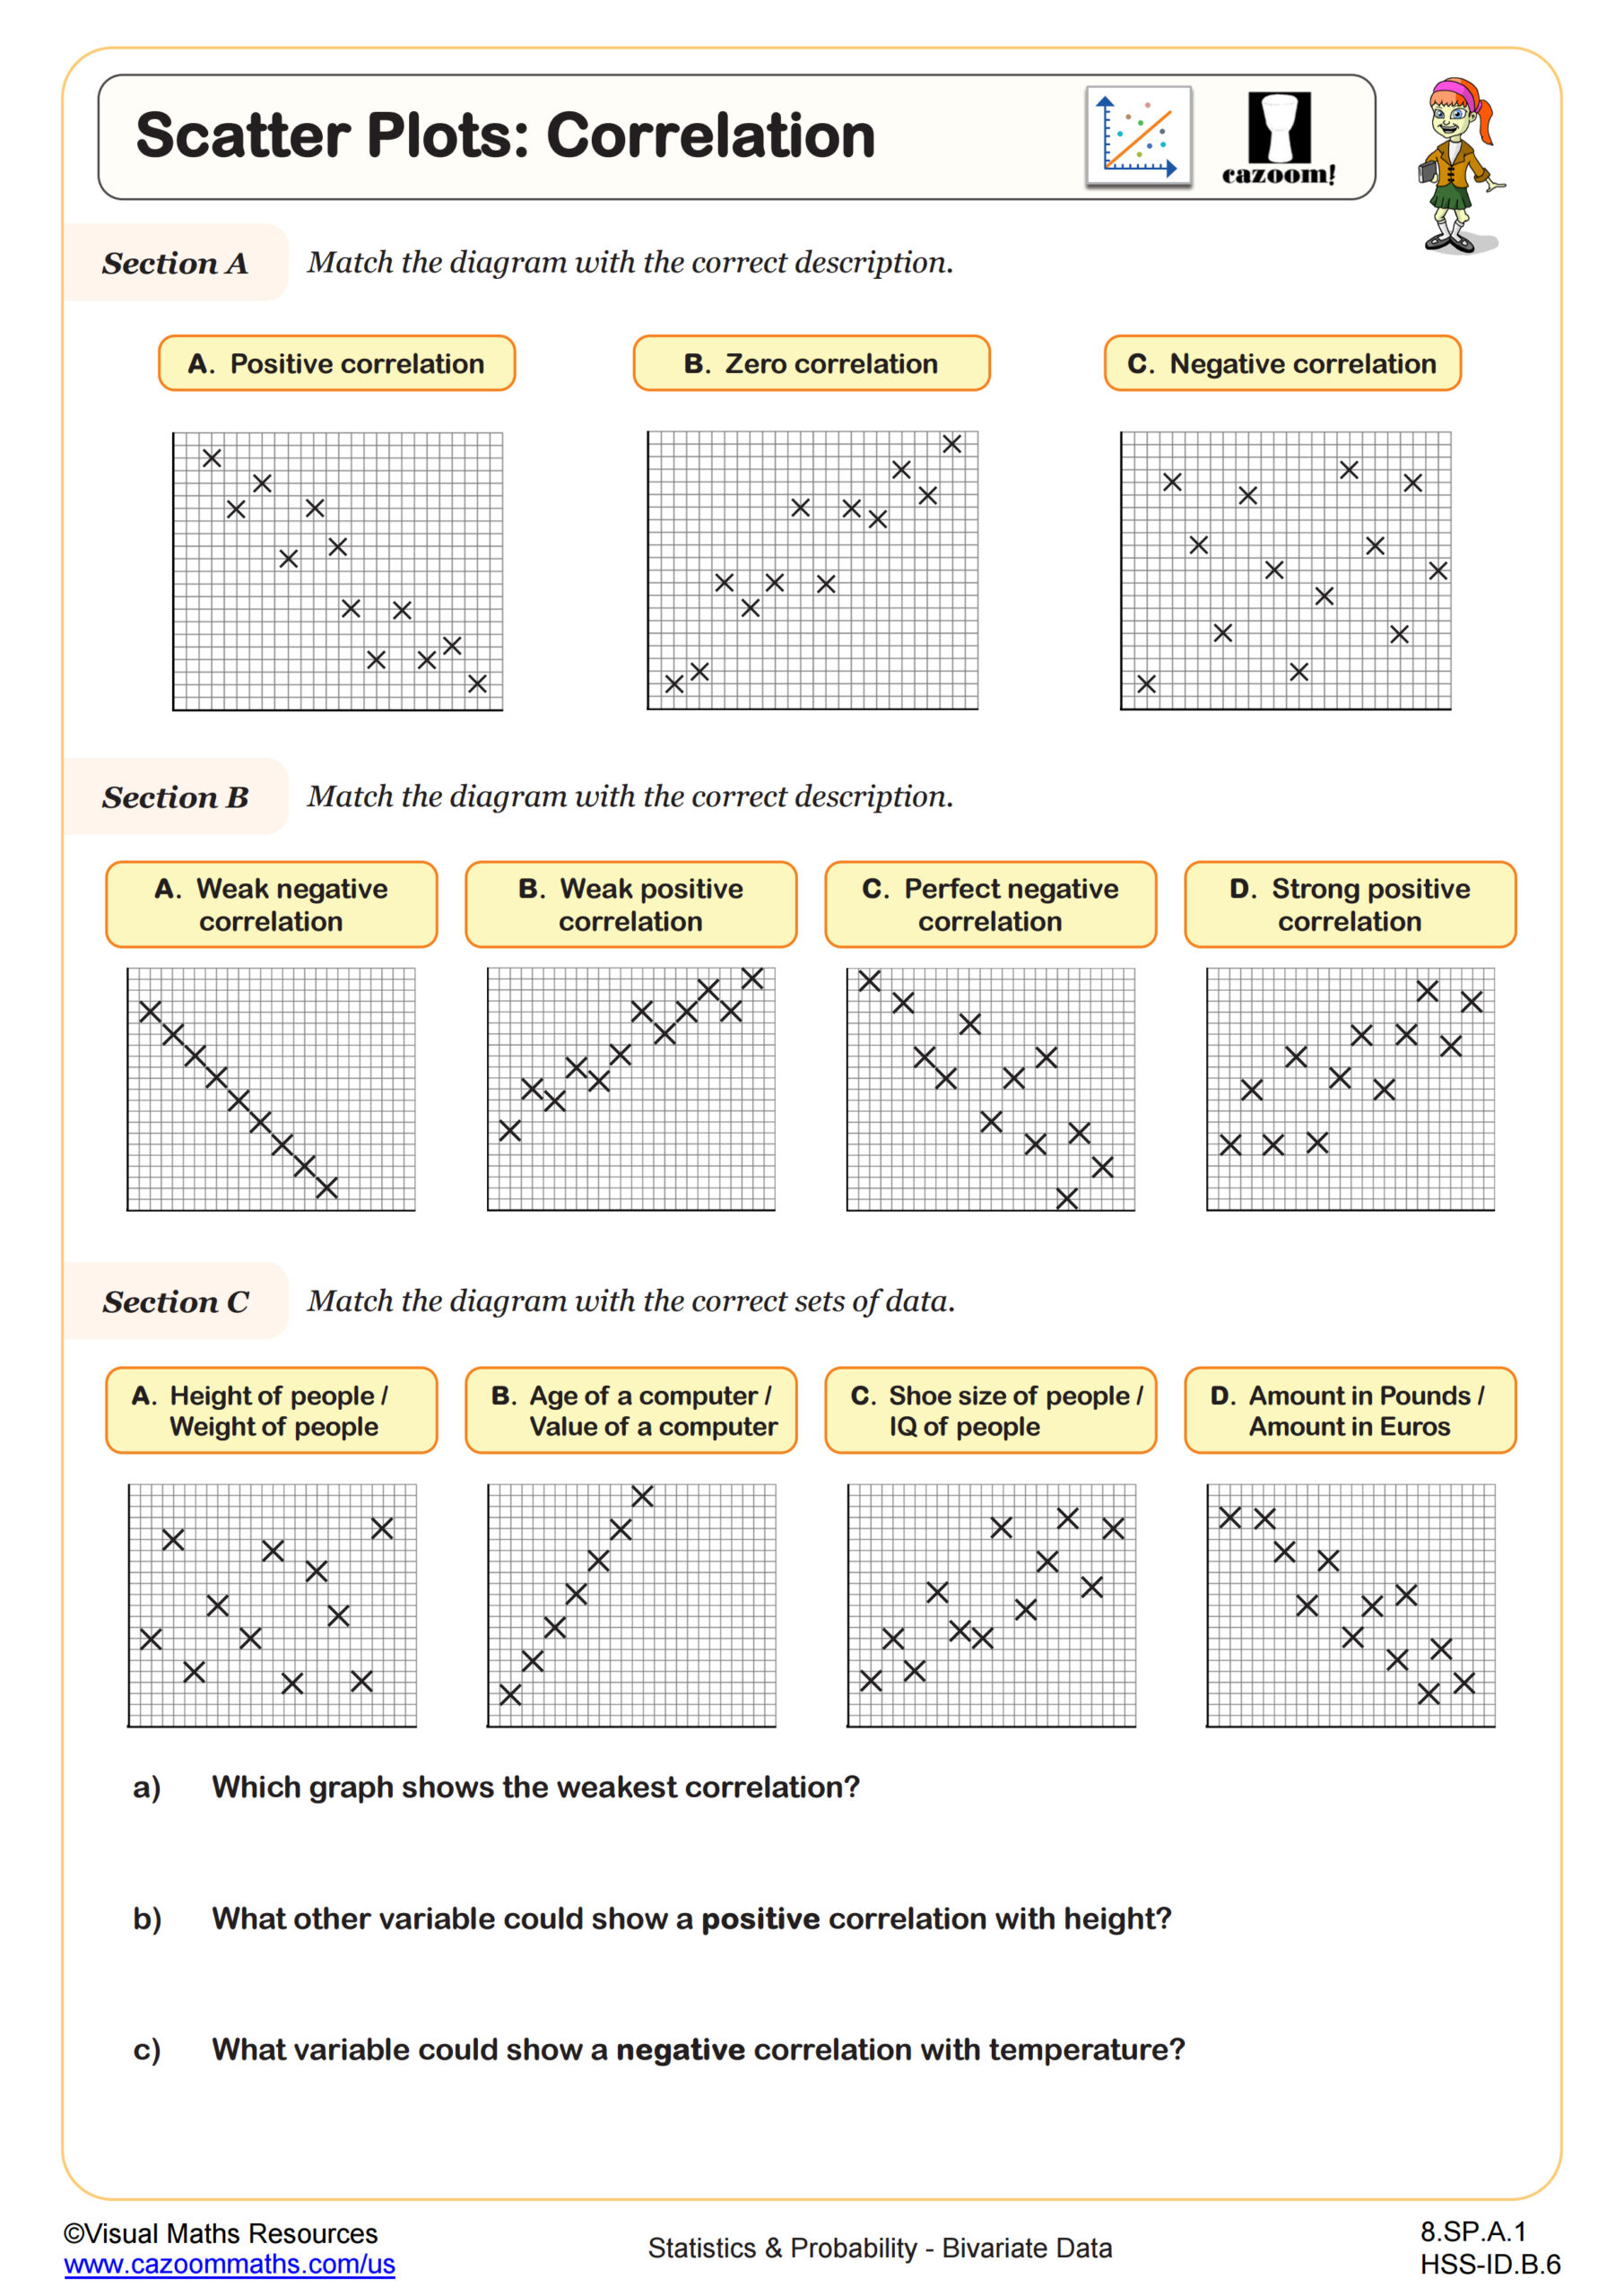
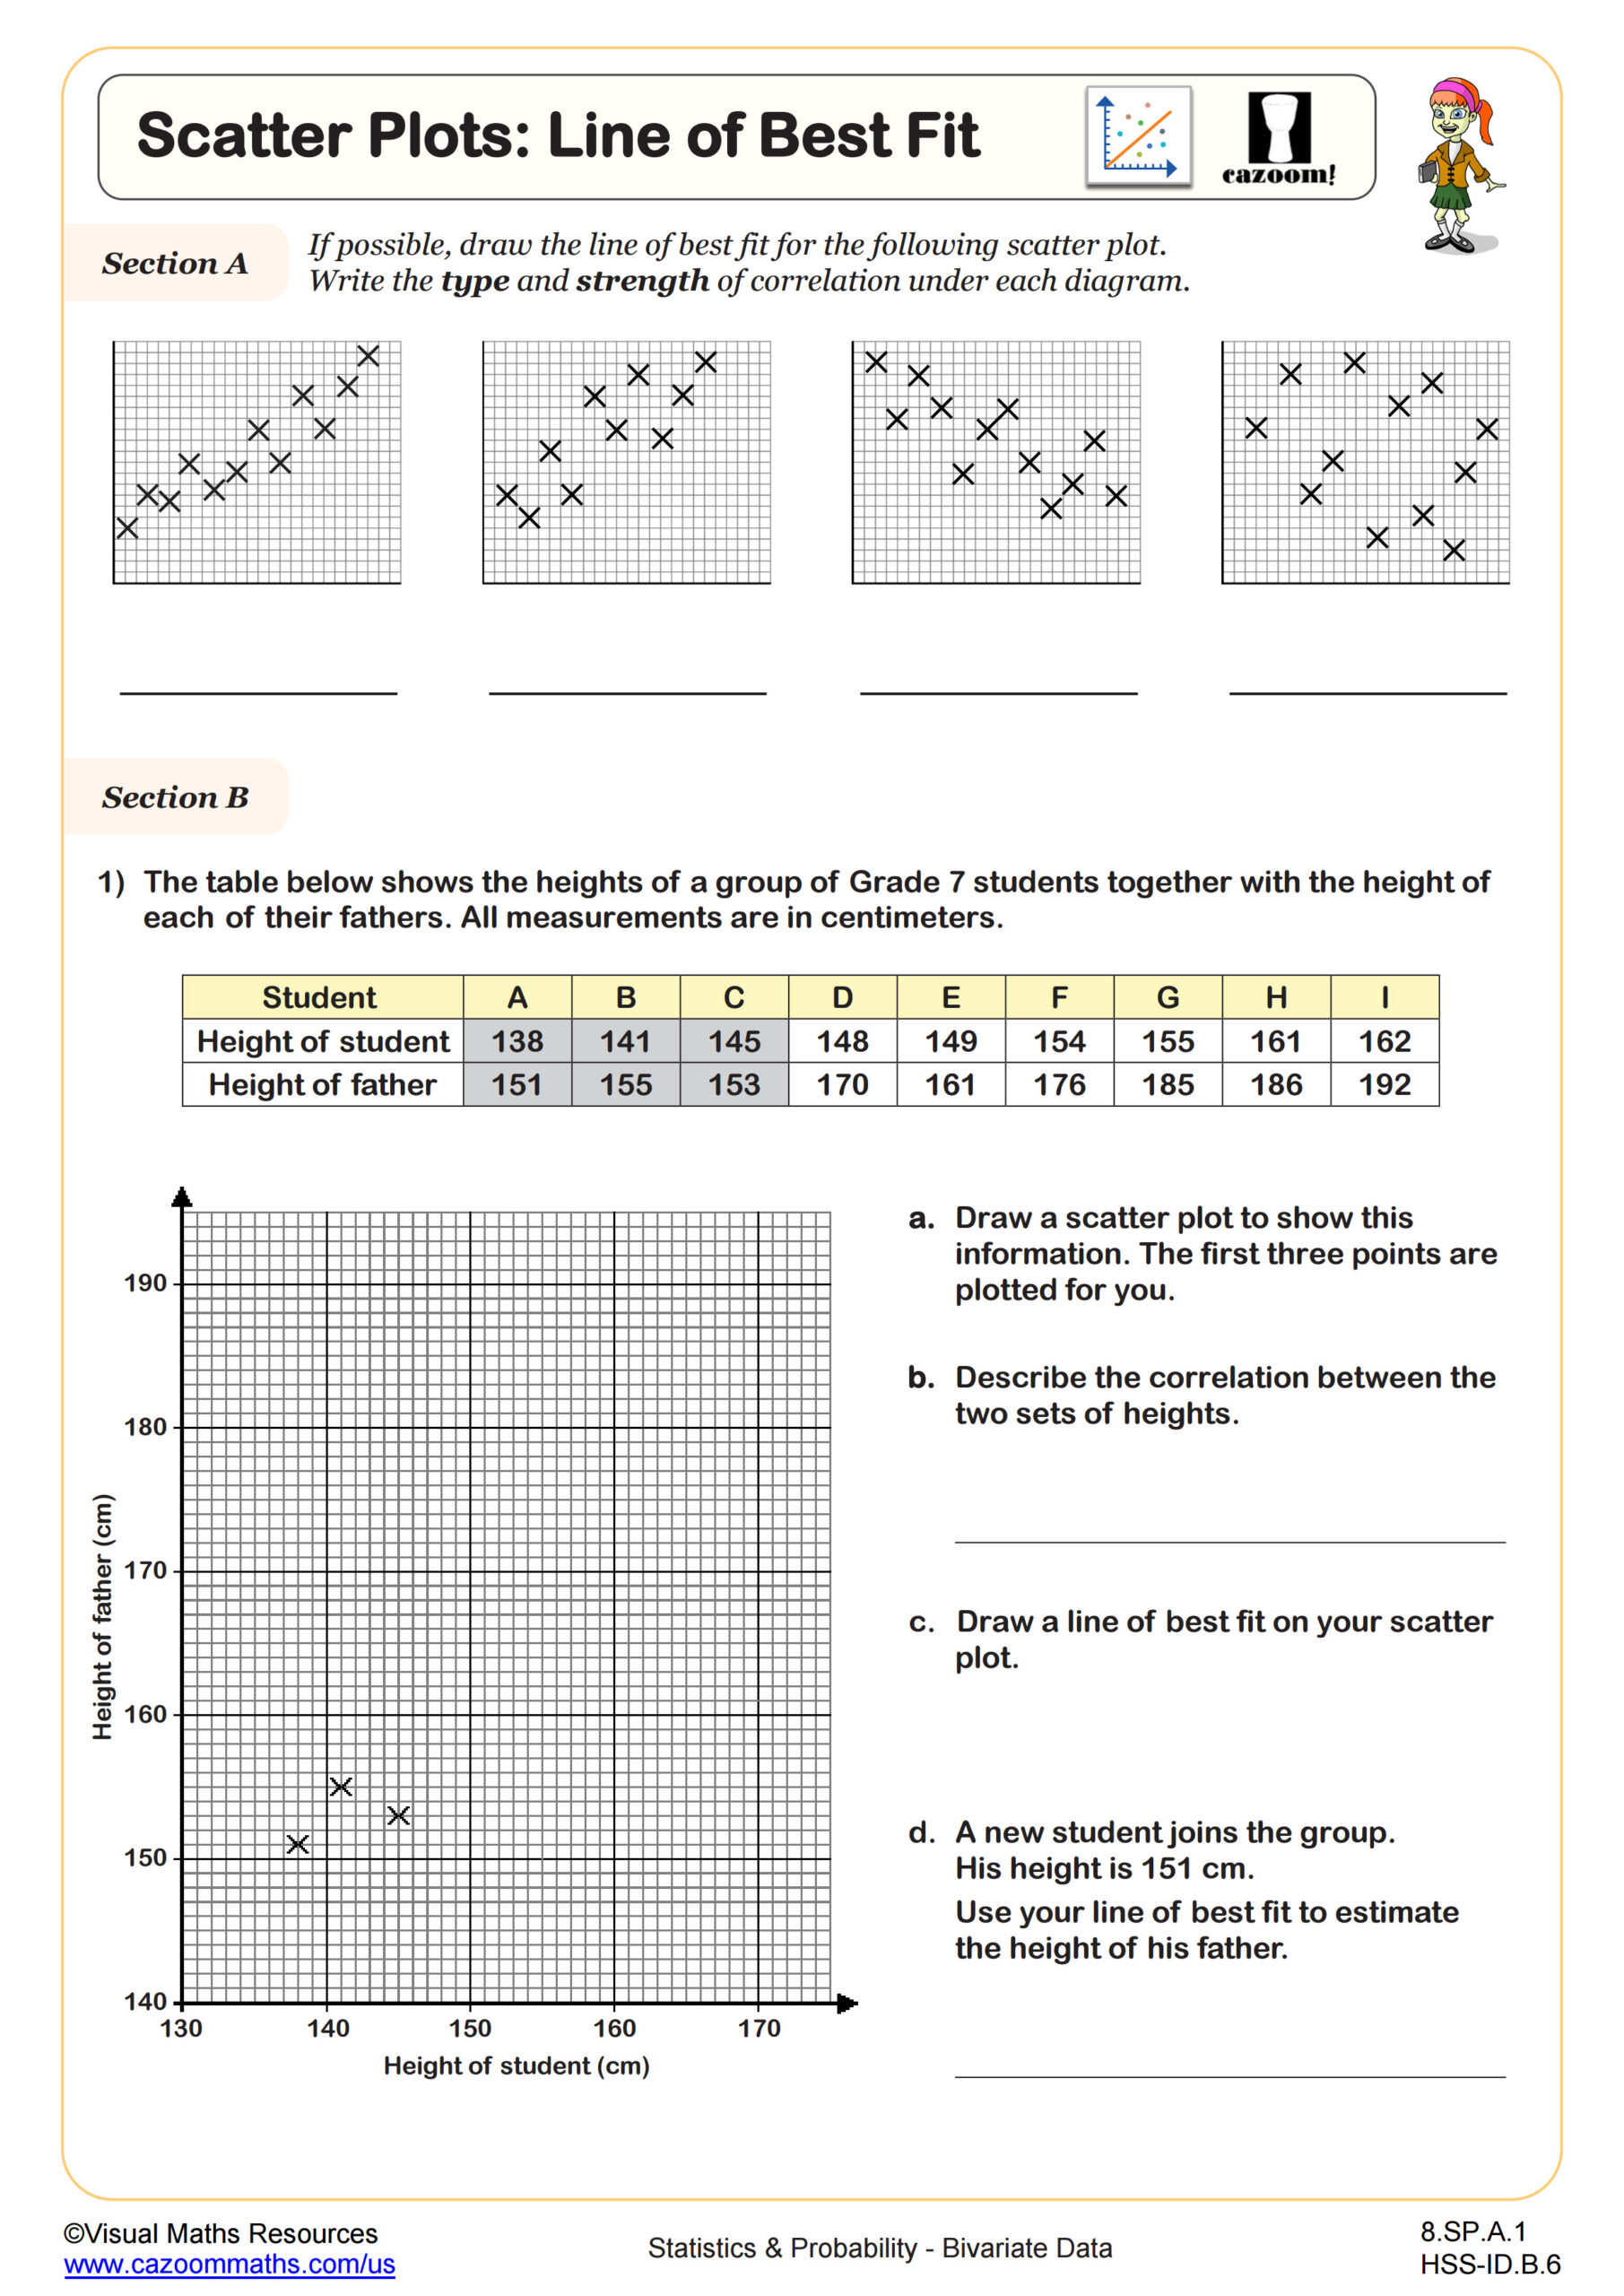
A thorough bivariate data worksheet addresses scatter plot construction, correlation analysis, and line of best fit calculations. Students learn to identify positive, negative, and no correlation patterns while interpreting correlation coefficients ranging from -1 to 1. These skills align with Common Core Statistics and Probability standards for high school.
Teachers observe that students frequently struggle with distinguishing between strong and weak correlations when r-values fall between 0.3 and 0.7. Providing bivariate data worksheets with answers helps students self-check their interpretations and develop confidence in analyzing real-world statistical relationships before moving to more complex regression analysis.
Which grade levels benefit most from bivariate data worksheets?
High school students in Algebra 1, Algebra 2, and Statistics courses gain the most from structured bivariate data practice. While some advanced middle school programs introduce basic scatter plots, the deeper analysis of correlation and regression typically occurs in grades 9-12. AP Statistics students particularly benefit from complex bivariate data sets for students preparing for college-level coursework.
Teachers find that 9th graders often need additional scaffolding with coordinate plotting before tackling correlation analysis, while 11th and 12th grade students can handle multi-step problems involving outlier identification and prediction accuracy. The progression from simple pattern recognition to statistical inference requires careful sequencing across these grade levels.
How do students learn to calculate correlation coefficients effectively?
Students master correlation coefficient calculations through step-by-step practice that breaks down the formula into manageable components. Worksheets typically guide students through finding means, calculating deviations, and applying the Pearson correlation formula systematically. This methodical approach builds computational fluency alongside conceptual understanding.
Many teachers notice students make arithmetic errors when computing the denominator's square root, leading to incorrect r-values. Two variable statistics worksheet problems that provide intermediate steps help students identify where mistakes occur. Starting with datasets containing simple integers before progressing to decimal values allows students to focus on the process rather than complex calculations.
How can teachers maximize student engagement with bivariate data worksheets?
Effective implementation involves connecting bivariate analysis to student interests and current events. Teachers report higher engagement when worksheets feature sports statistics, social media trends, or environmental data that resonates with teenage experiences. Pairing individual worksheet completion with collaborative discussion about findings enhances both comprehension and retention.
Structuring lessons to include prediction activities before data analysis creates natural curiosity about results. Students first hypothesize about relationships, then use bivariate data worksheets pdf resources to test their predictions. This approach transforms passive computation into active investigation, preparing students for data-driven decision making in college and career contexts.