High School Cumulative Frequency and Box Plots Worksheets
All worksheets are created by the team of experienced teachers at Cazoom Math.
Struggling With Measurement and Data Skills? Cazoom Math Printable Resources Offer the Fix
Students connect their knowledge of quartiles and medians to visual data displays. They learn to construct cumulative frequency curves and identify statistical measures. This builds on their middle school work with fundamental data analysis.
Regular practice with these concepts strengthens statistical thinking and graph interpretation. Students develop skills for hypothesis testing and probability distributions. They prepare for advanced topics, such as variance and correlation analysis.
Curriculum Alignment: What High School Statistics Worksheets Include for Complete Learning
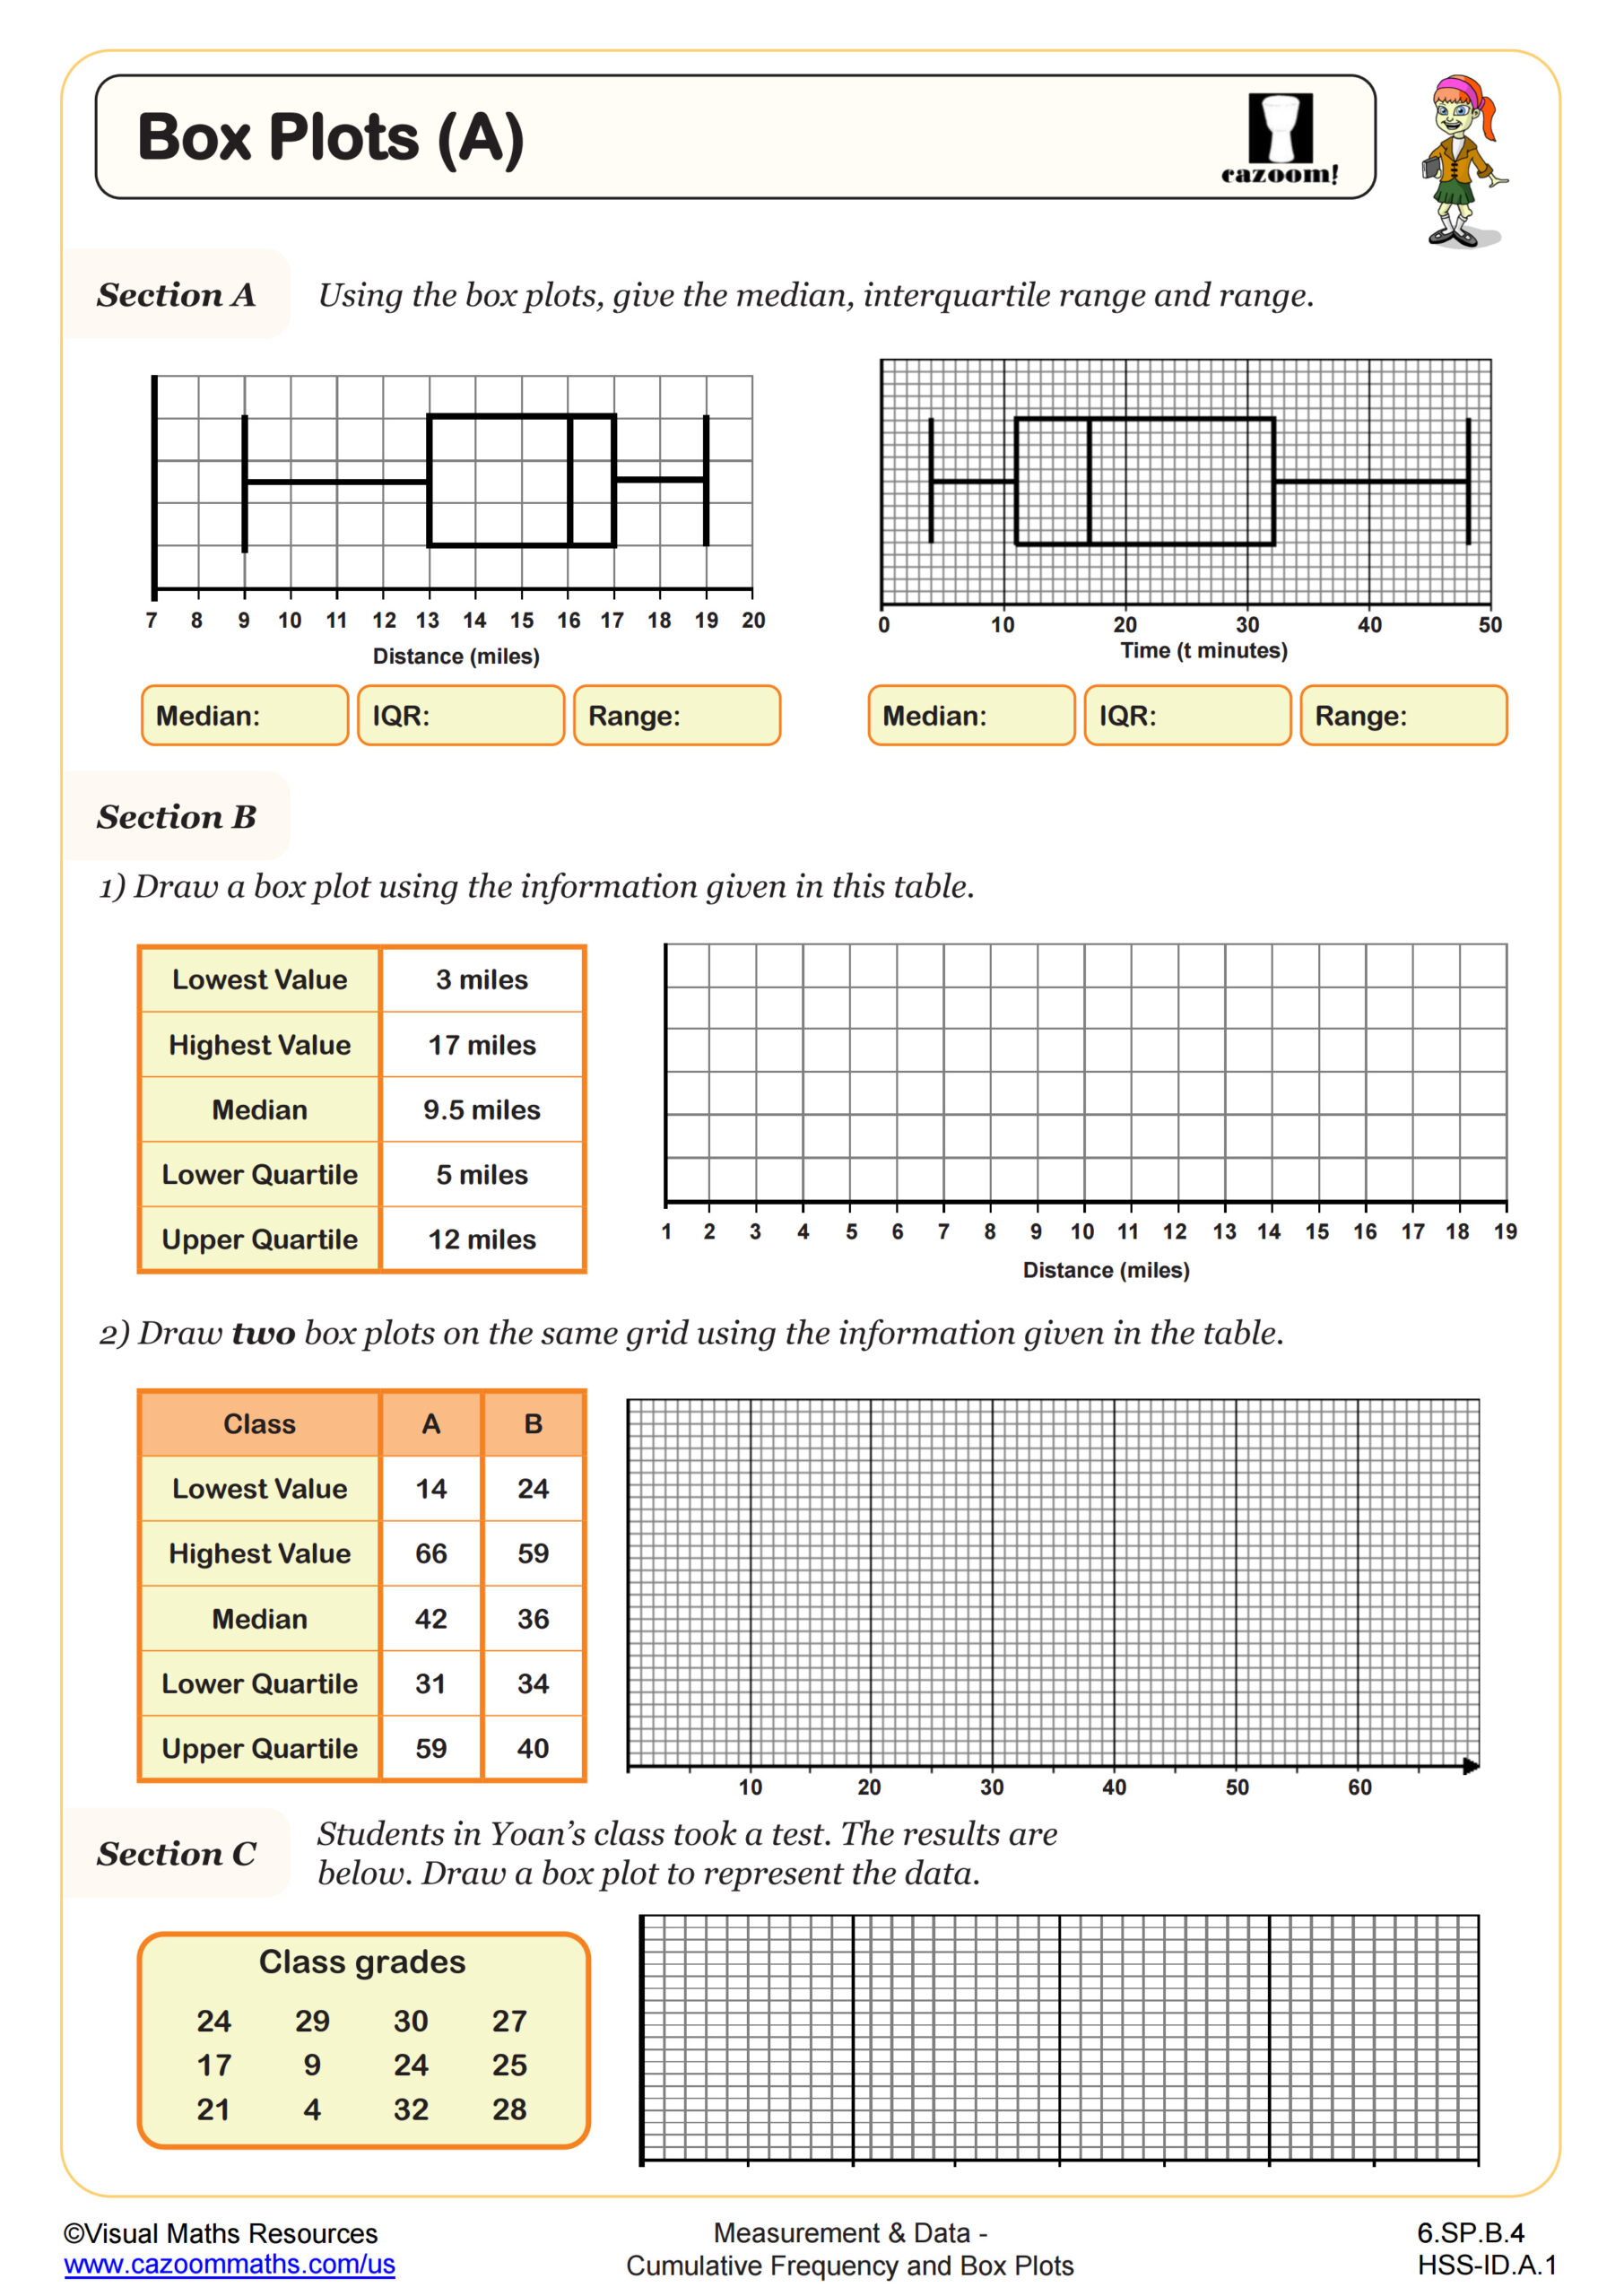
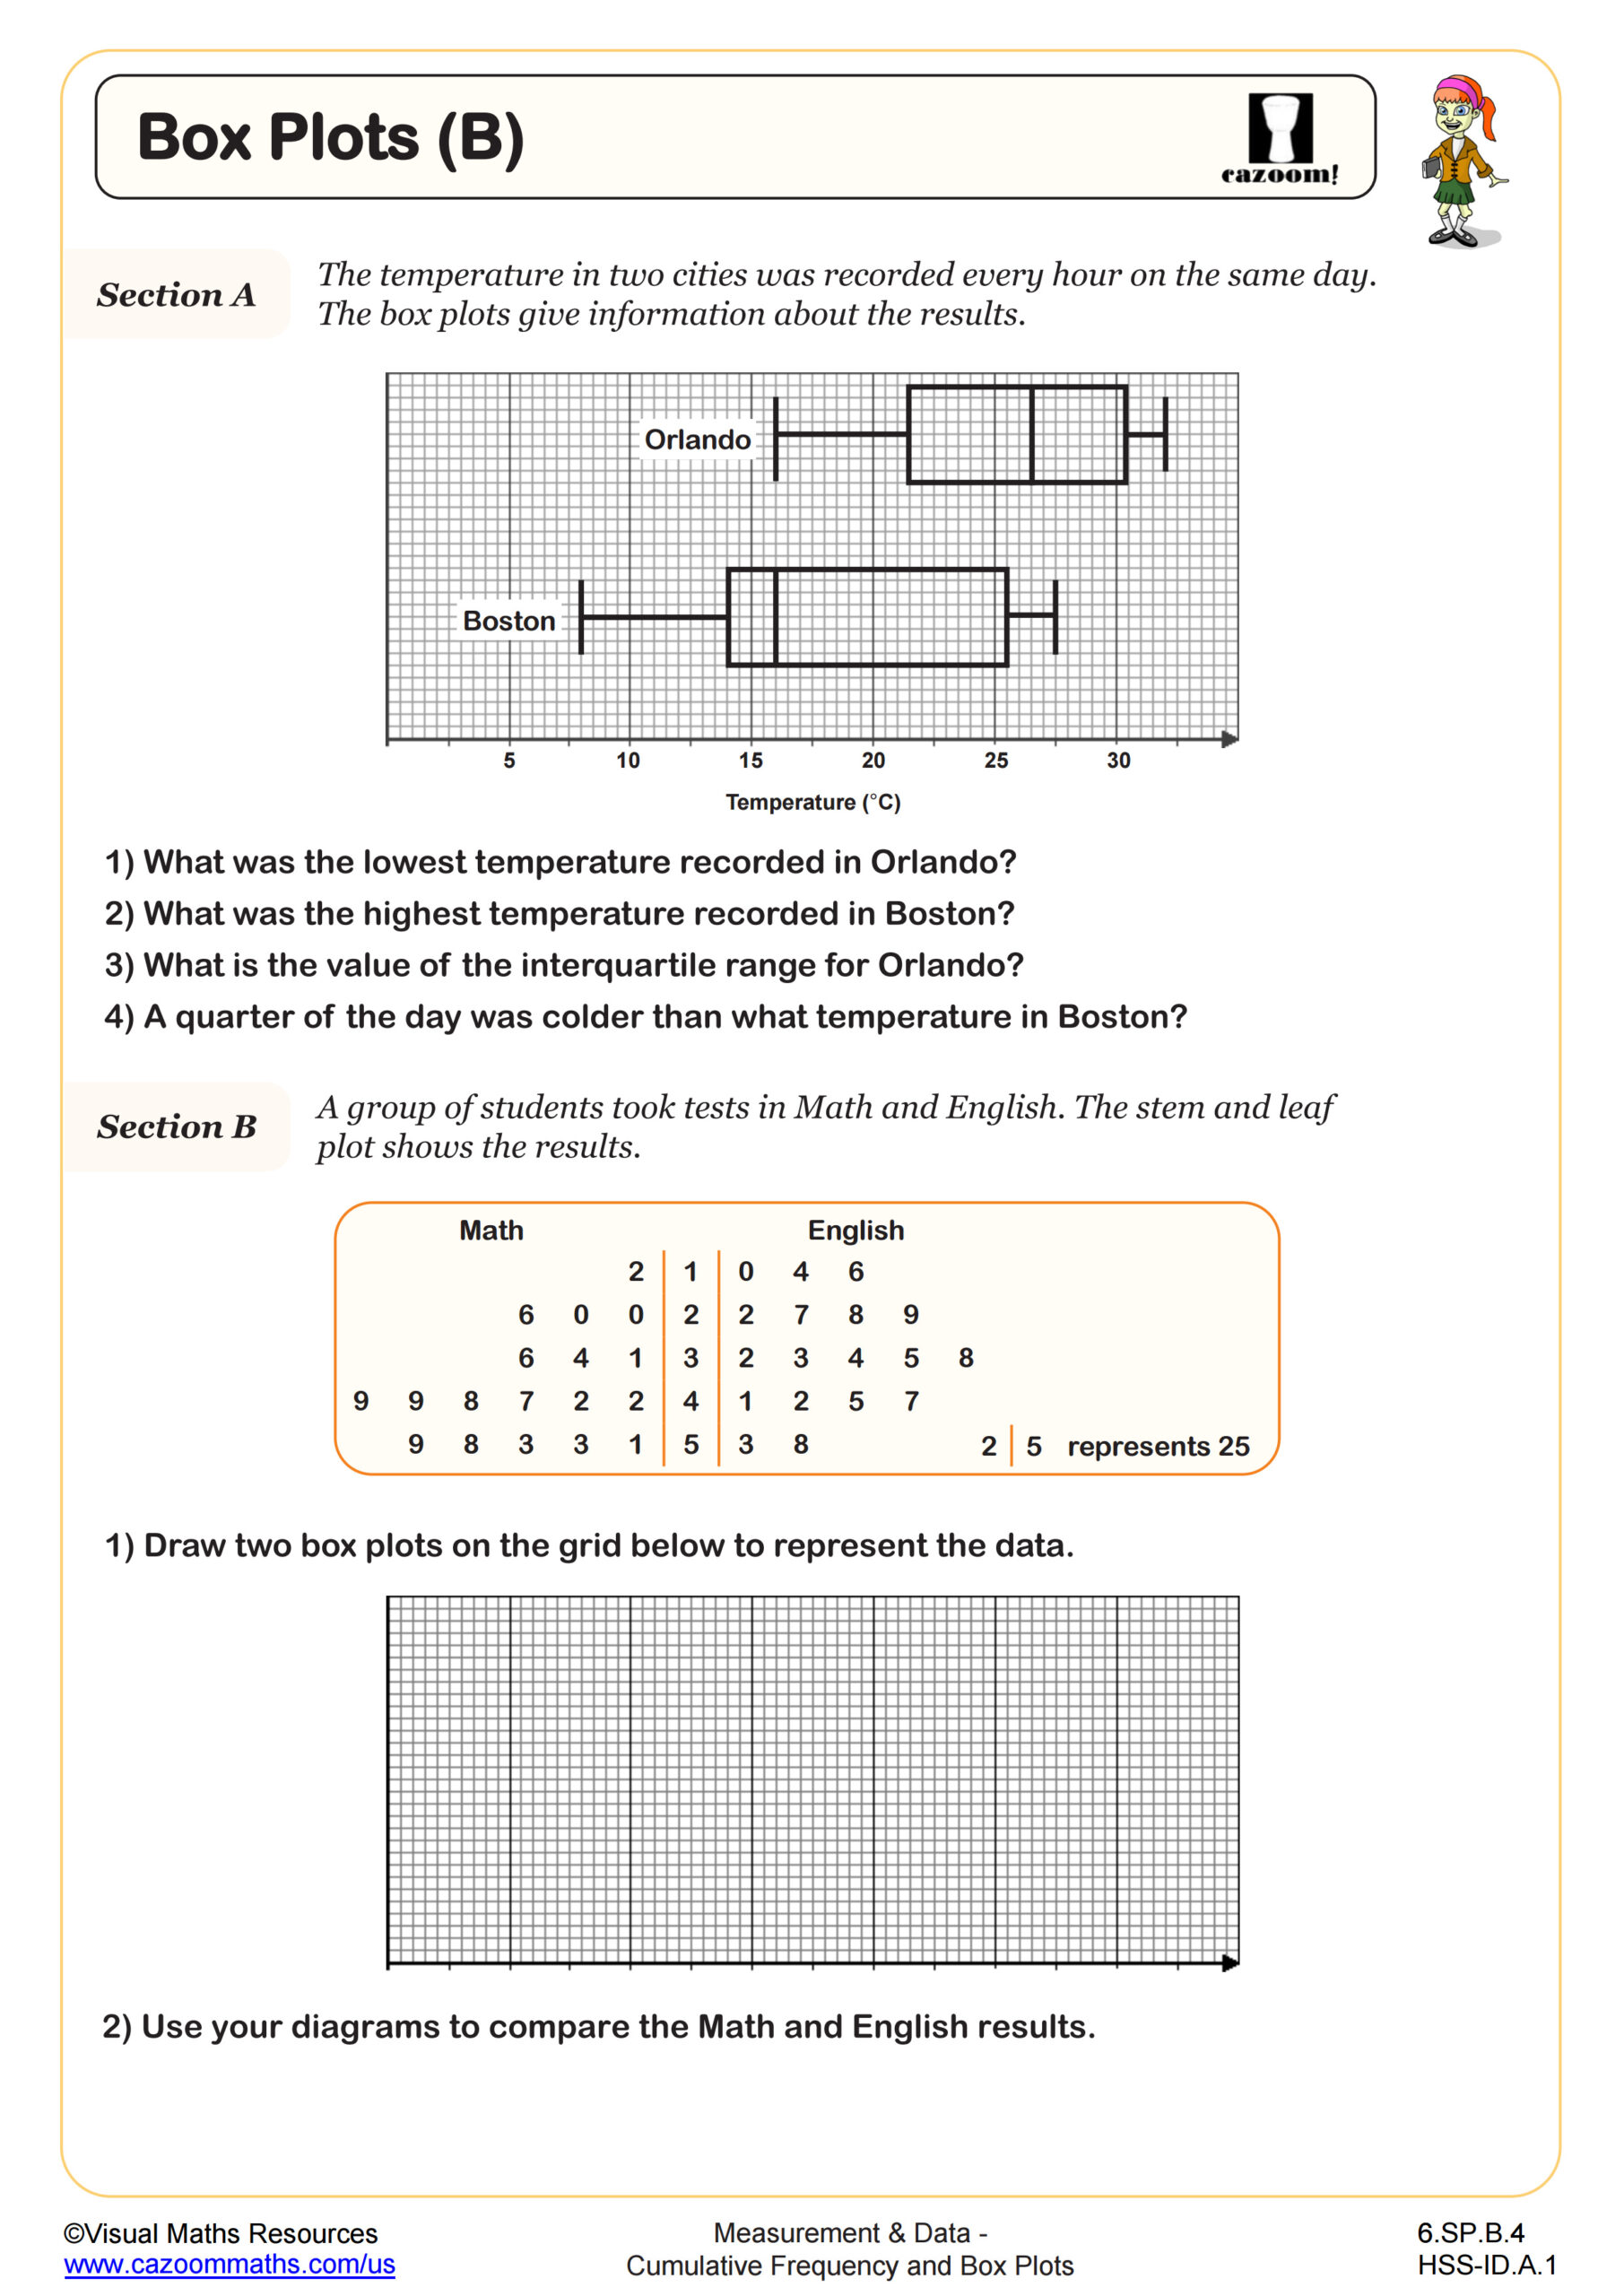
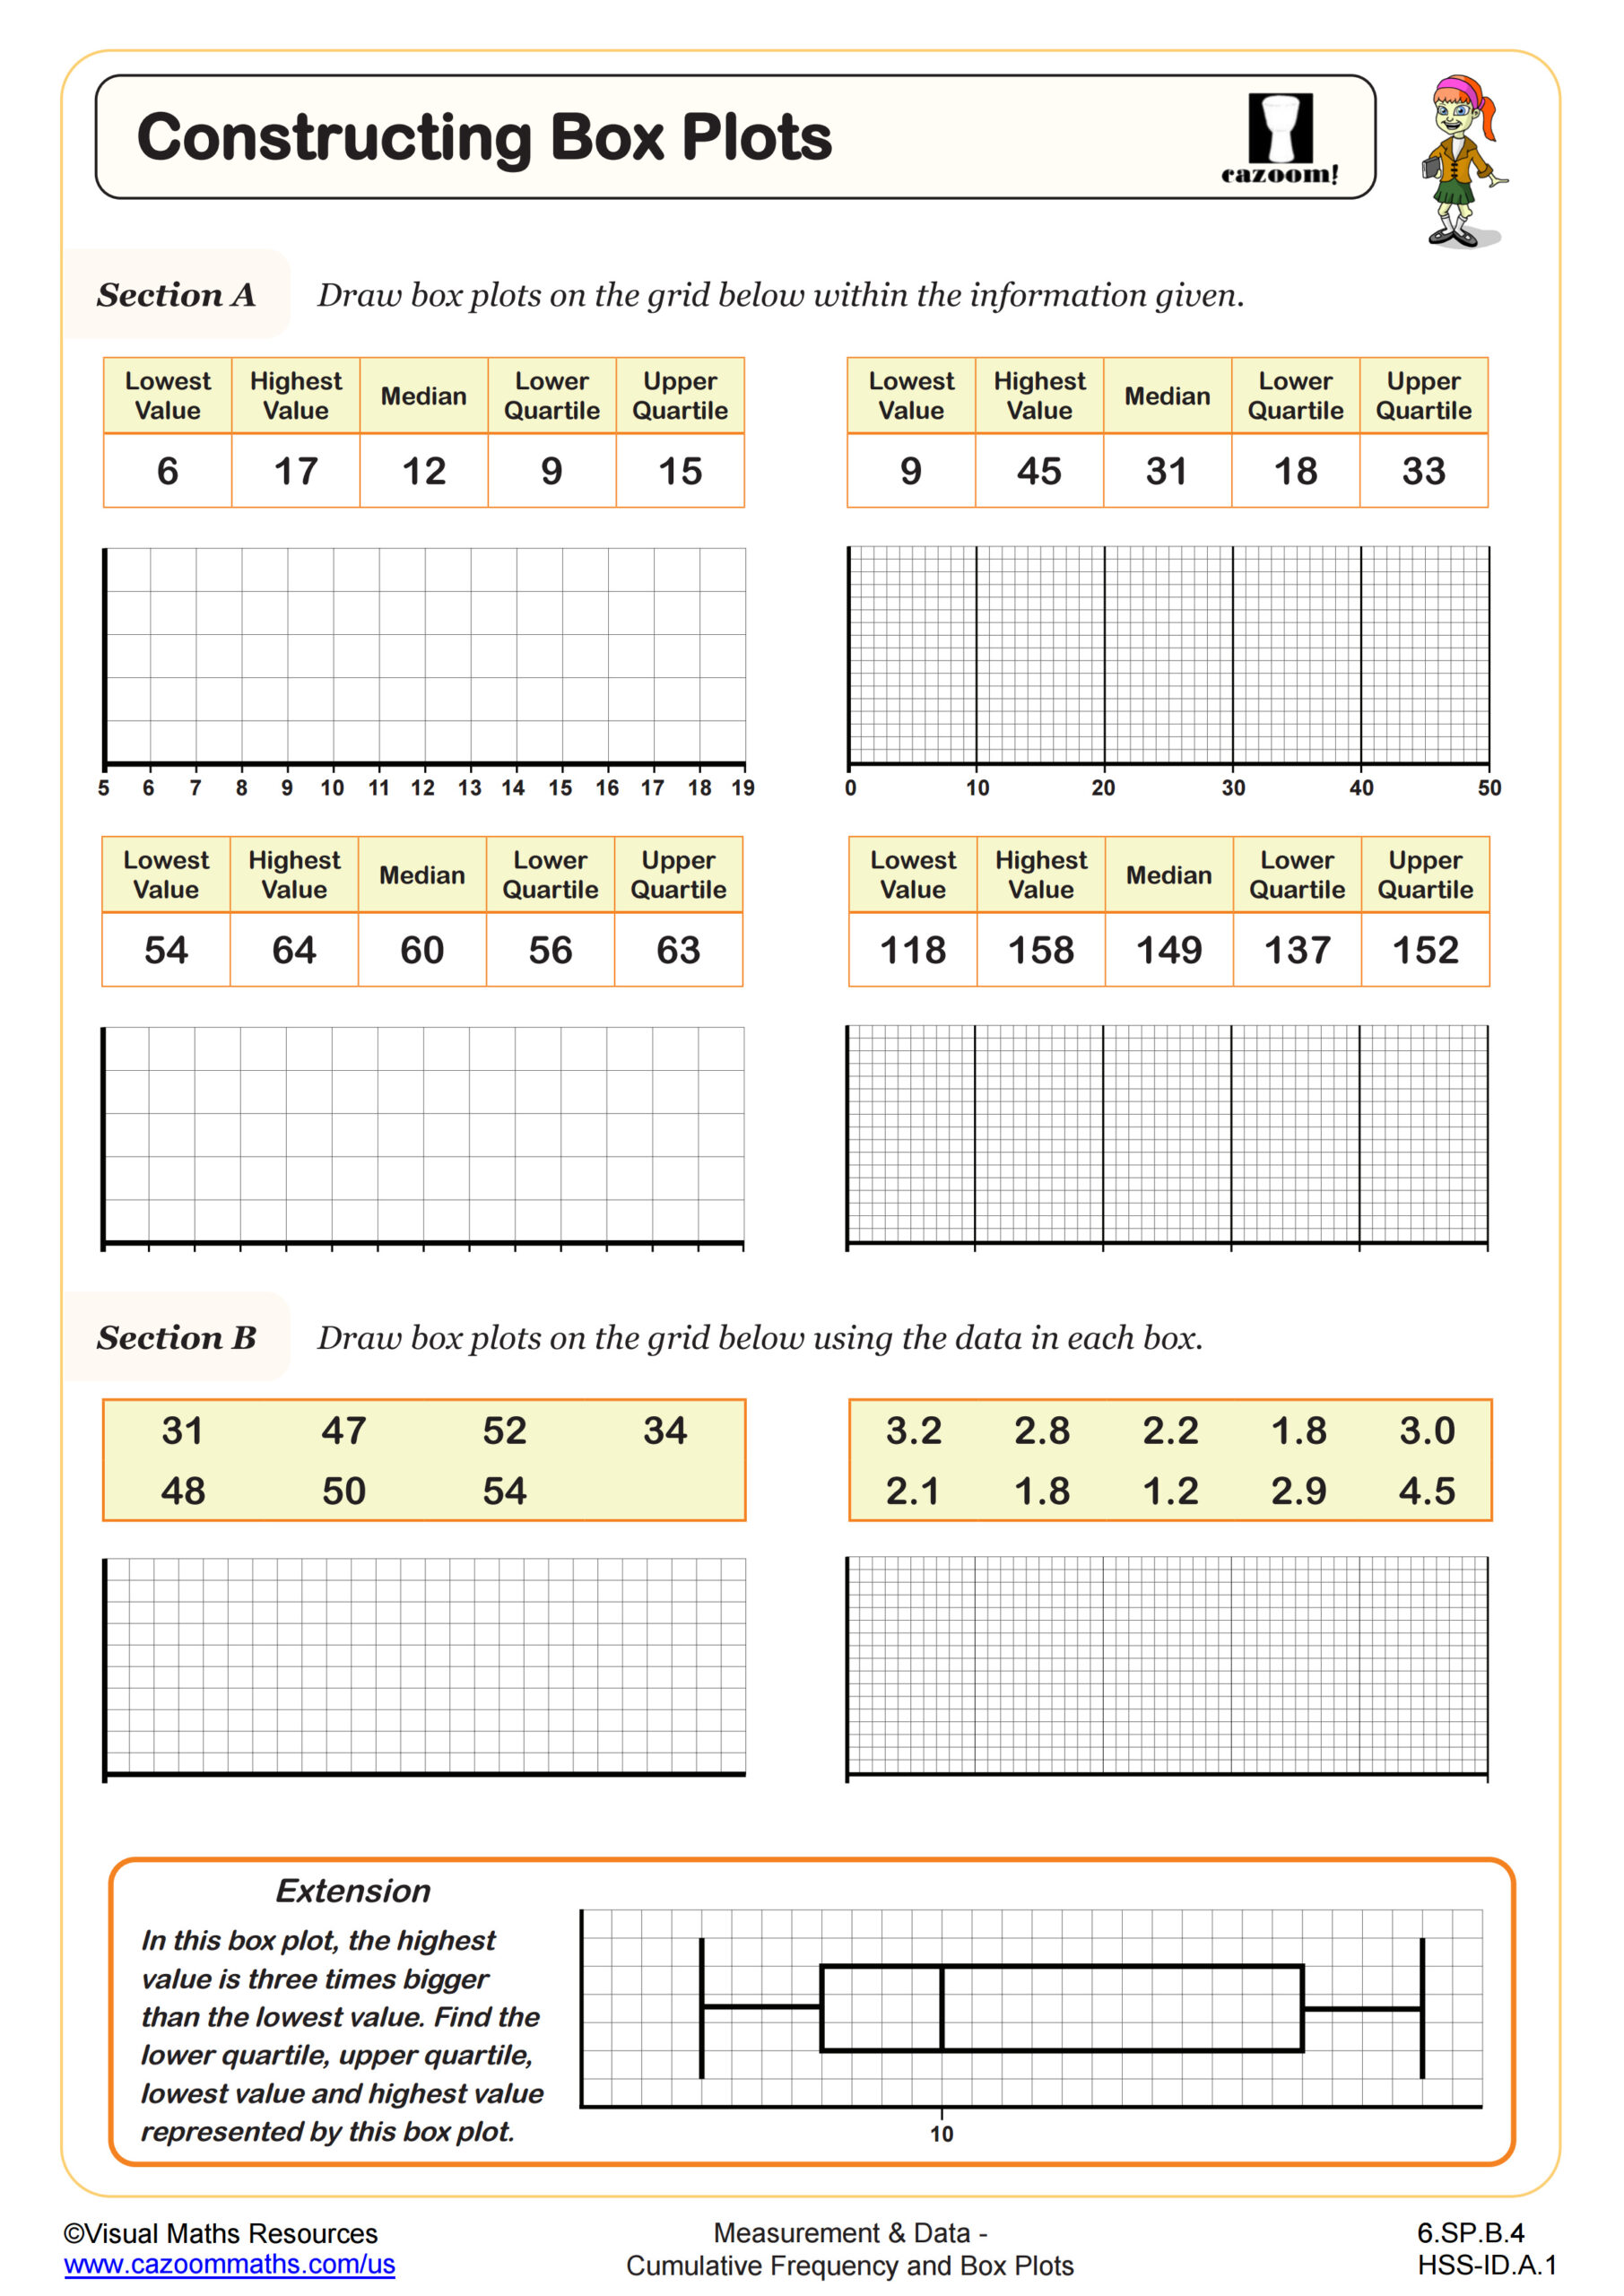
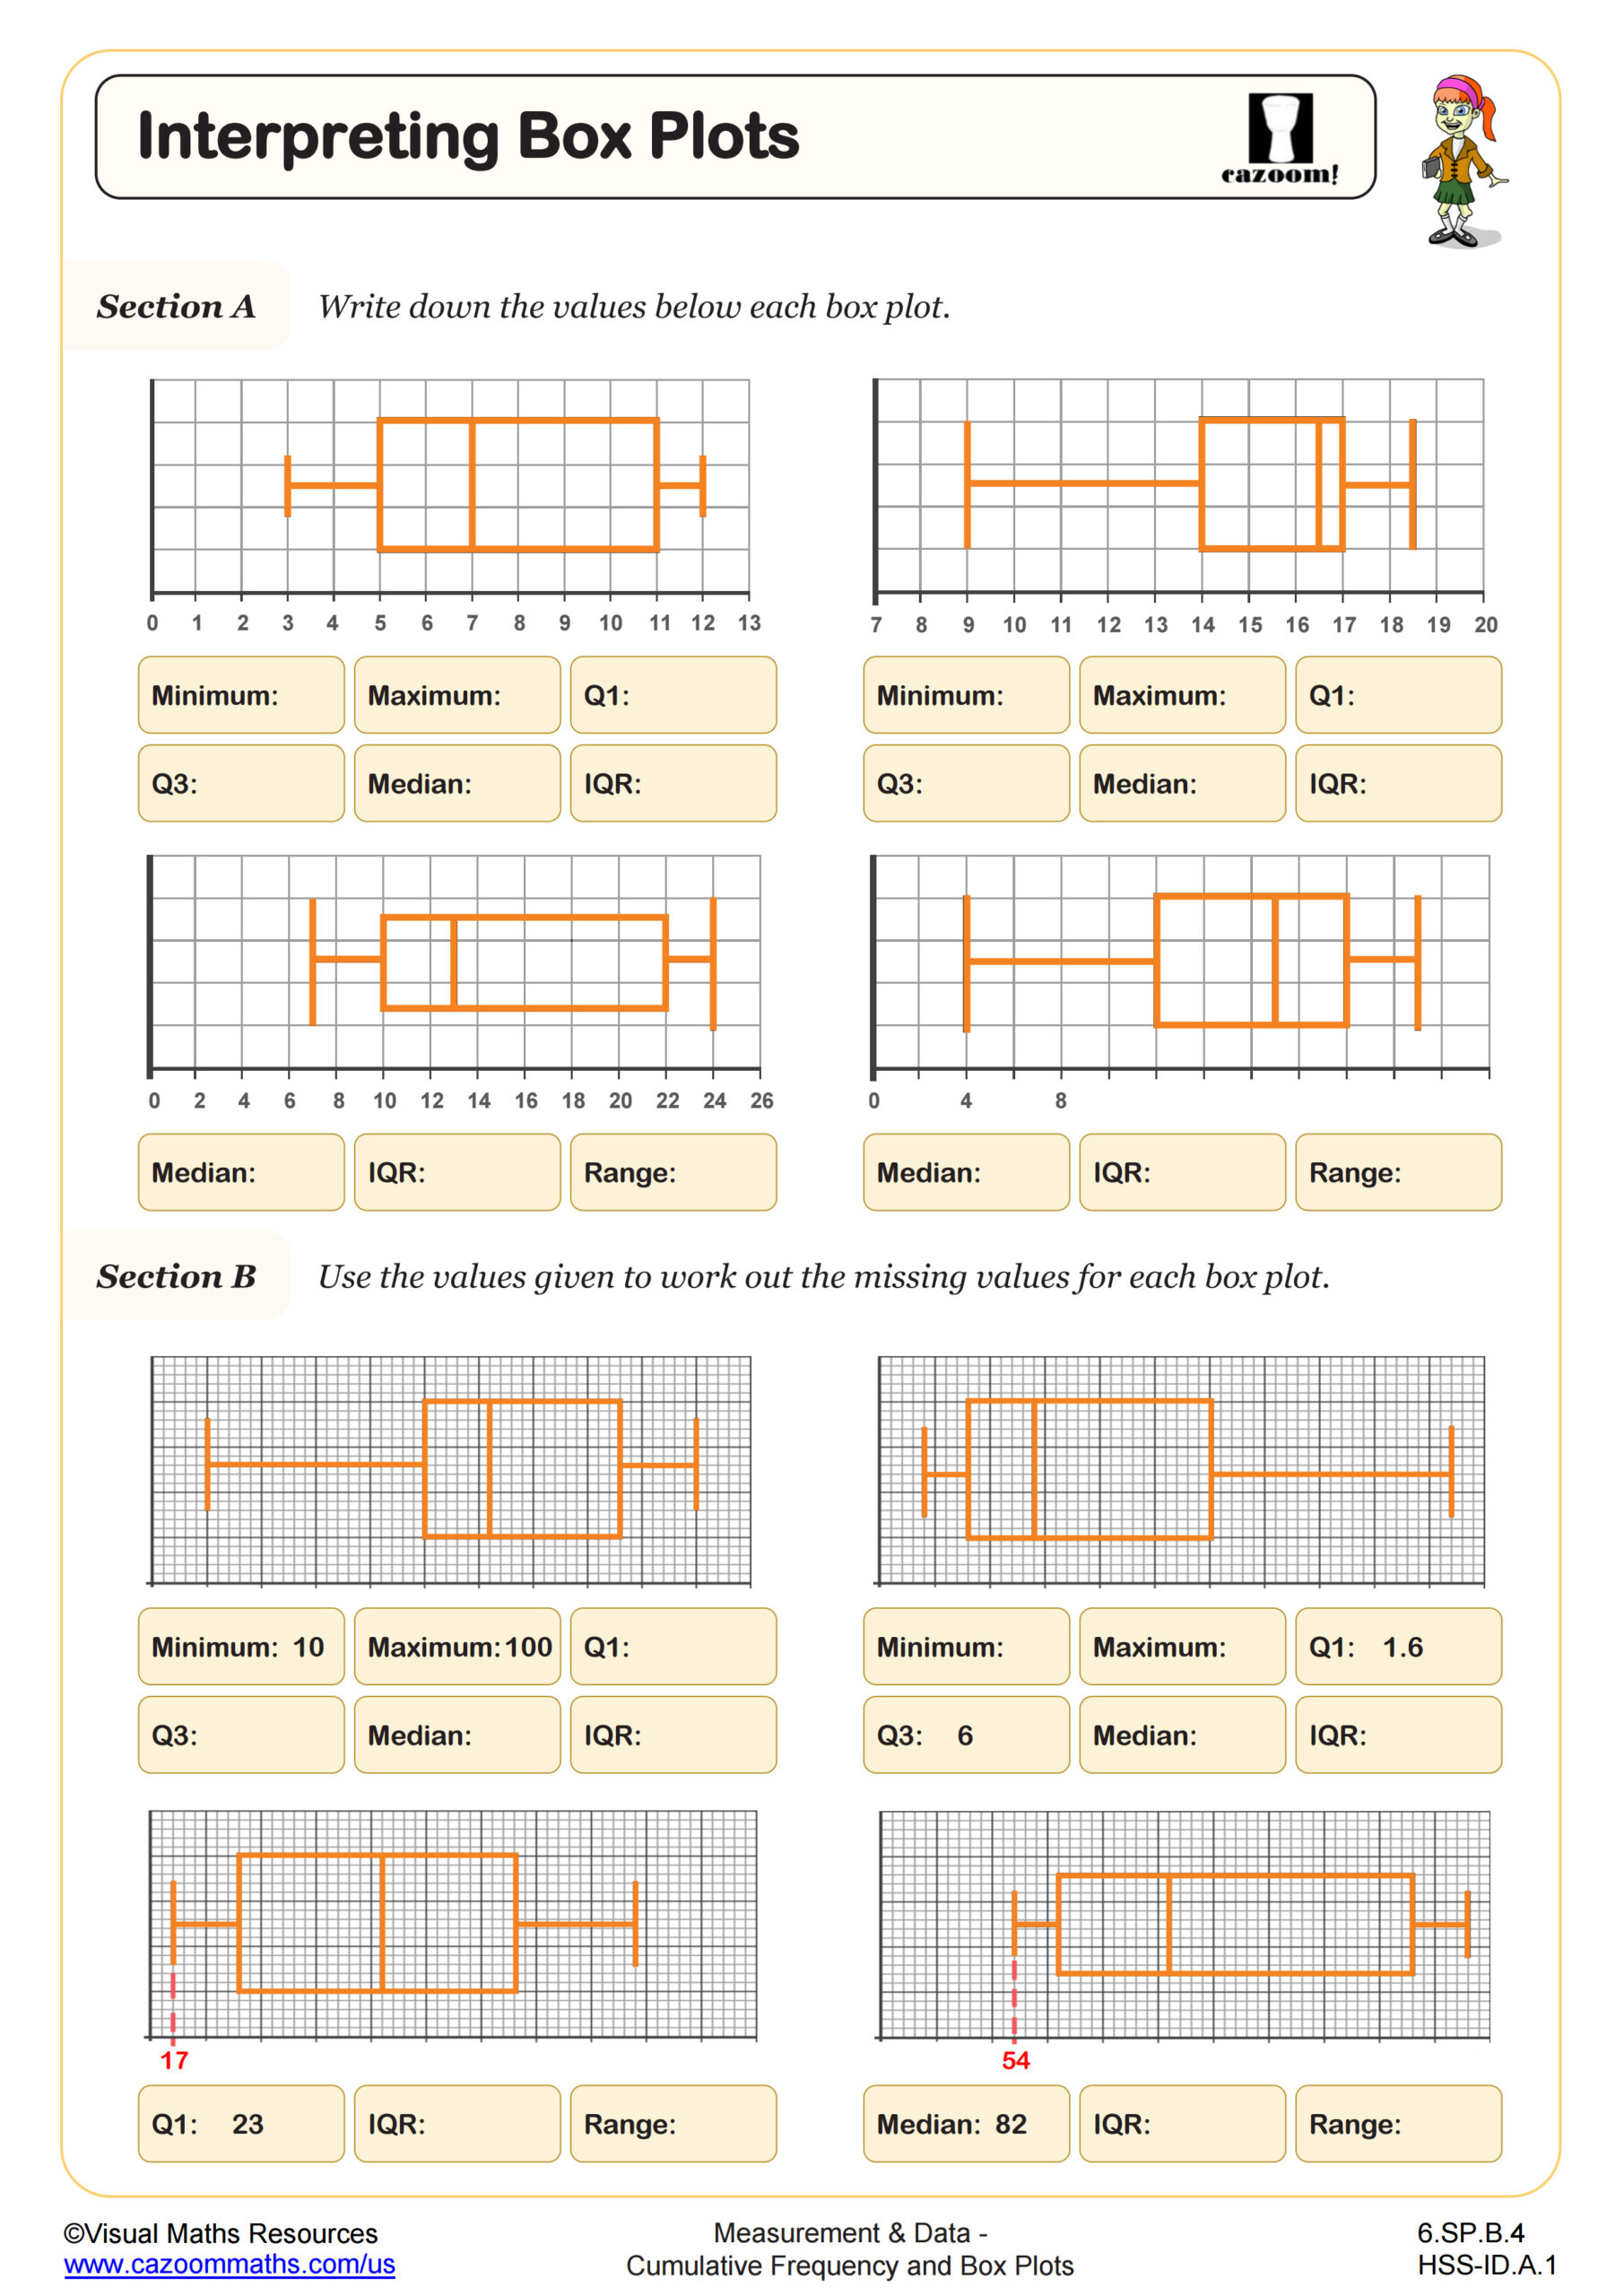
These worksheets guide students from interpreting given data to constructing their own cumulative frequency and box plots. Learners start with organized tables, then create graphs and calculate quartiles independently. Each worksheet includes a complete answer key that shows every calculation and graphing step. This collection covers data comparison, quartile analysis, and interpretation, strengthening understanding of data distribution and statistical reasoning through visual and numerical practice.
What Role Do Cumulative Frequency and Box Plots Activities Play in Developing Math Skills?
Teachers choose specific difficulty levels for student groups as part of their differentiated instruction approach. The advanced level of Extension questions aligns with the level of the foundation problems, providing support to students who need it. Teachers can identify student misunderstandings immediately through the structured format while students complete their work.
The answer keys provide a detailed explanation of the entire solution process for each problem. The system decreases grading work while allowing teachers to present methods in an easy-to-understand format. Students will perform self-assessment during their independent work time. Teachers assign these sheets to students for their homework and retrieval practice activities. The standardized format enables students to concentrate on mathematical content instead of following directions.
Where Box Plot Skills Apply Beyond the Classroom
Statistics and data visualization appear everywhere in modern life. Students use box plots to compare test scores across different classes. They analyze sports statistics and player performance data. Weather services display temperature ranges using similar visual methods.
• Compare prices across stores
• Understand medical test results
• Read economic reports and market trends
• Interpret scientific research data