High School Histograms and Frequency Polygon Worksheets
All worksheets are created by the team of experienced teachers at Cazoom Math.
Where can teachers find frequency polygon example problems pdf resources with detailed solutions?
Teachers can access frequency polygon worksheet pdf materials through specialized math worksheet platforms that provide structured practice problems with thorough answer keys. These resources typically include step-by-step examples showing how to convert histogram data into frequency polygon format, calculate class midpoints, and plot coordinate points accurately.
Math educators notice that students benefit most from seeing multiple worked examples before attempting independent practice. The most effective frequency polygon example problems pdf files include both grouped and ungrouped data sets, allowing students to practice with various data types they encounter in statistics courses and standardized assessments.
What grade levels typically cover histograms and frequency polygons in the curriculum?
High school students encounter histograms and frequency polygons primarily in Algebra 2, Statistics, and Pre-Calculus courses, typically during grades 9-12. The Common Core State Standards introduce these concepts in the Statistics and Probability domain, where students analyze data distributions and compare different graphical representations.
Teachers observe that students who master these concepts in high school are better prepared for AP Statistics and college-level data analysis courses. The progression moves from basic histogram construction in earlier grades to sophisticated frequency polygon interpretation and comparison, building foundation skills for STEM fields that rely heavily on statistical analysis and data visualization.
How do students learn the connection between histograms and frequency polygons?
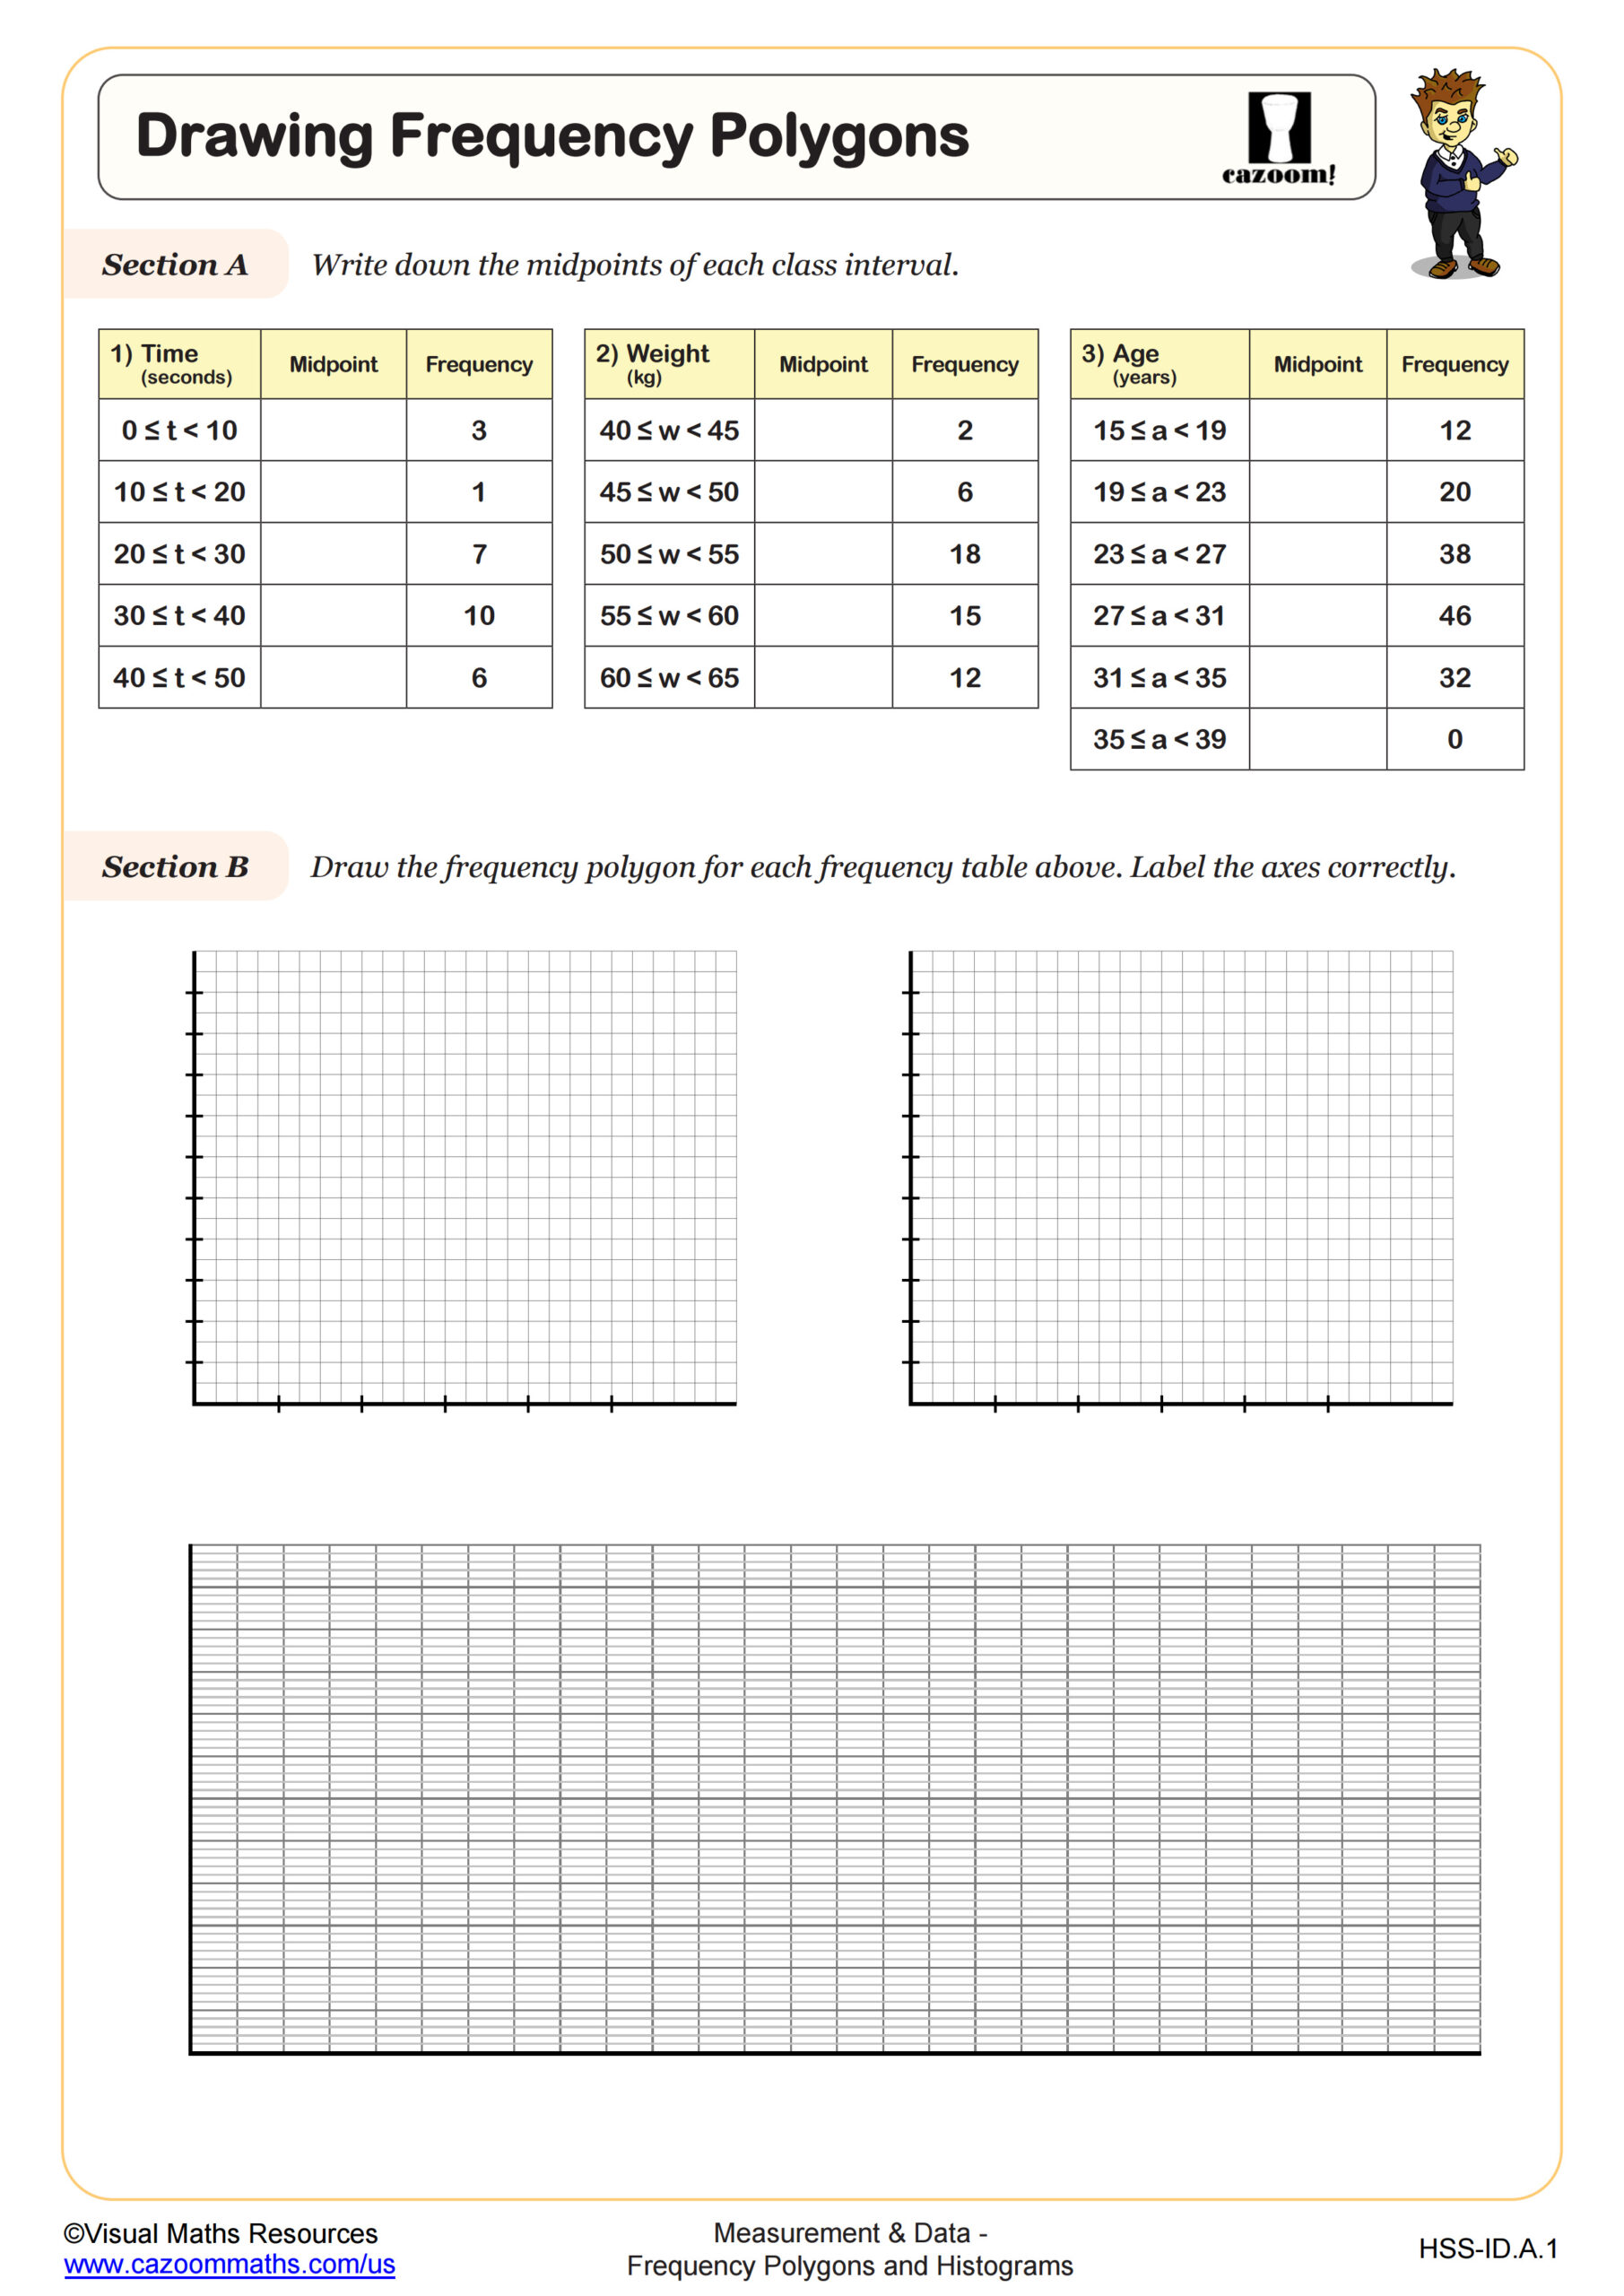
Students develop understanding by practicing the conversion process from histogram bars to frequency polygon points, focusing on identifying class midpoints and corresponding frequencies. The key insight involves recognizing that frequency polygon vertices correspond to the midpoints of histogram class intervals at the same height as the bar tops.
Math teachers frequently notice that students initially plot points at class boundaries rather than midpoints, leading to incorrect polygon shapes. Effective instruction emphasizes the relationship between these two graphical representations, showing how frequency polygons provide smoother curves that highlight distribution patterns more clearly than histograms, particularly useful in quality control applications in manufacturing and engineering.
What teaching strategies work best when using histogram and frequency polygon worksheets?
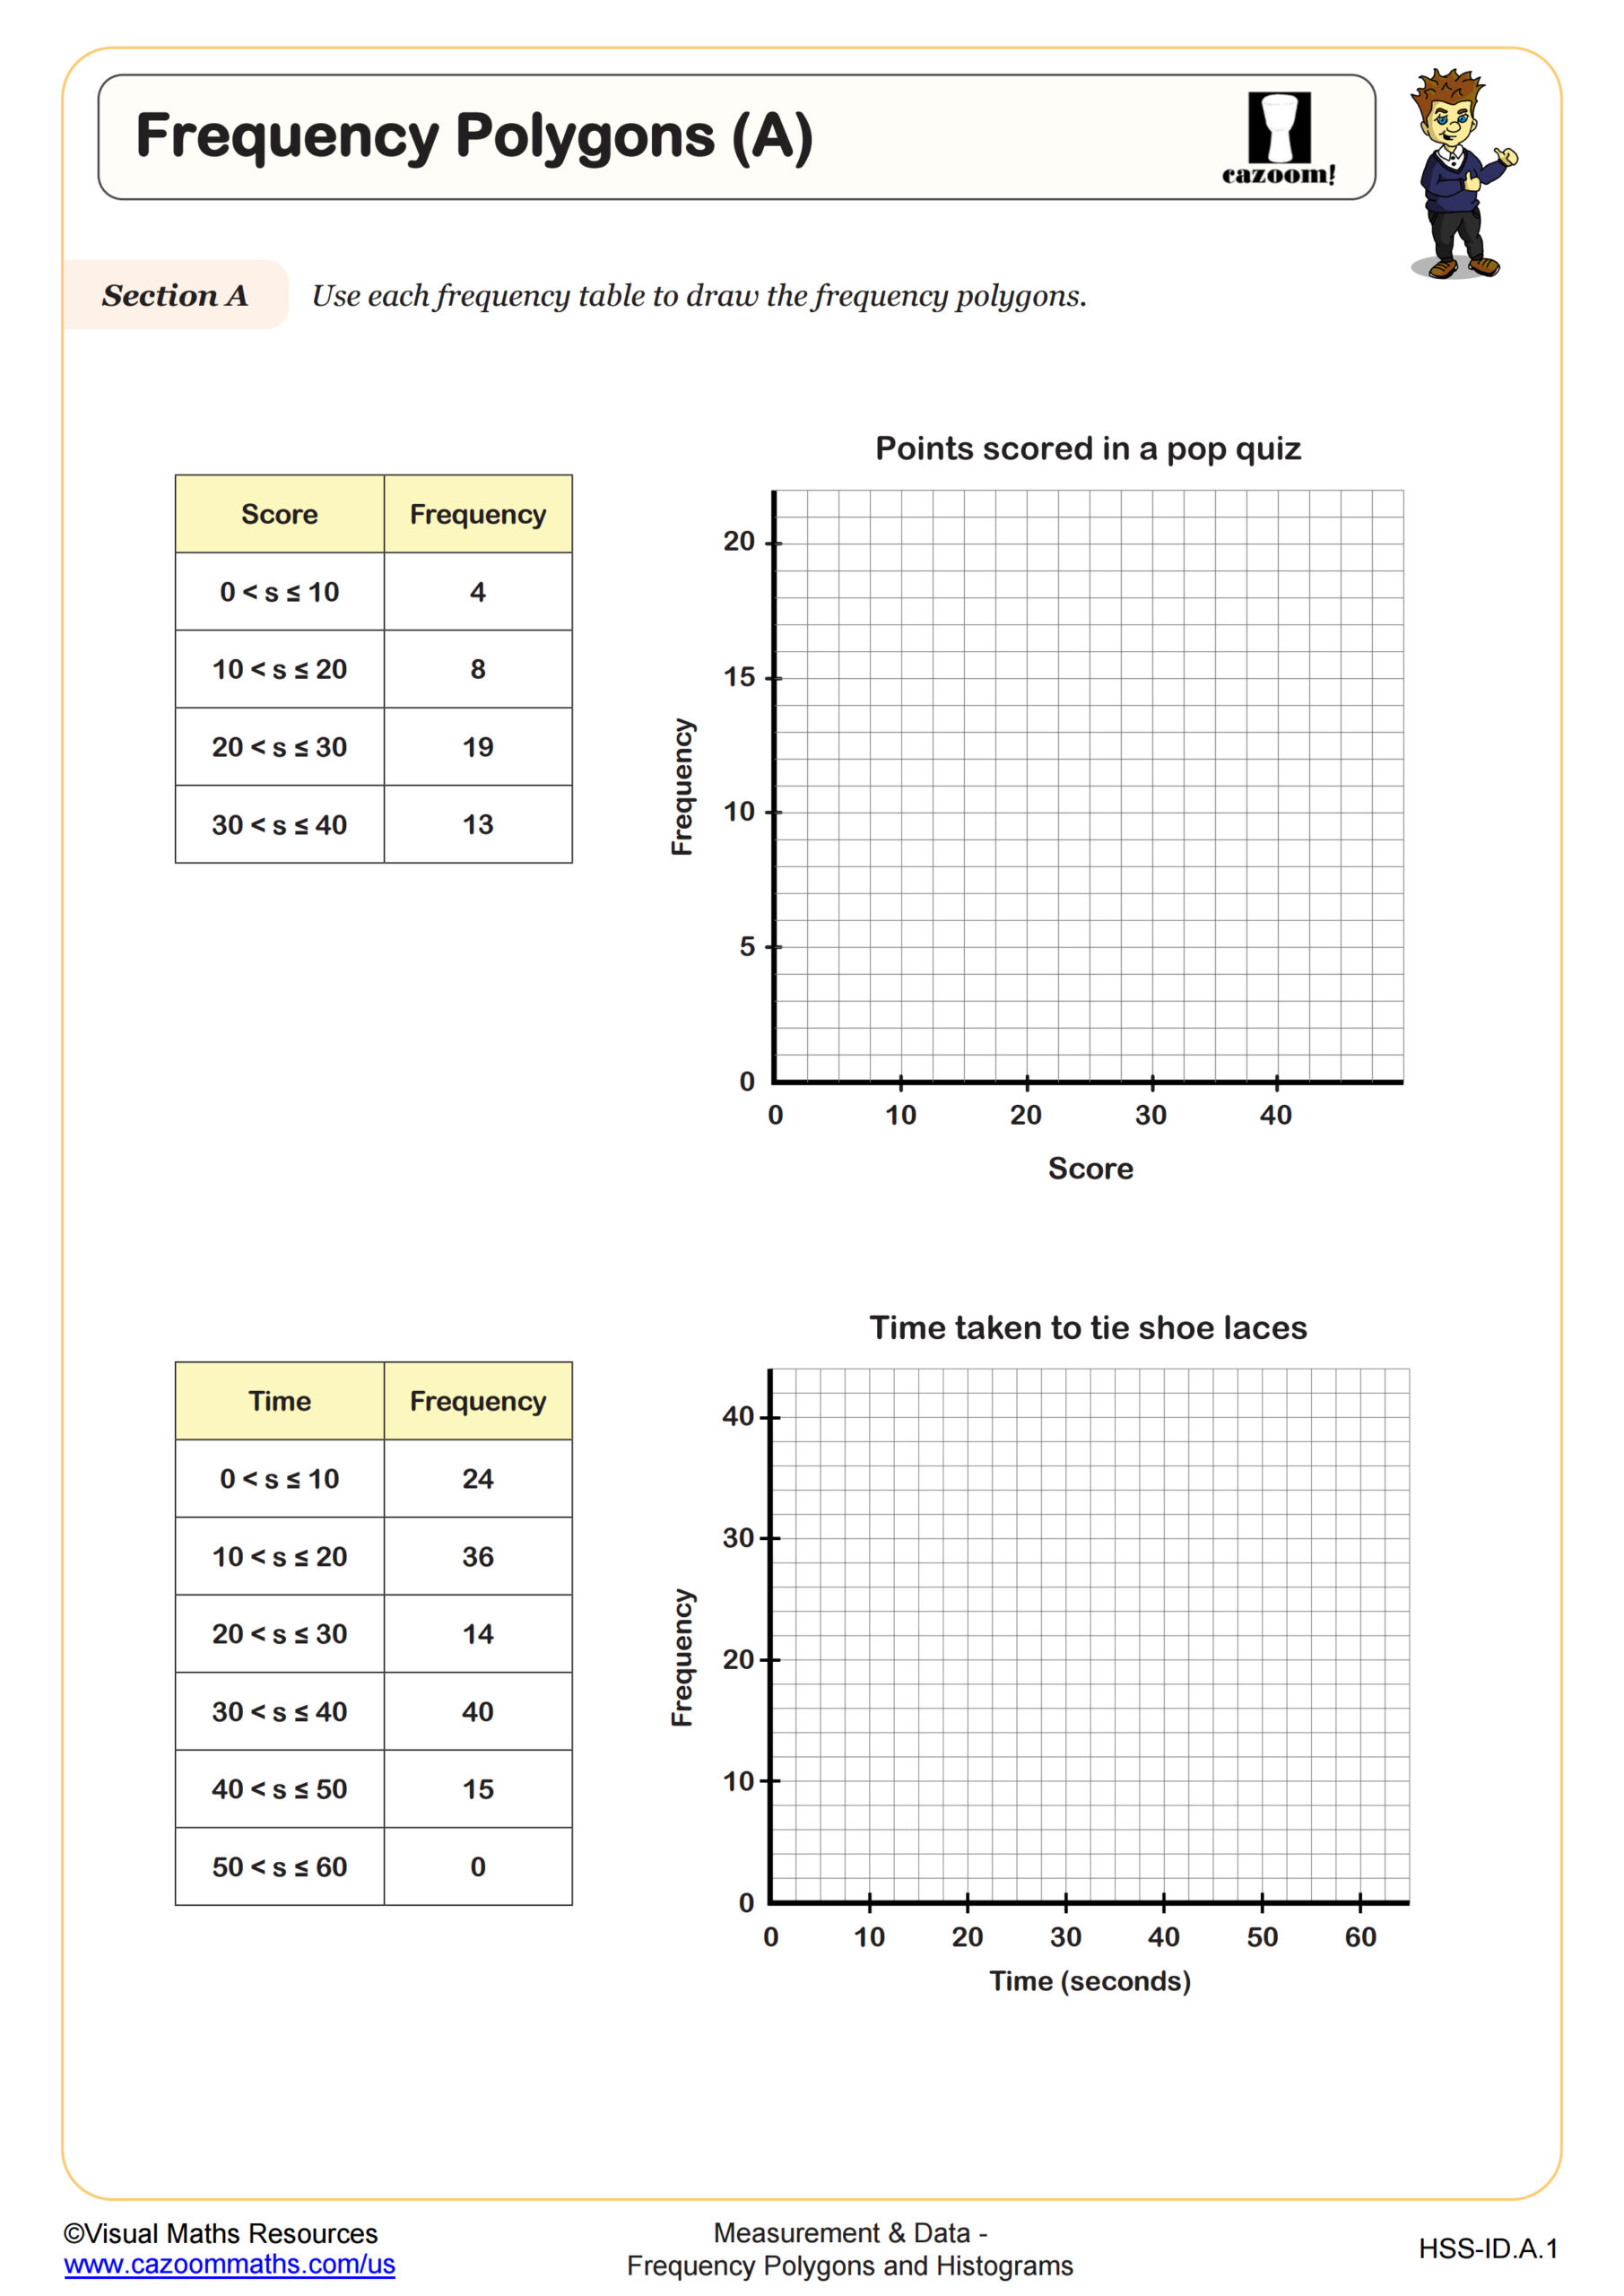
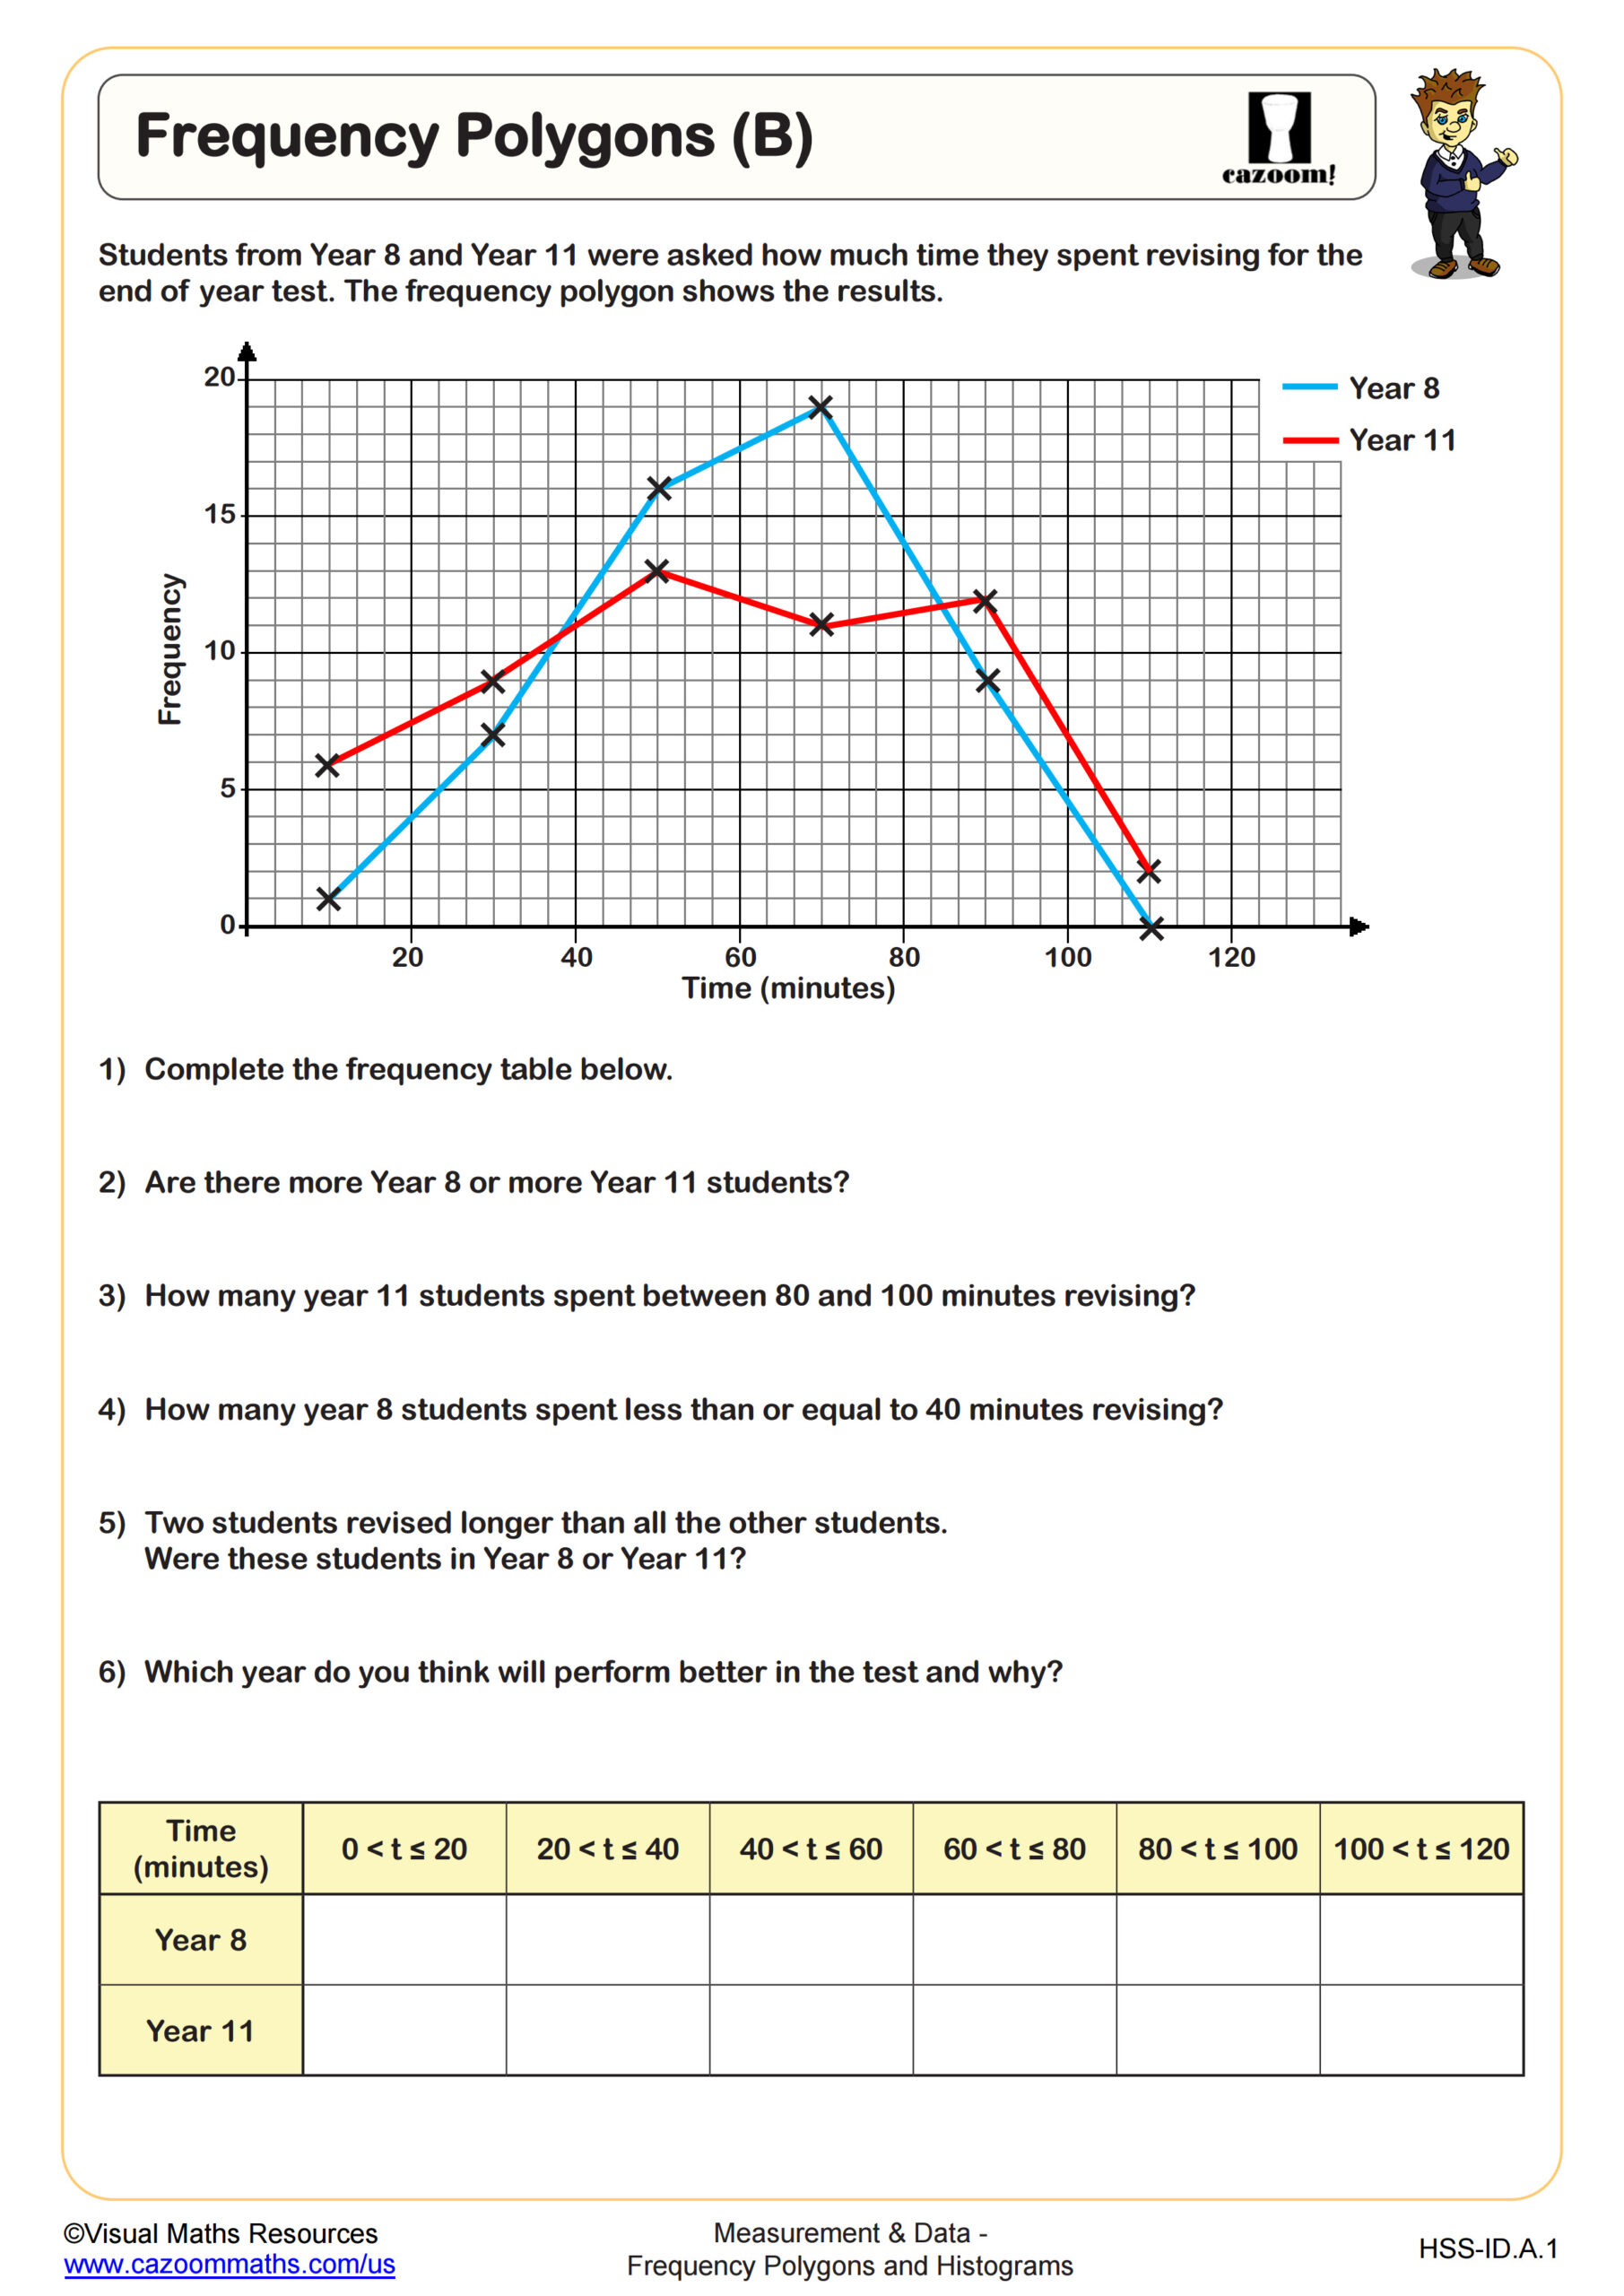
Teachers find success by having students work with the same data set to create both histograms and frequency polygons, allowing direct comparison between the two representations. This approach helps students understand how each graph type reveals different aspects of data distribution patterns and trends.
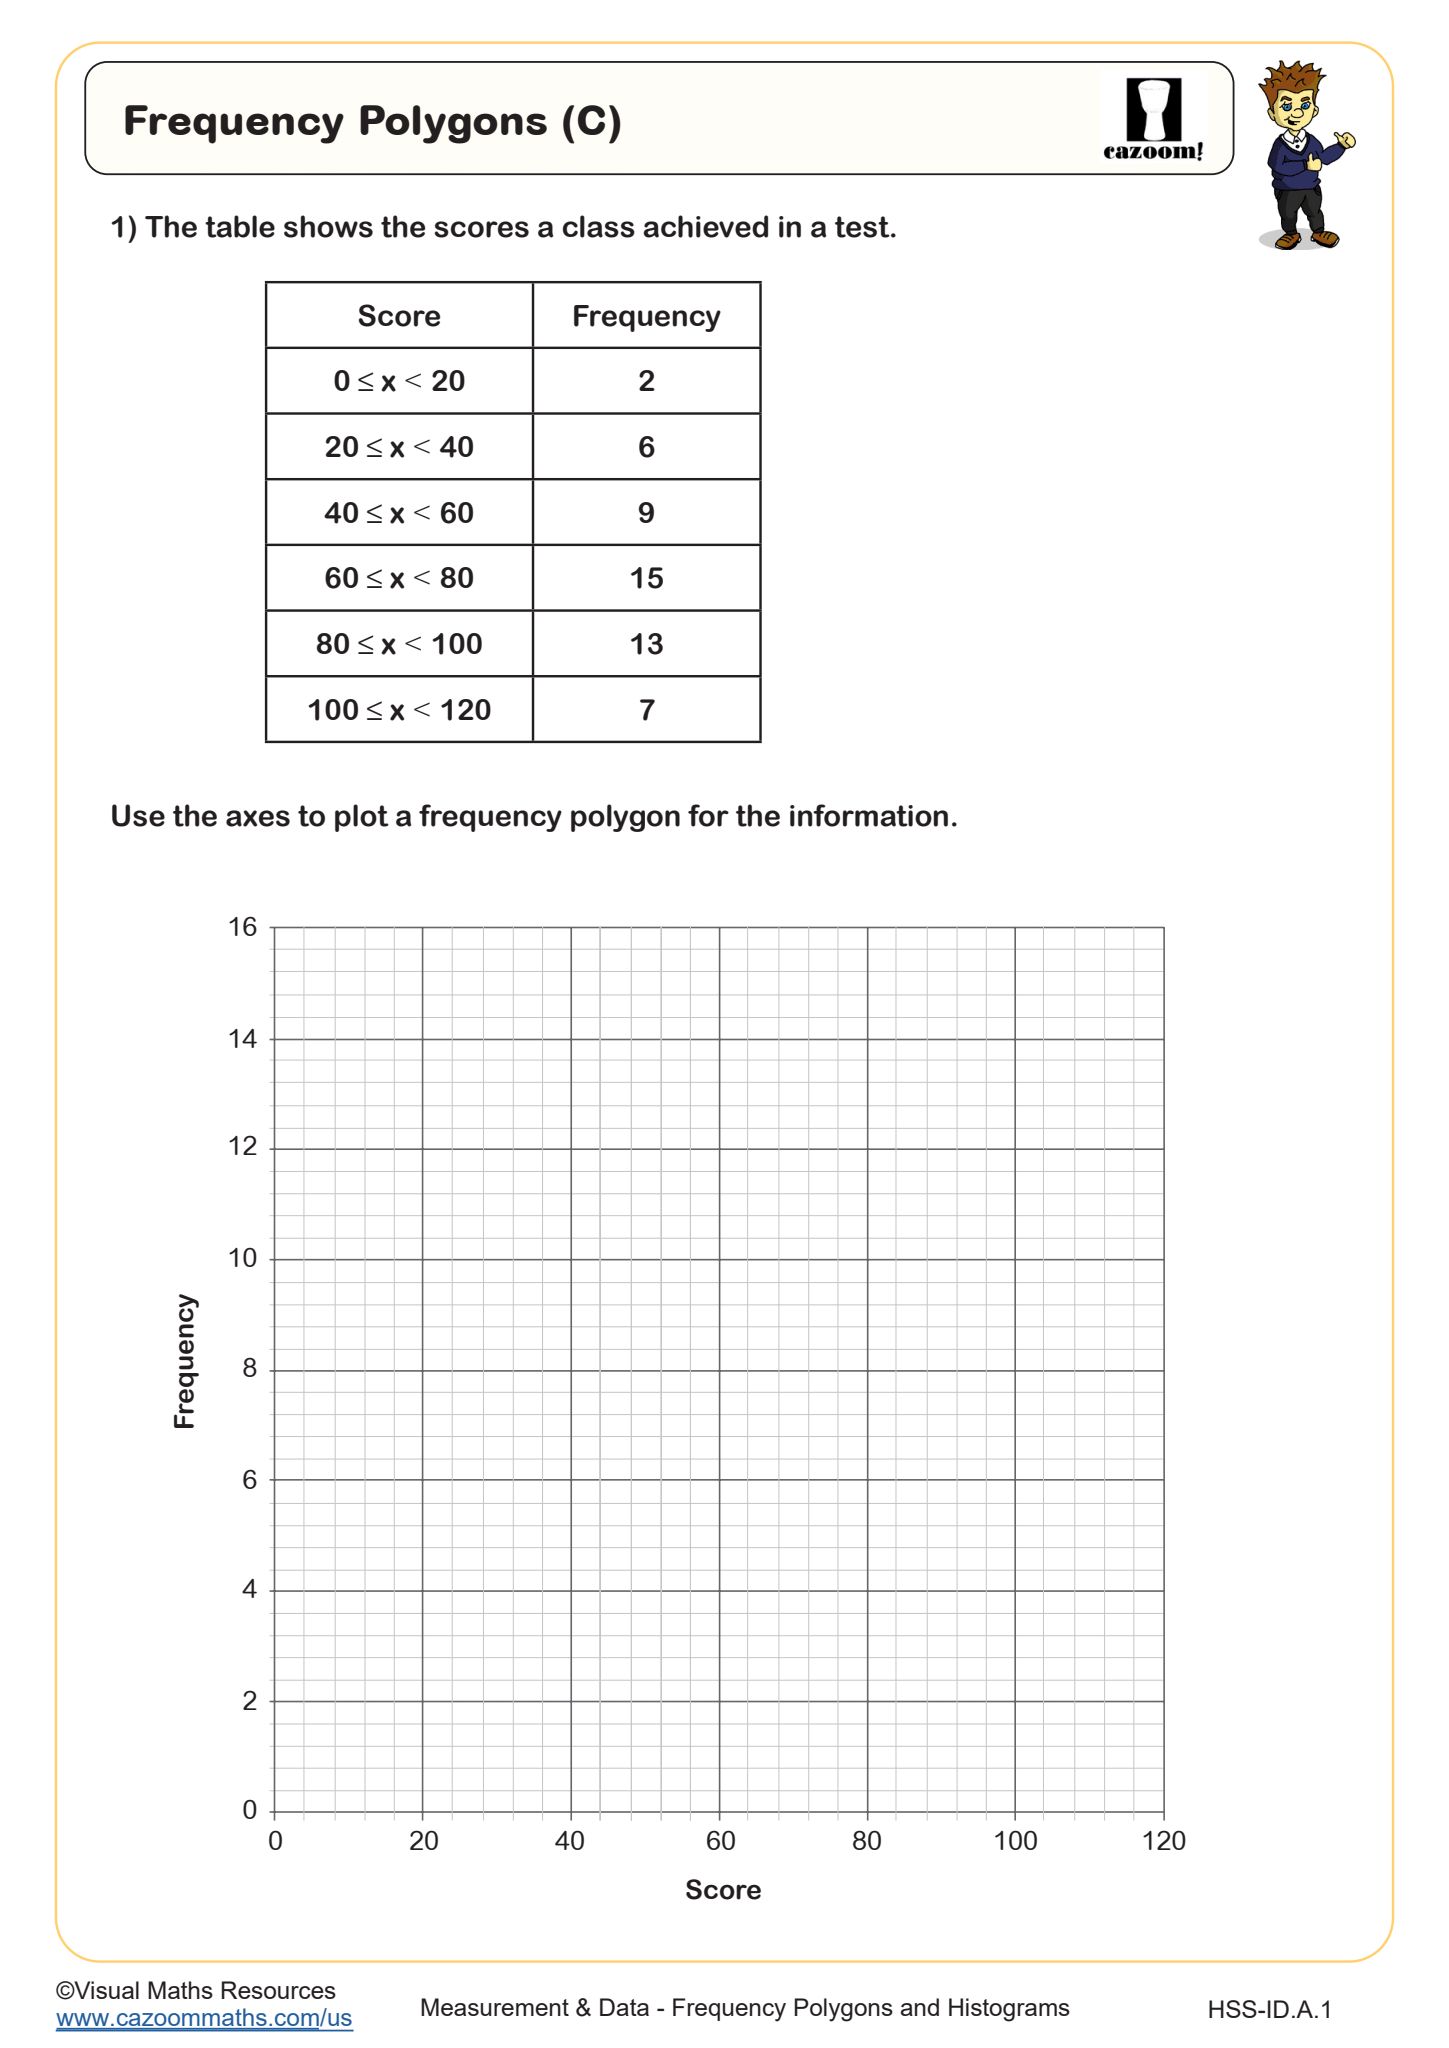
Experienced educators recommend starting with worksheets that provide partially completed examples, gradually moving to independent construction problems. Students benefit from practicing with real-world data sets, such as test scores or survey results, which makes the statistical concepts more meaningful and connects to practical applications in business analytics and scientific research.