High School Inequalities Worksheets
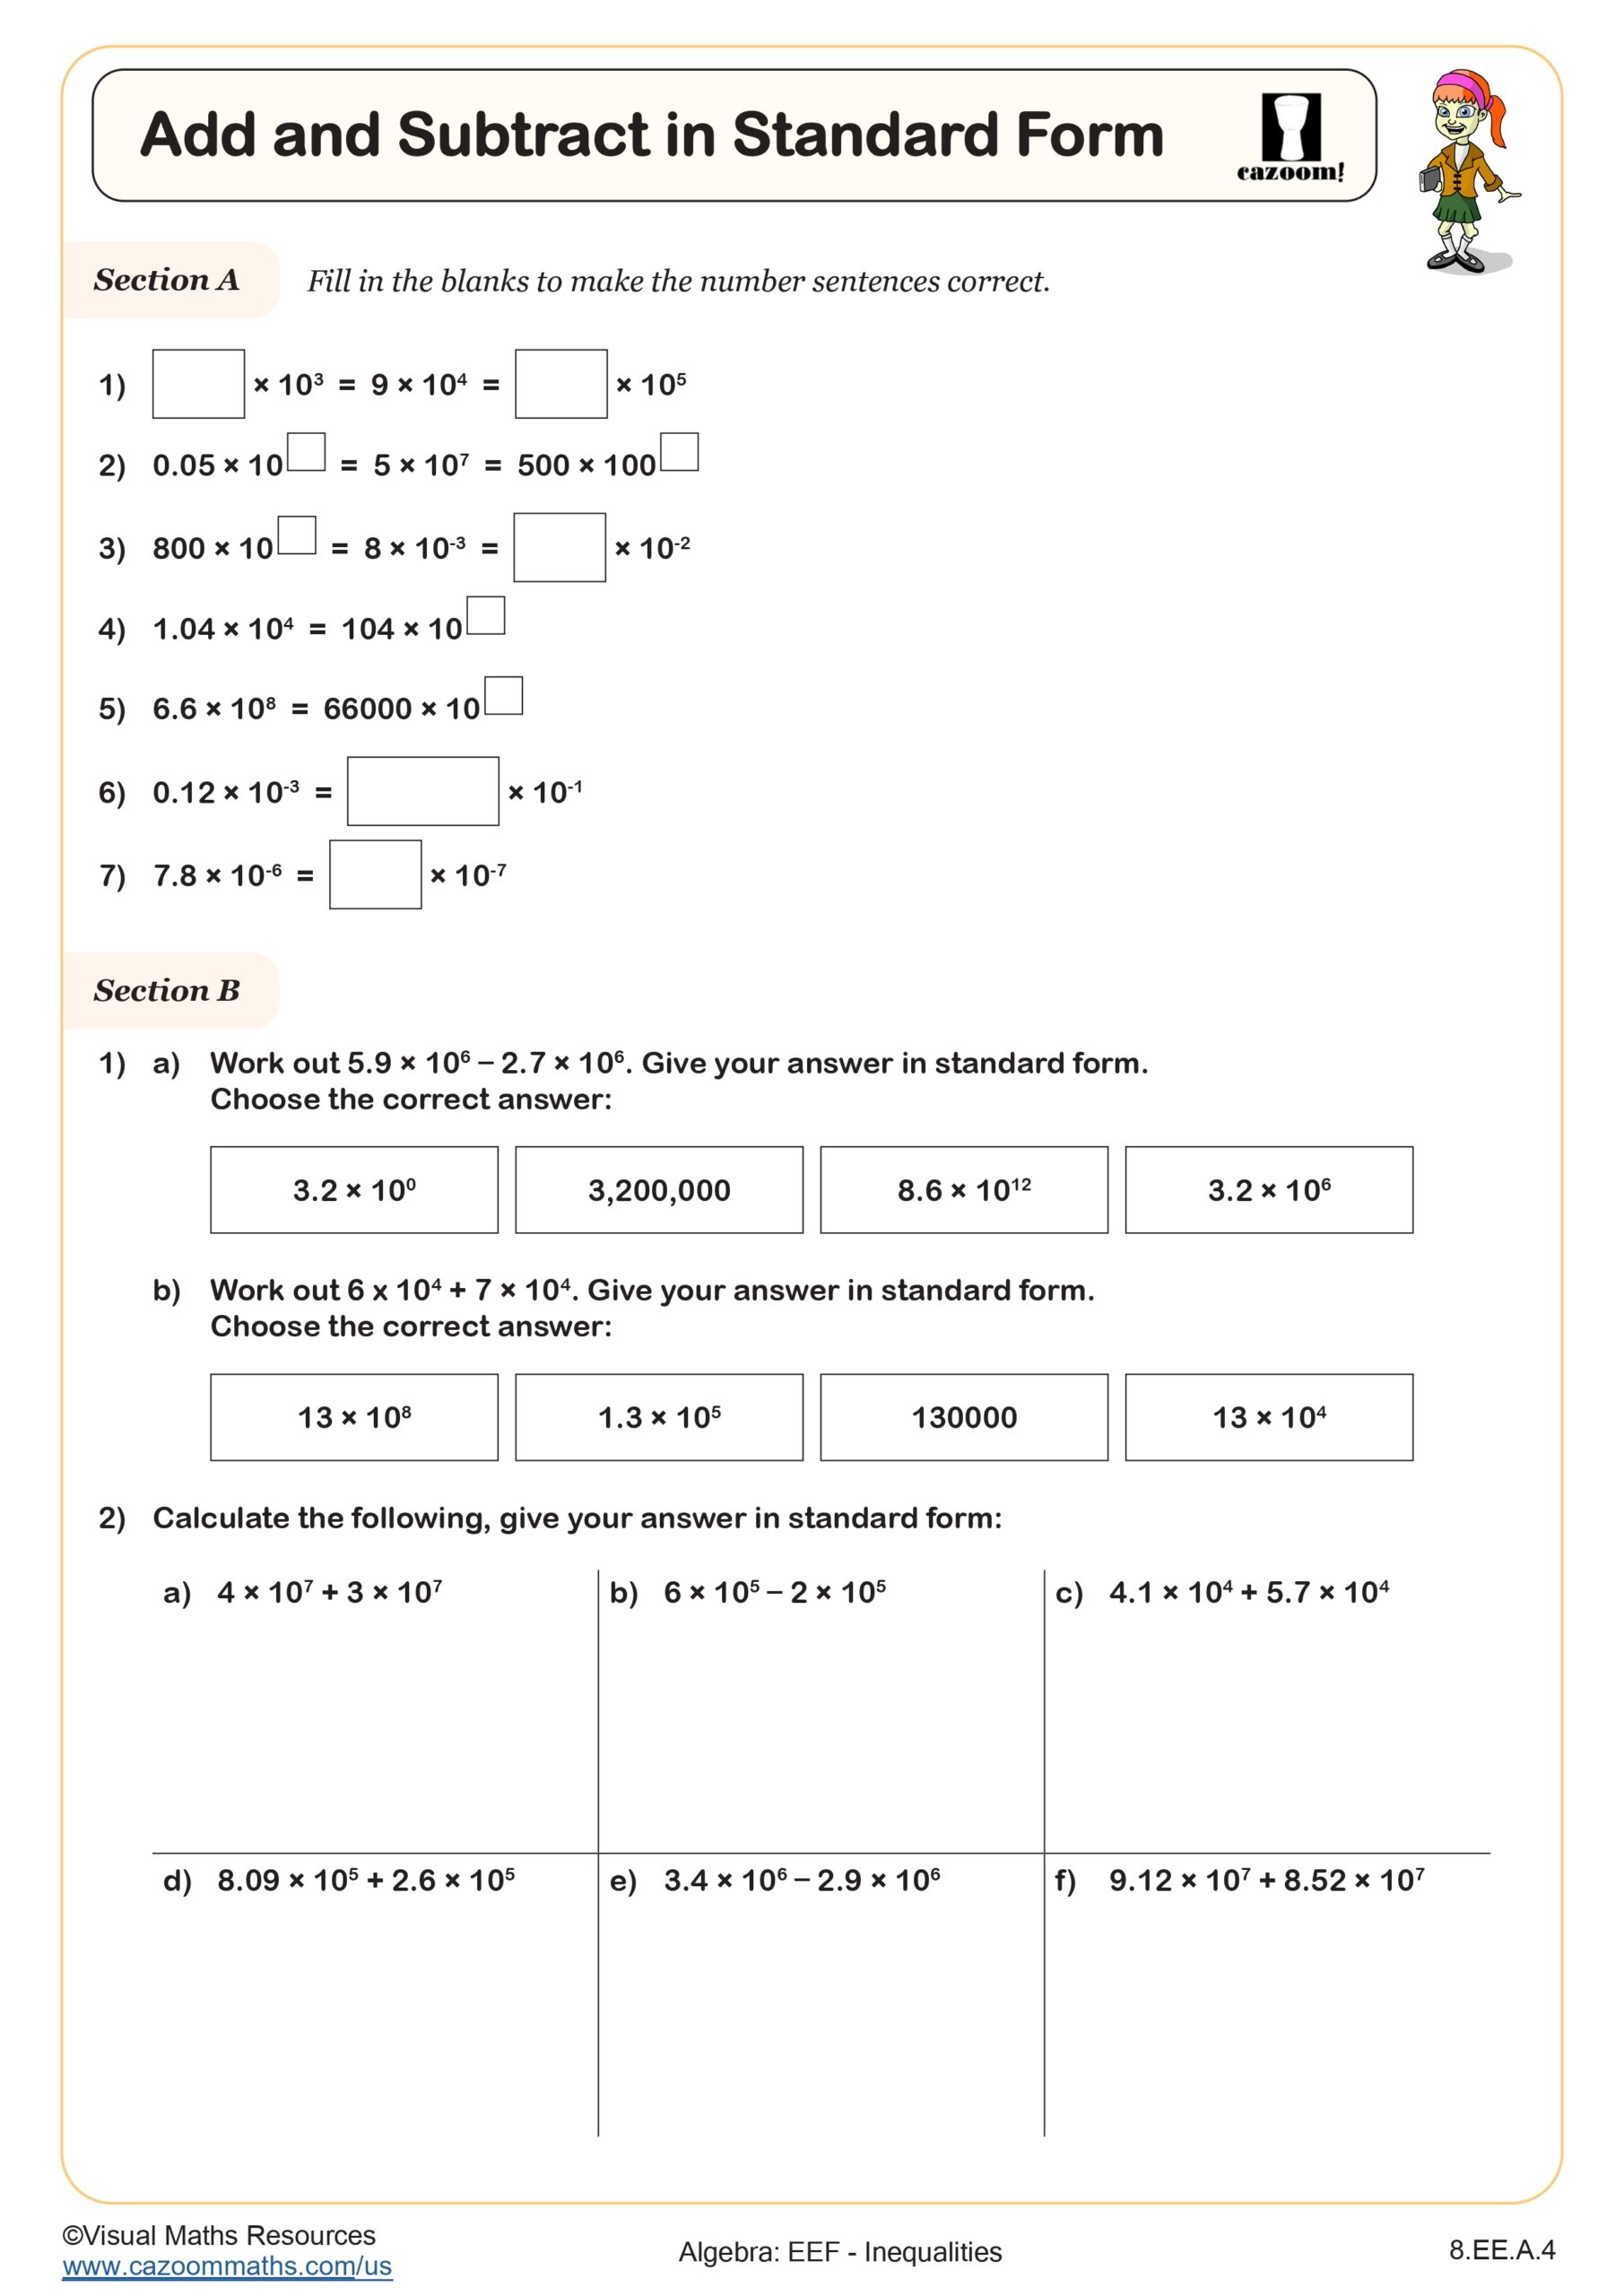
Add and Subtract in Standard Form
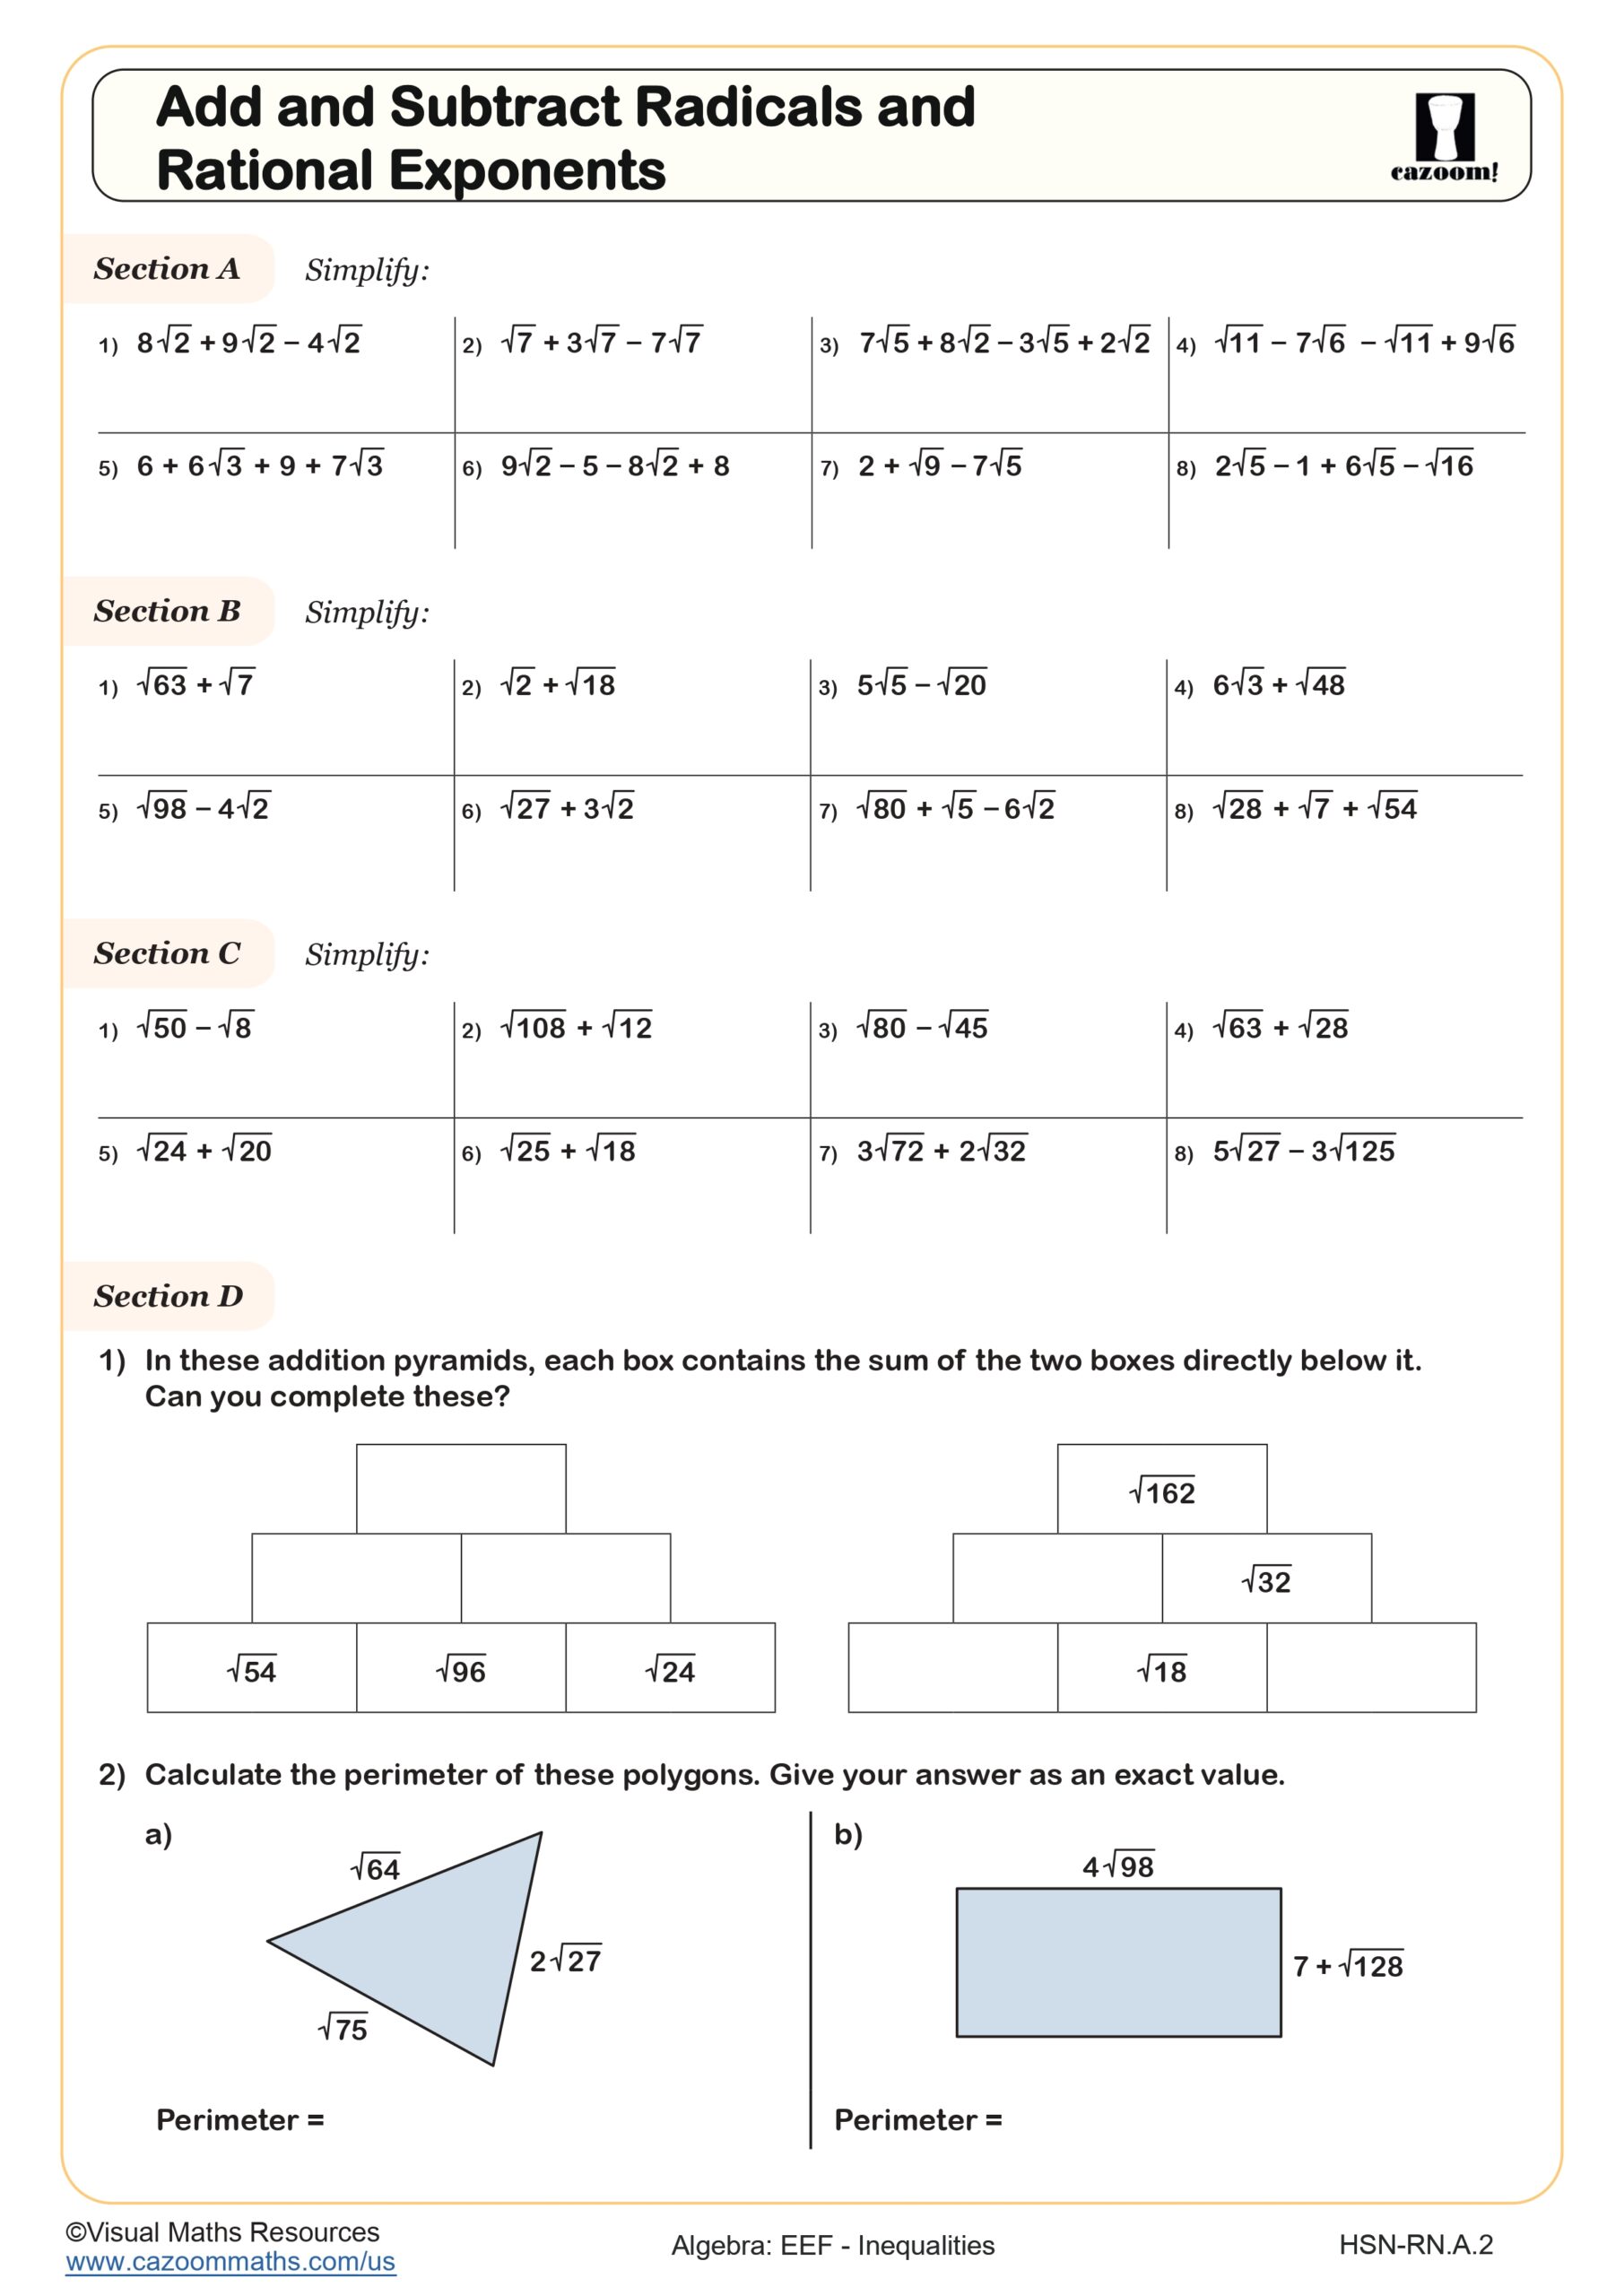
Add and Subtract Radicals and Rational Exponents
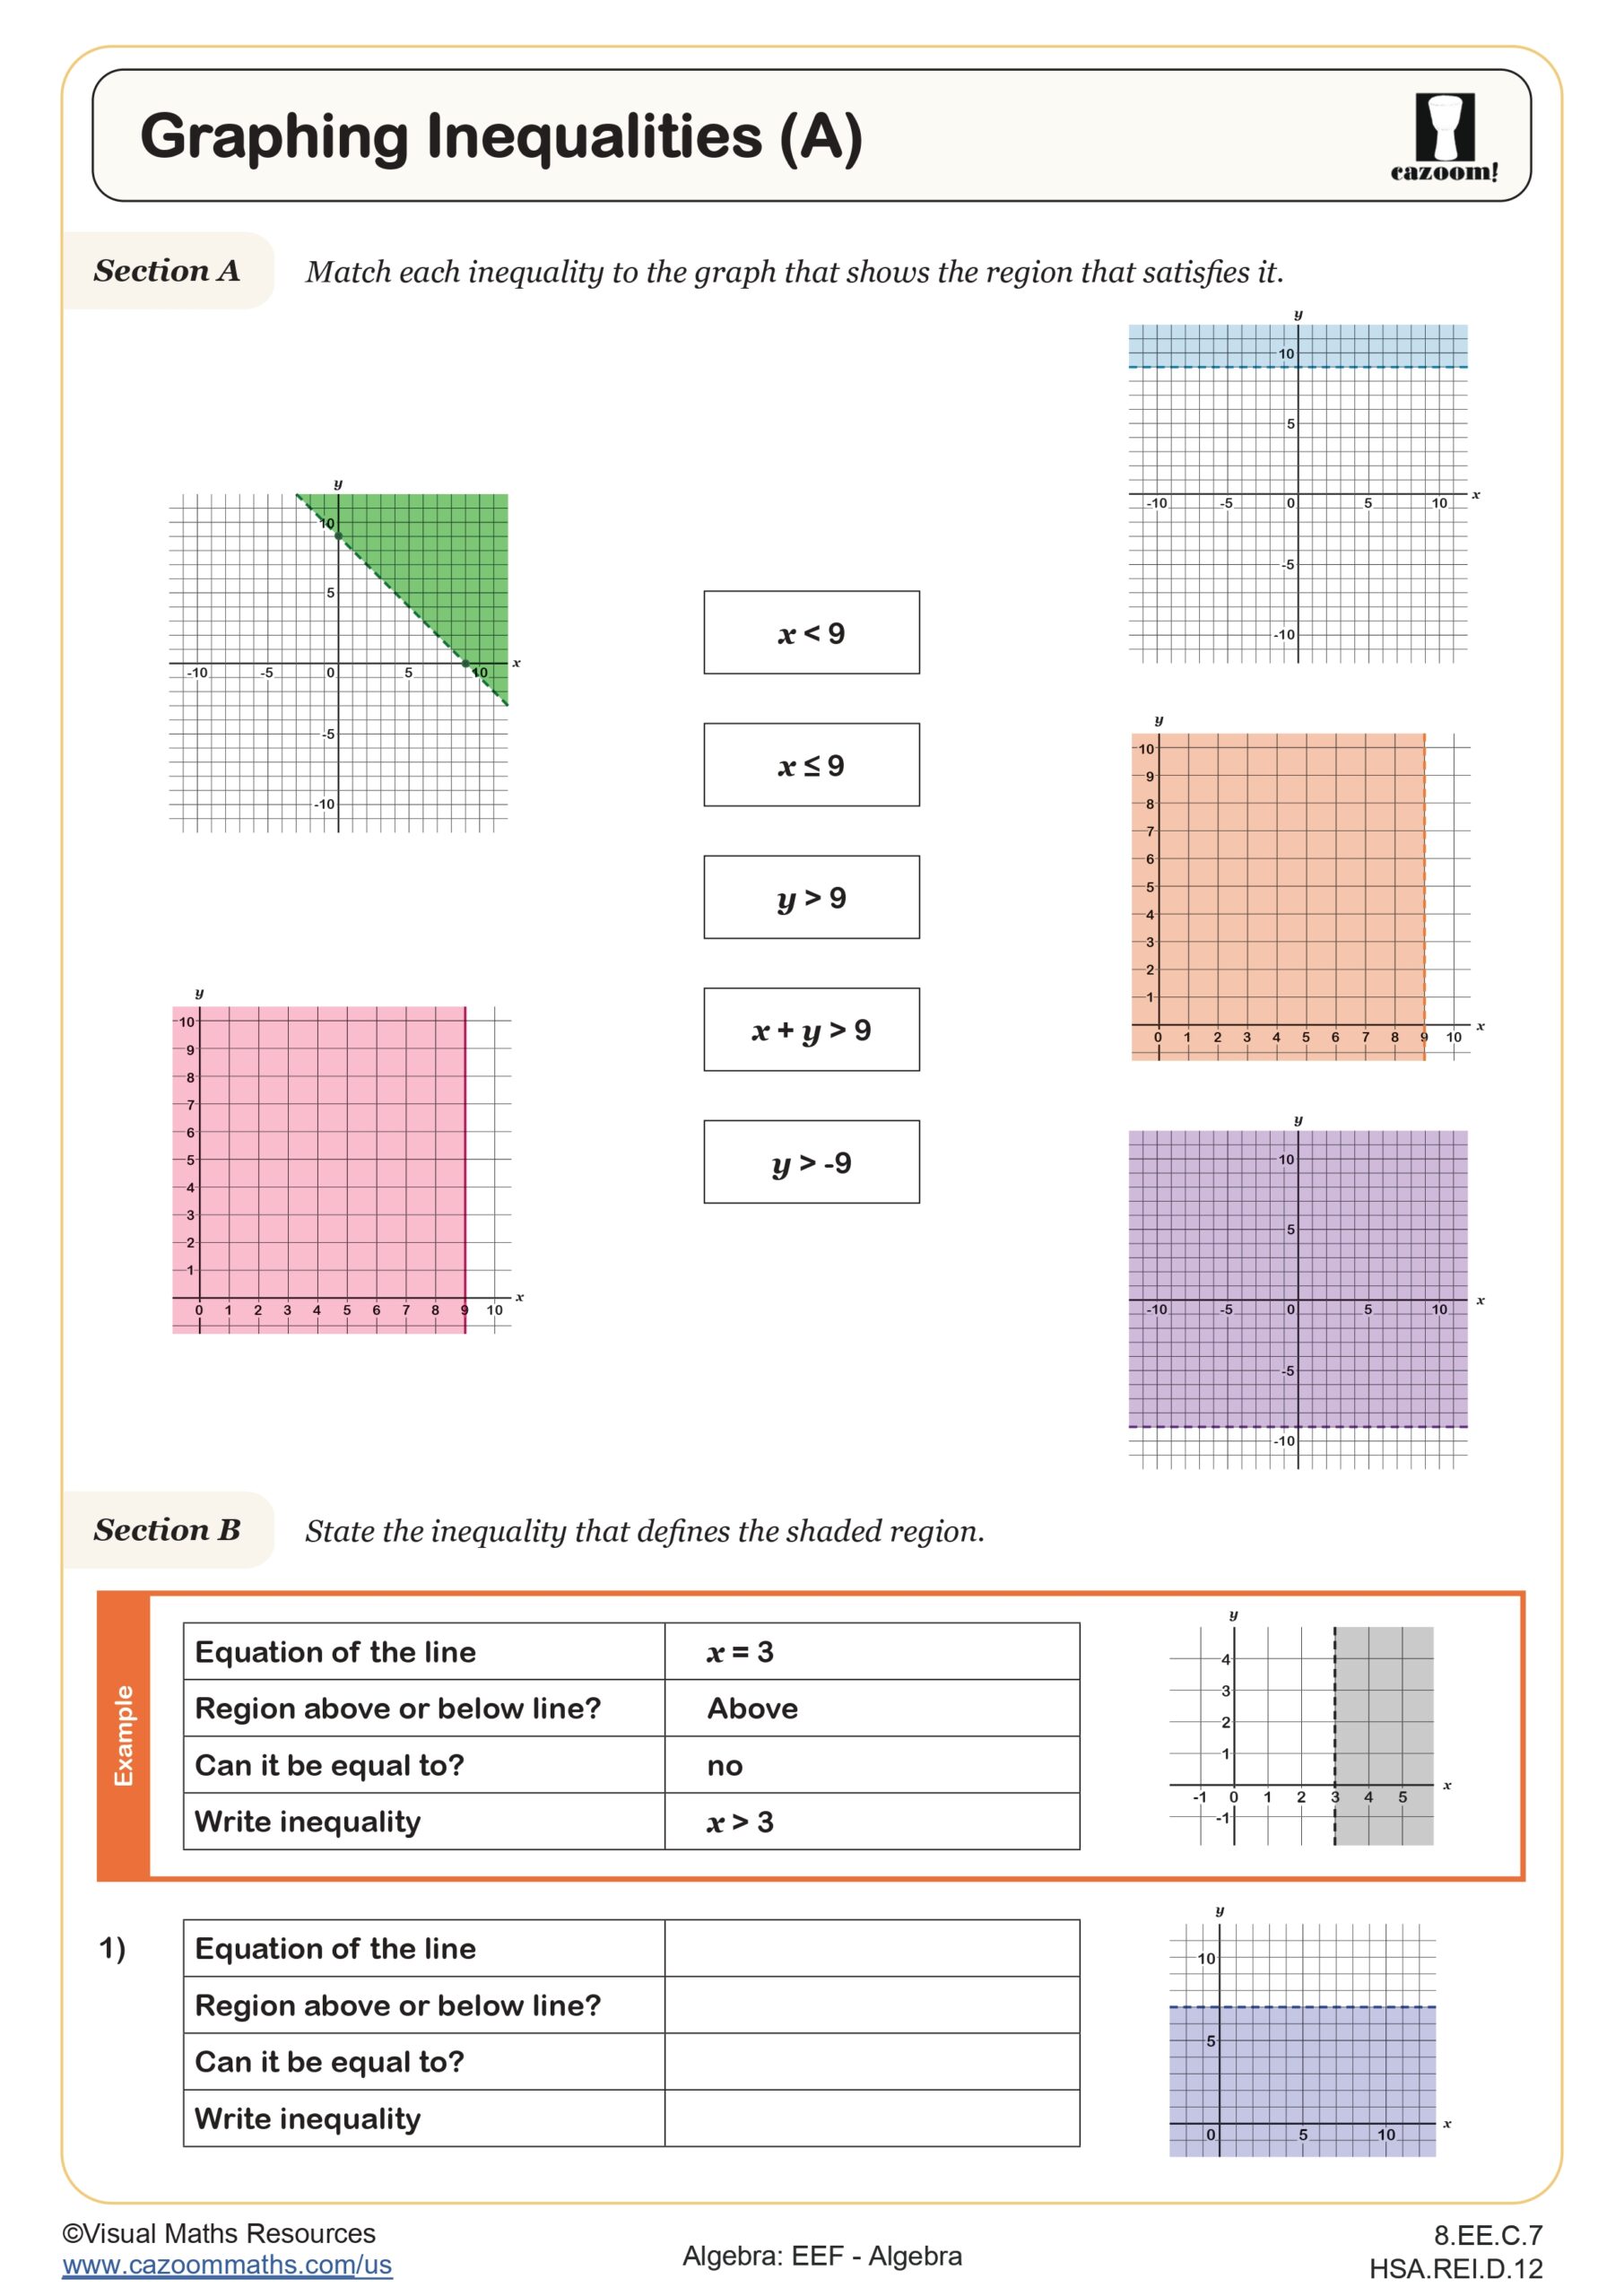
Graphing Inequalities (A)
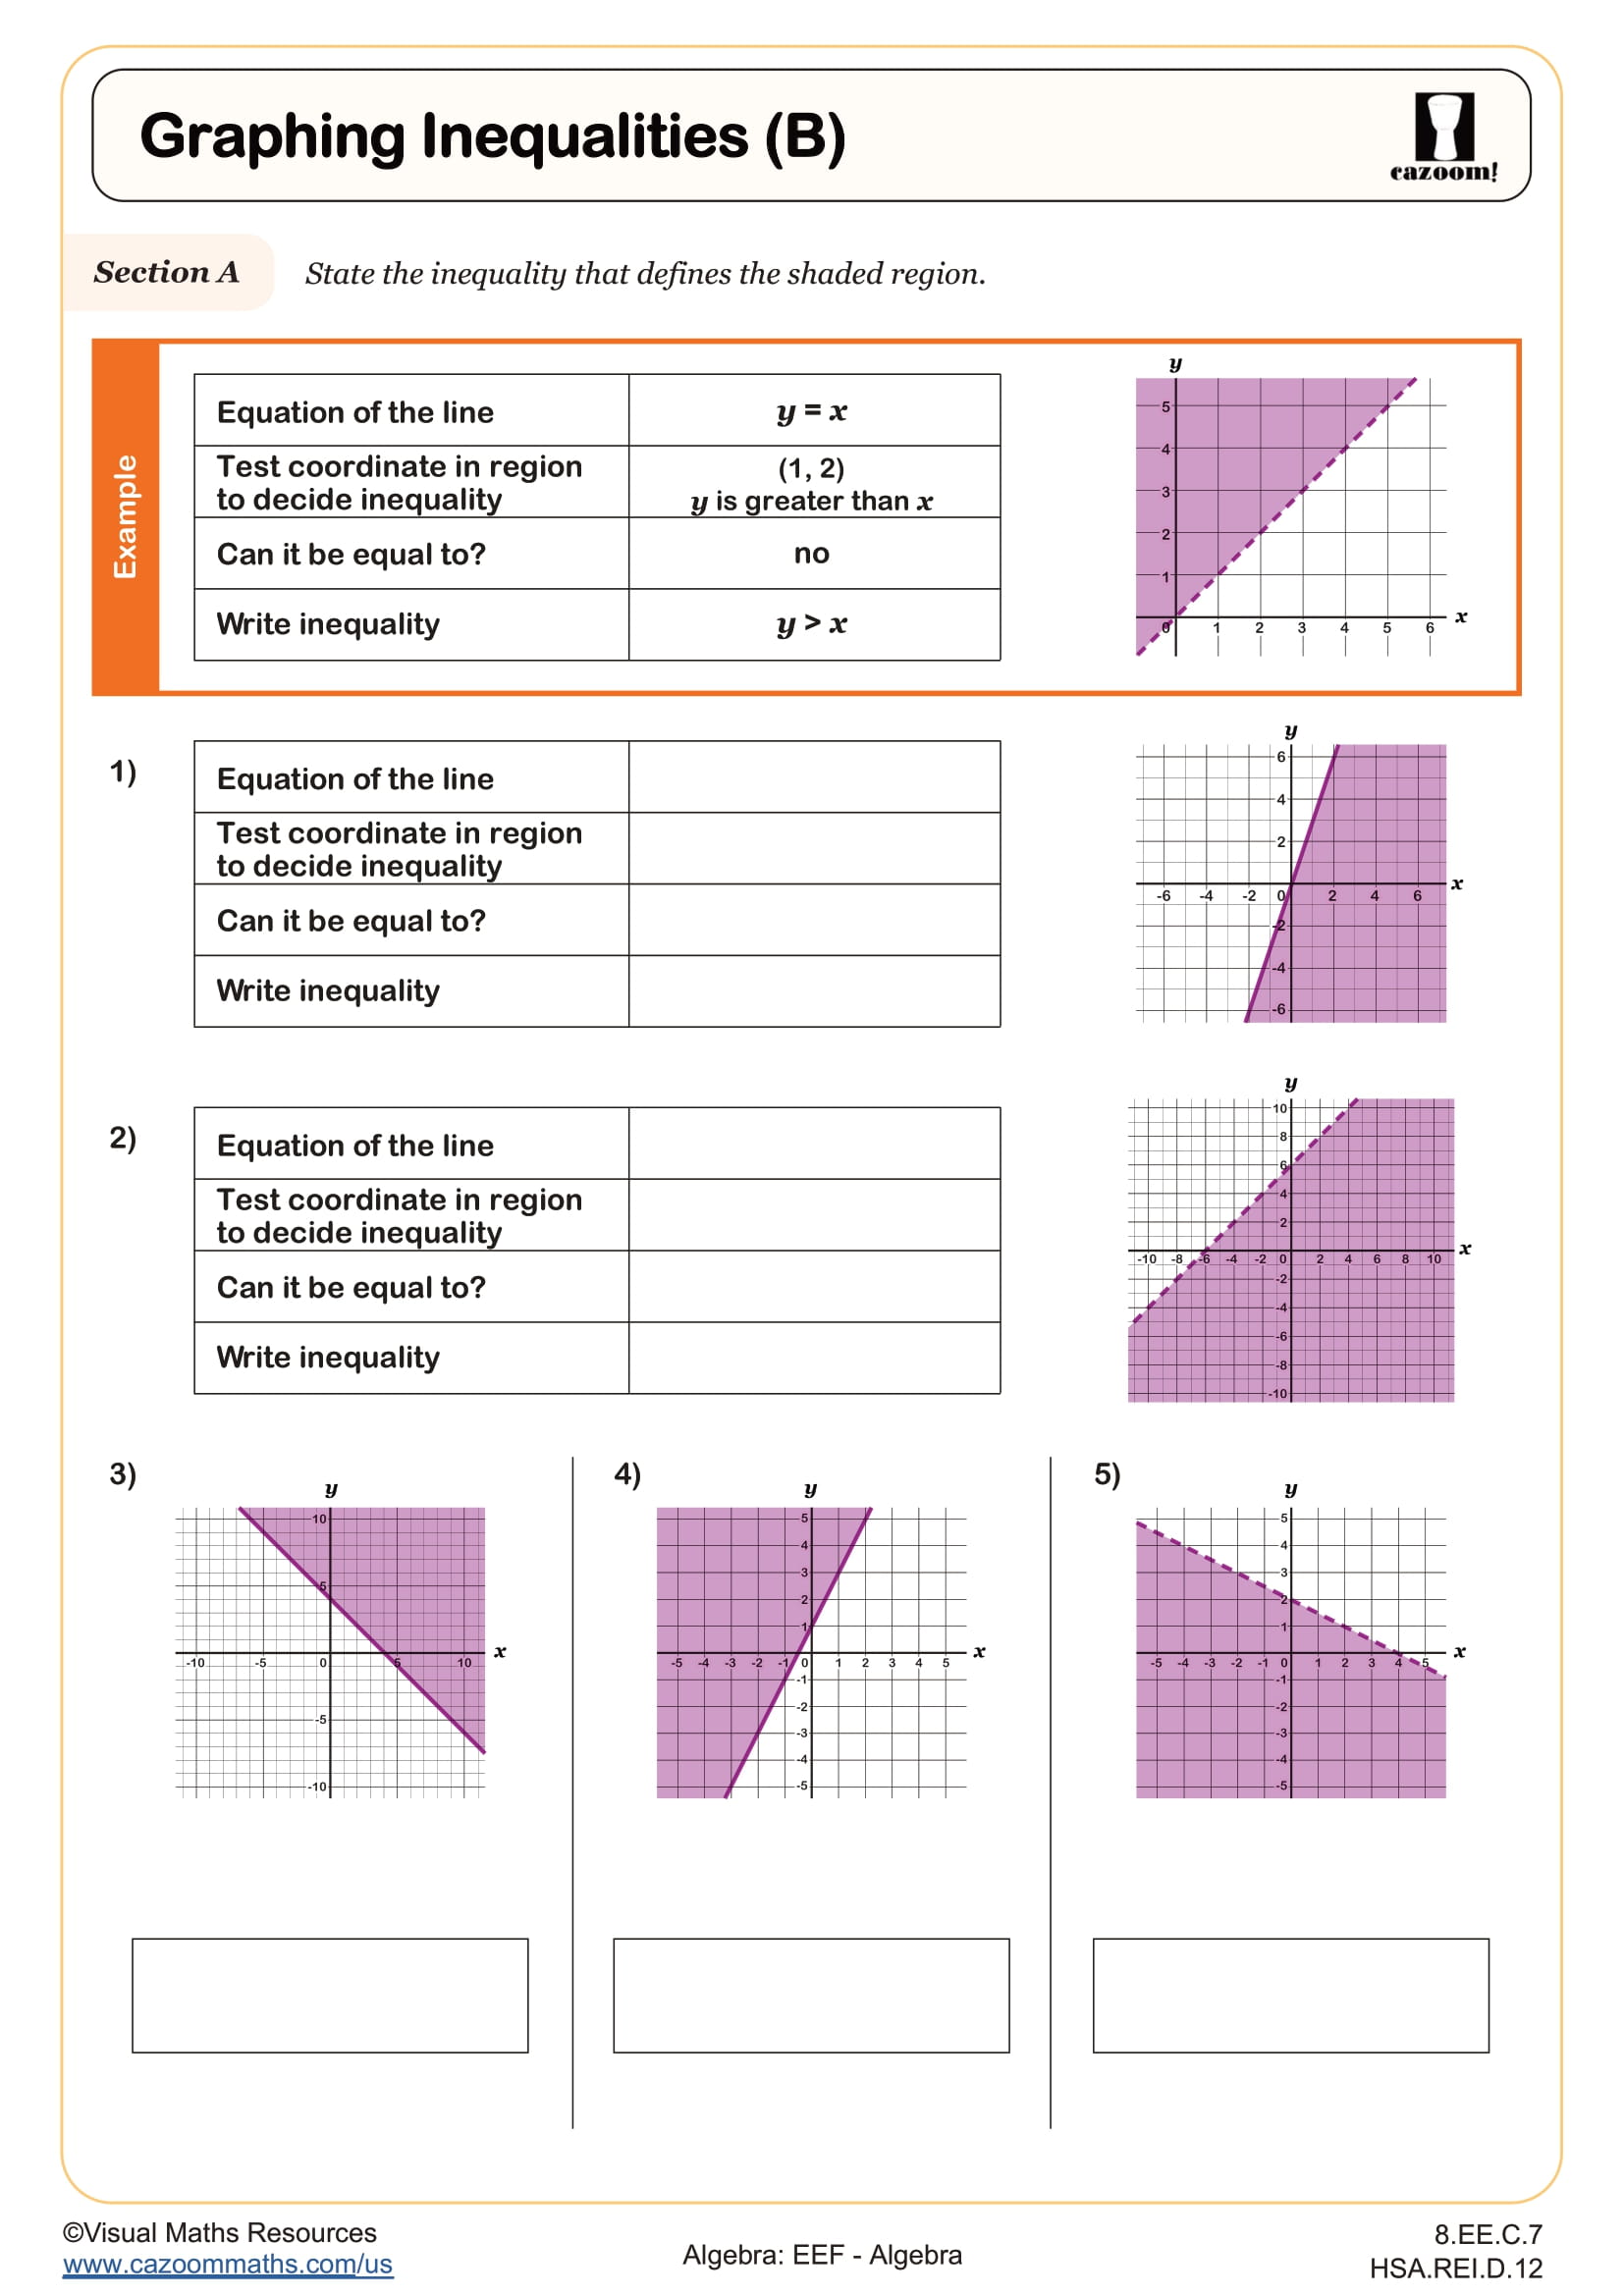
Graphing Inequalities (B)
Graphing Inequalities (C)
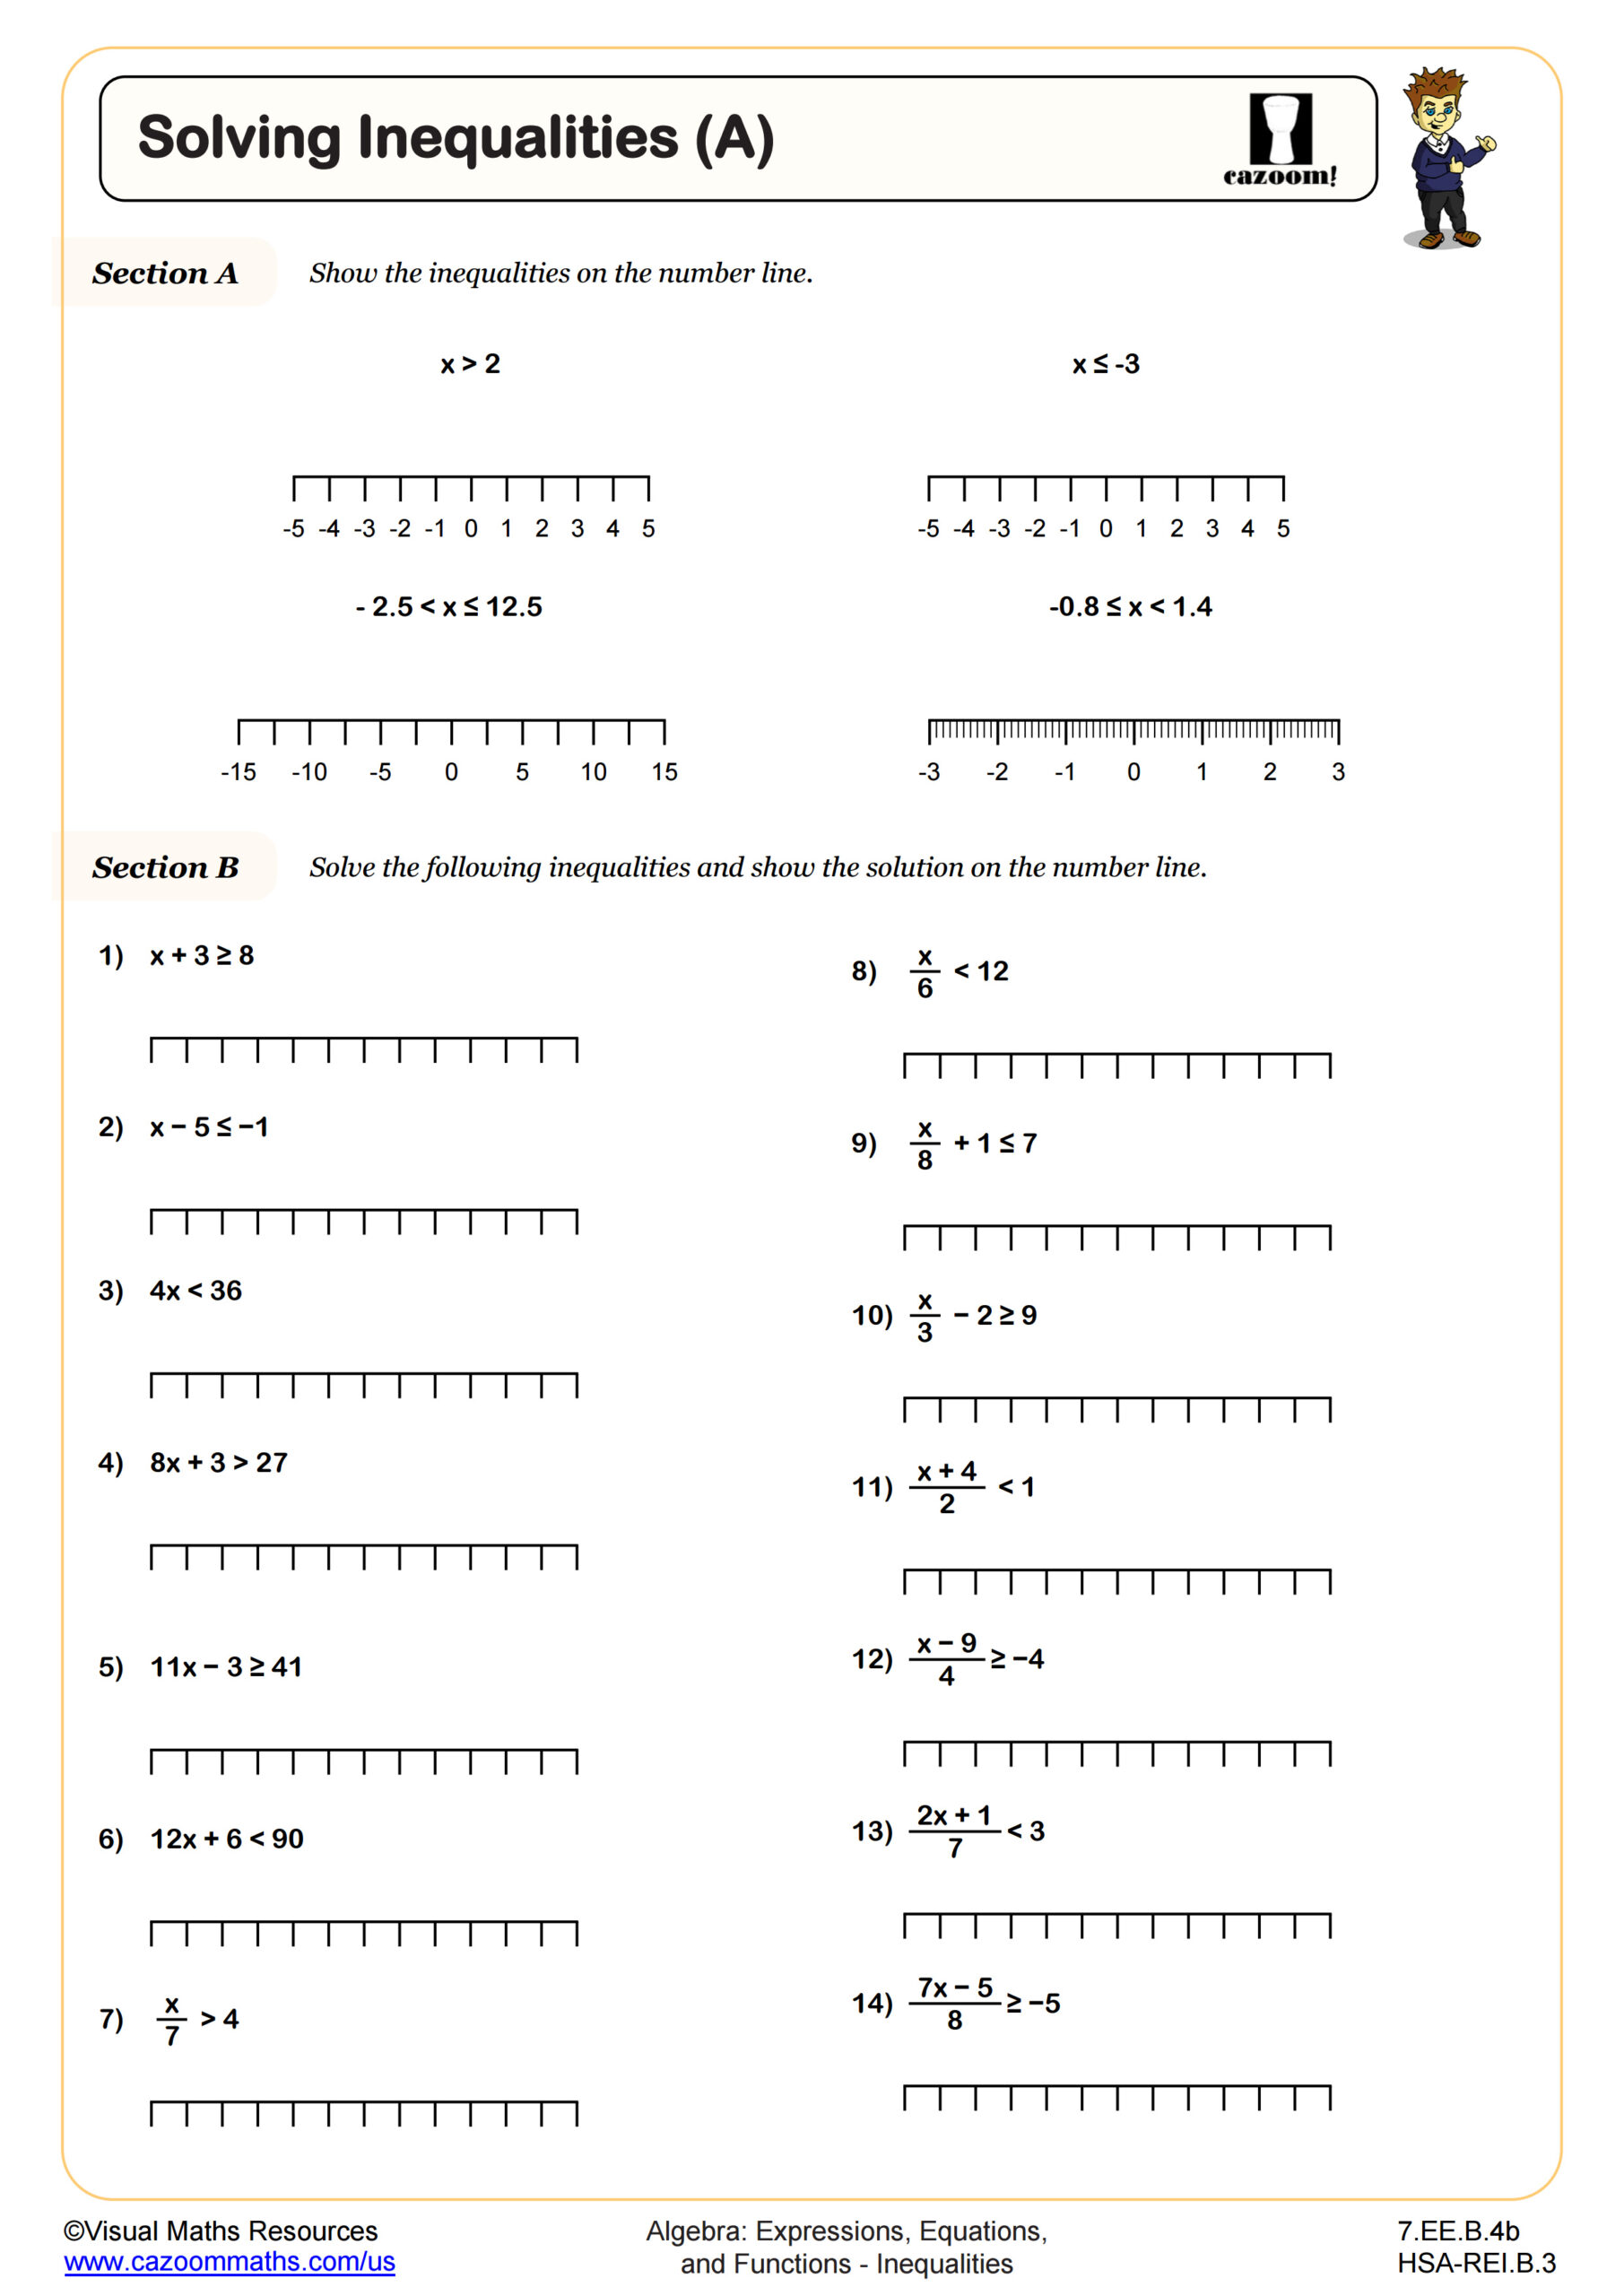
Solving Inequalities (A)
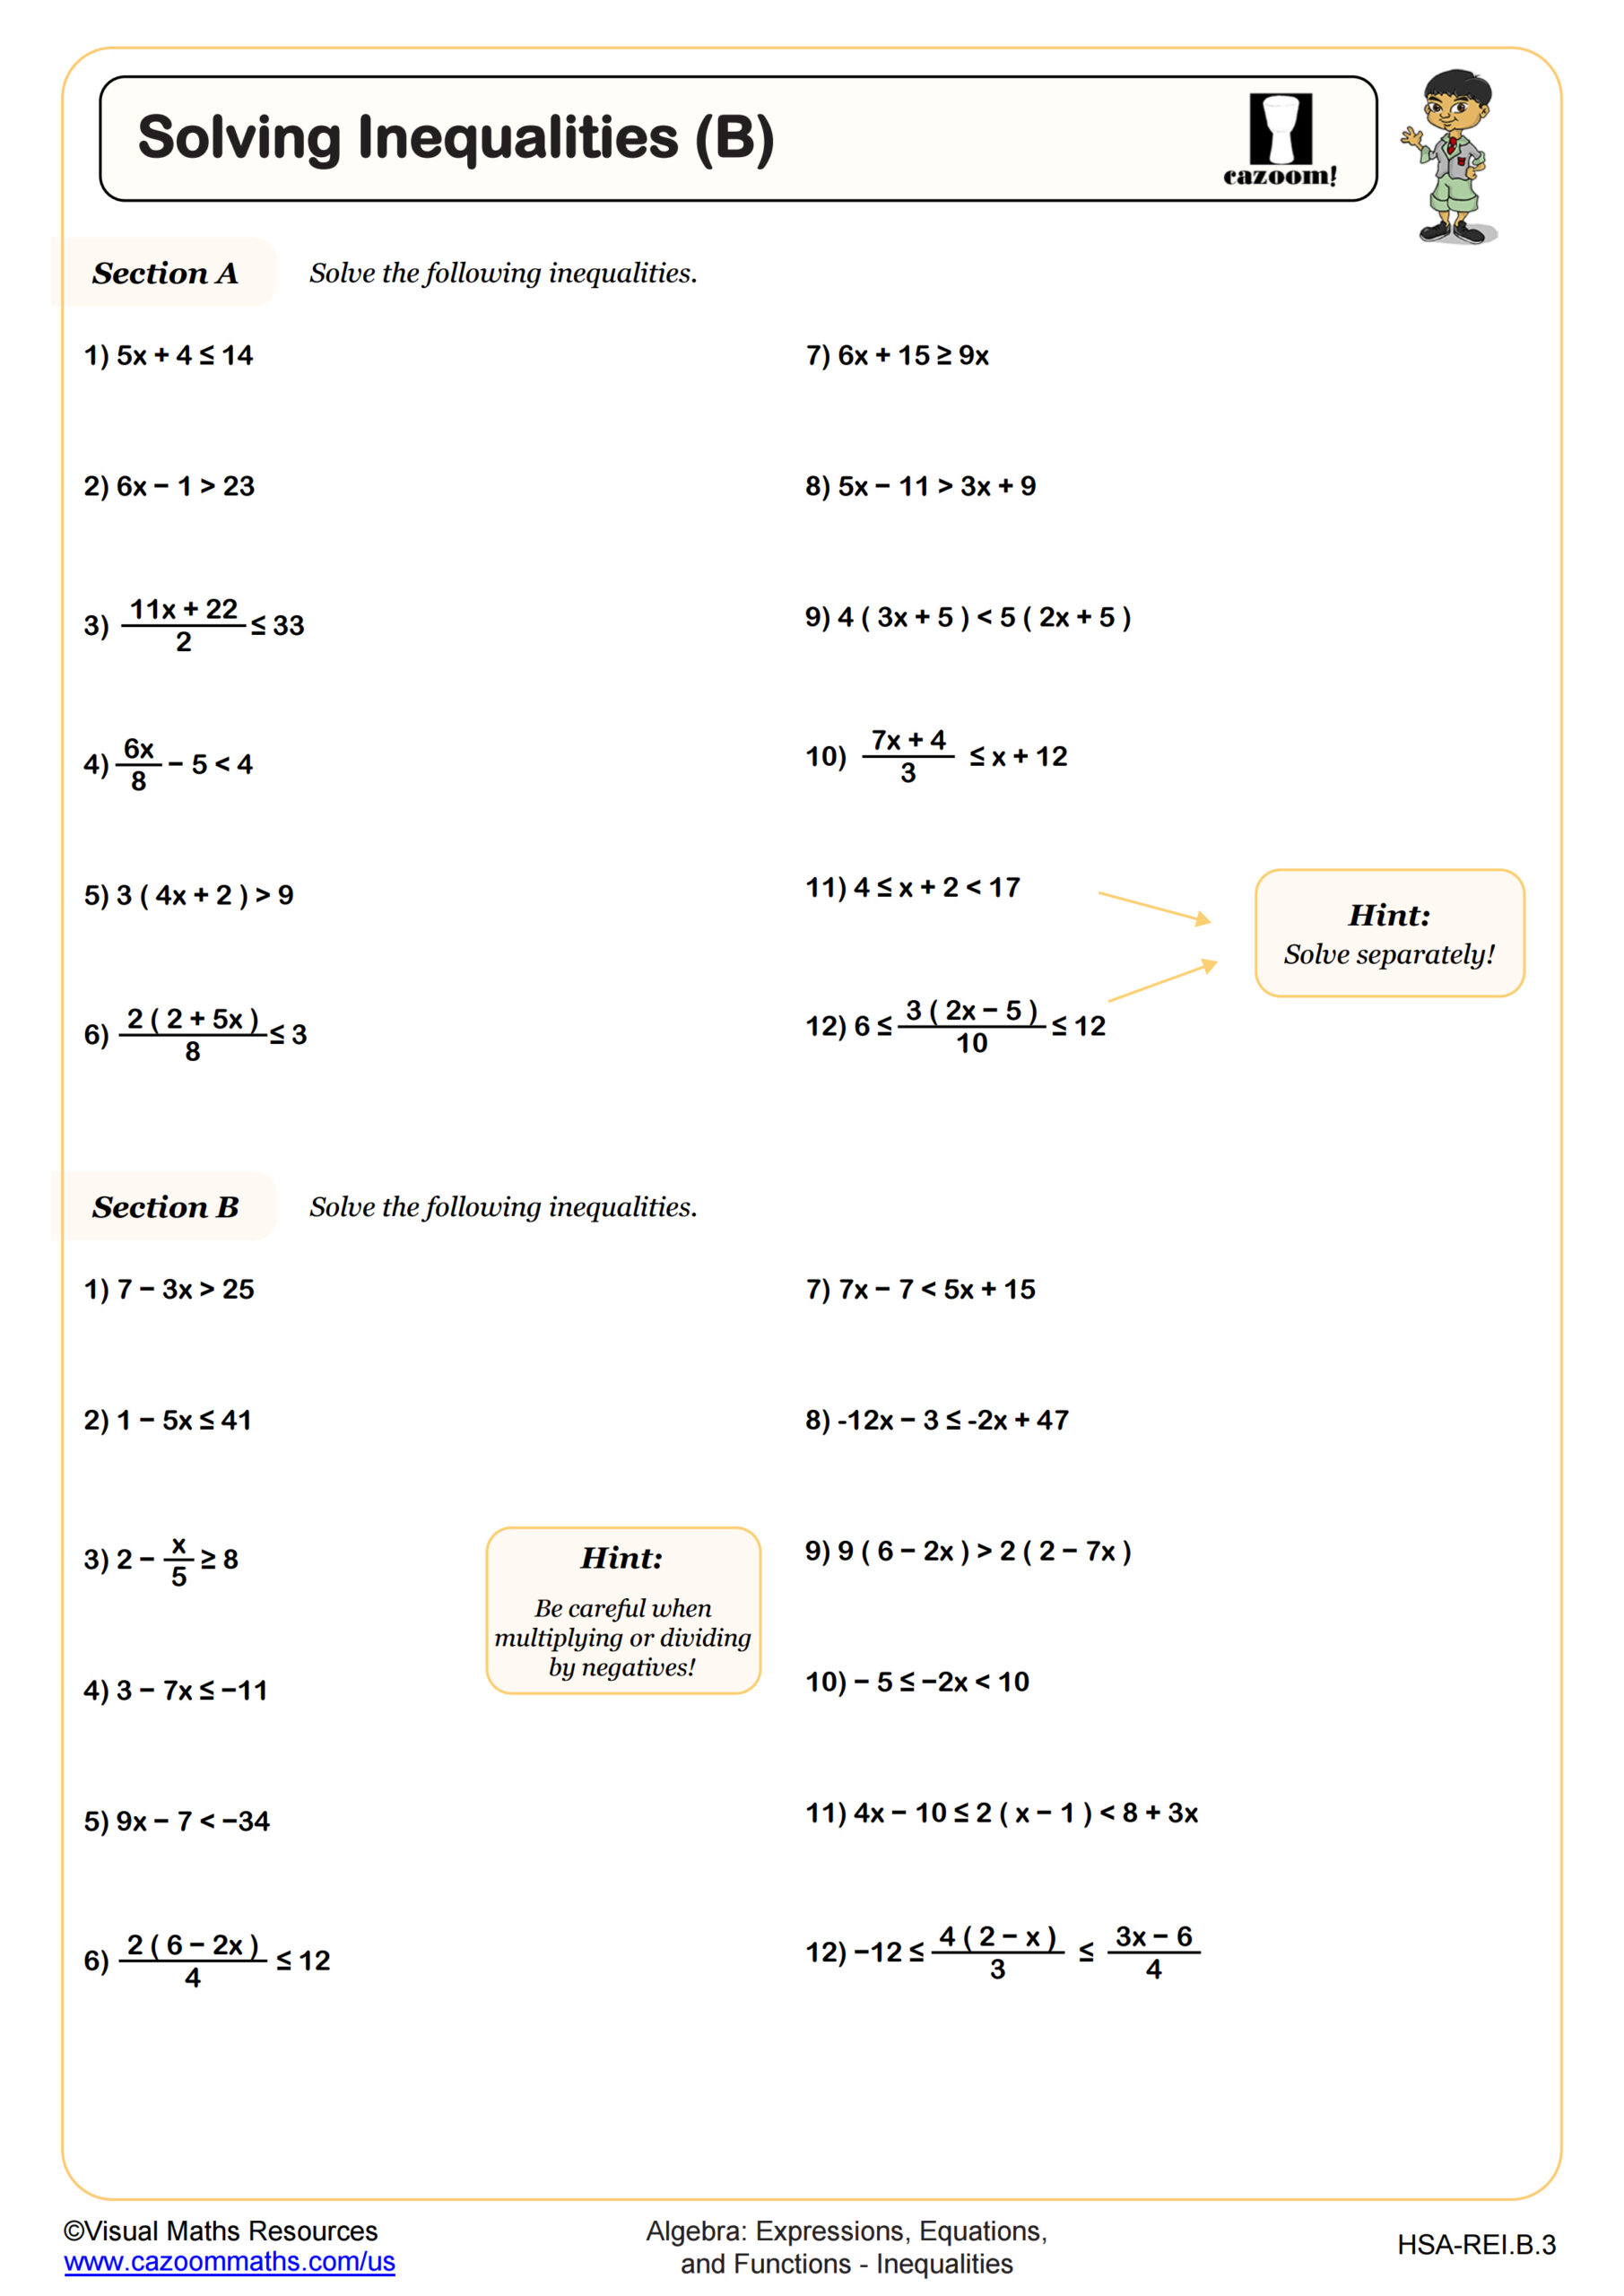
Solving Inequalities (B)
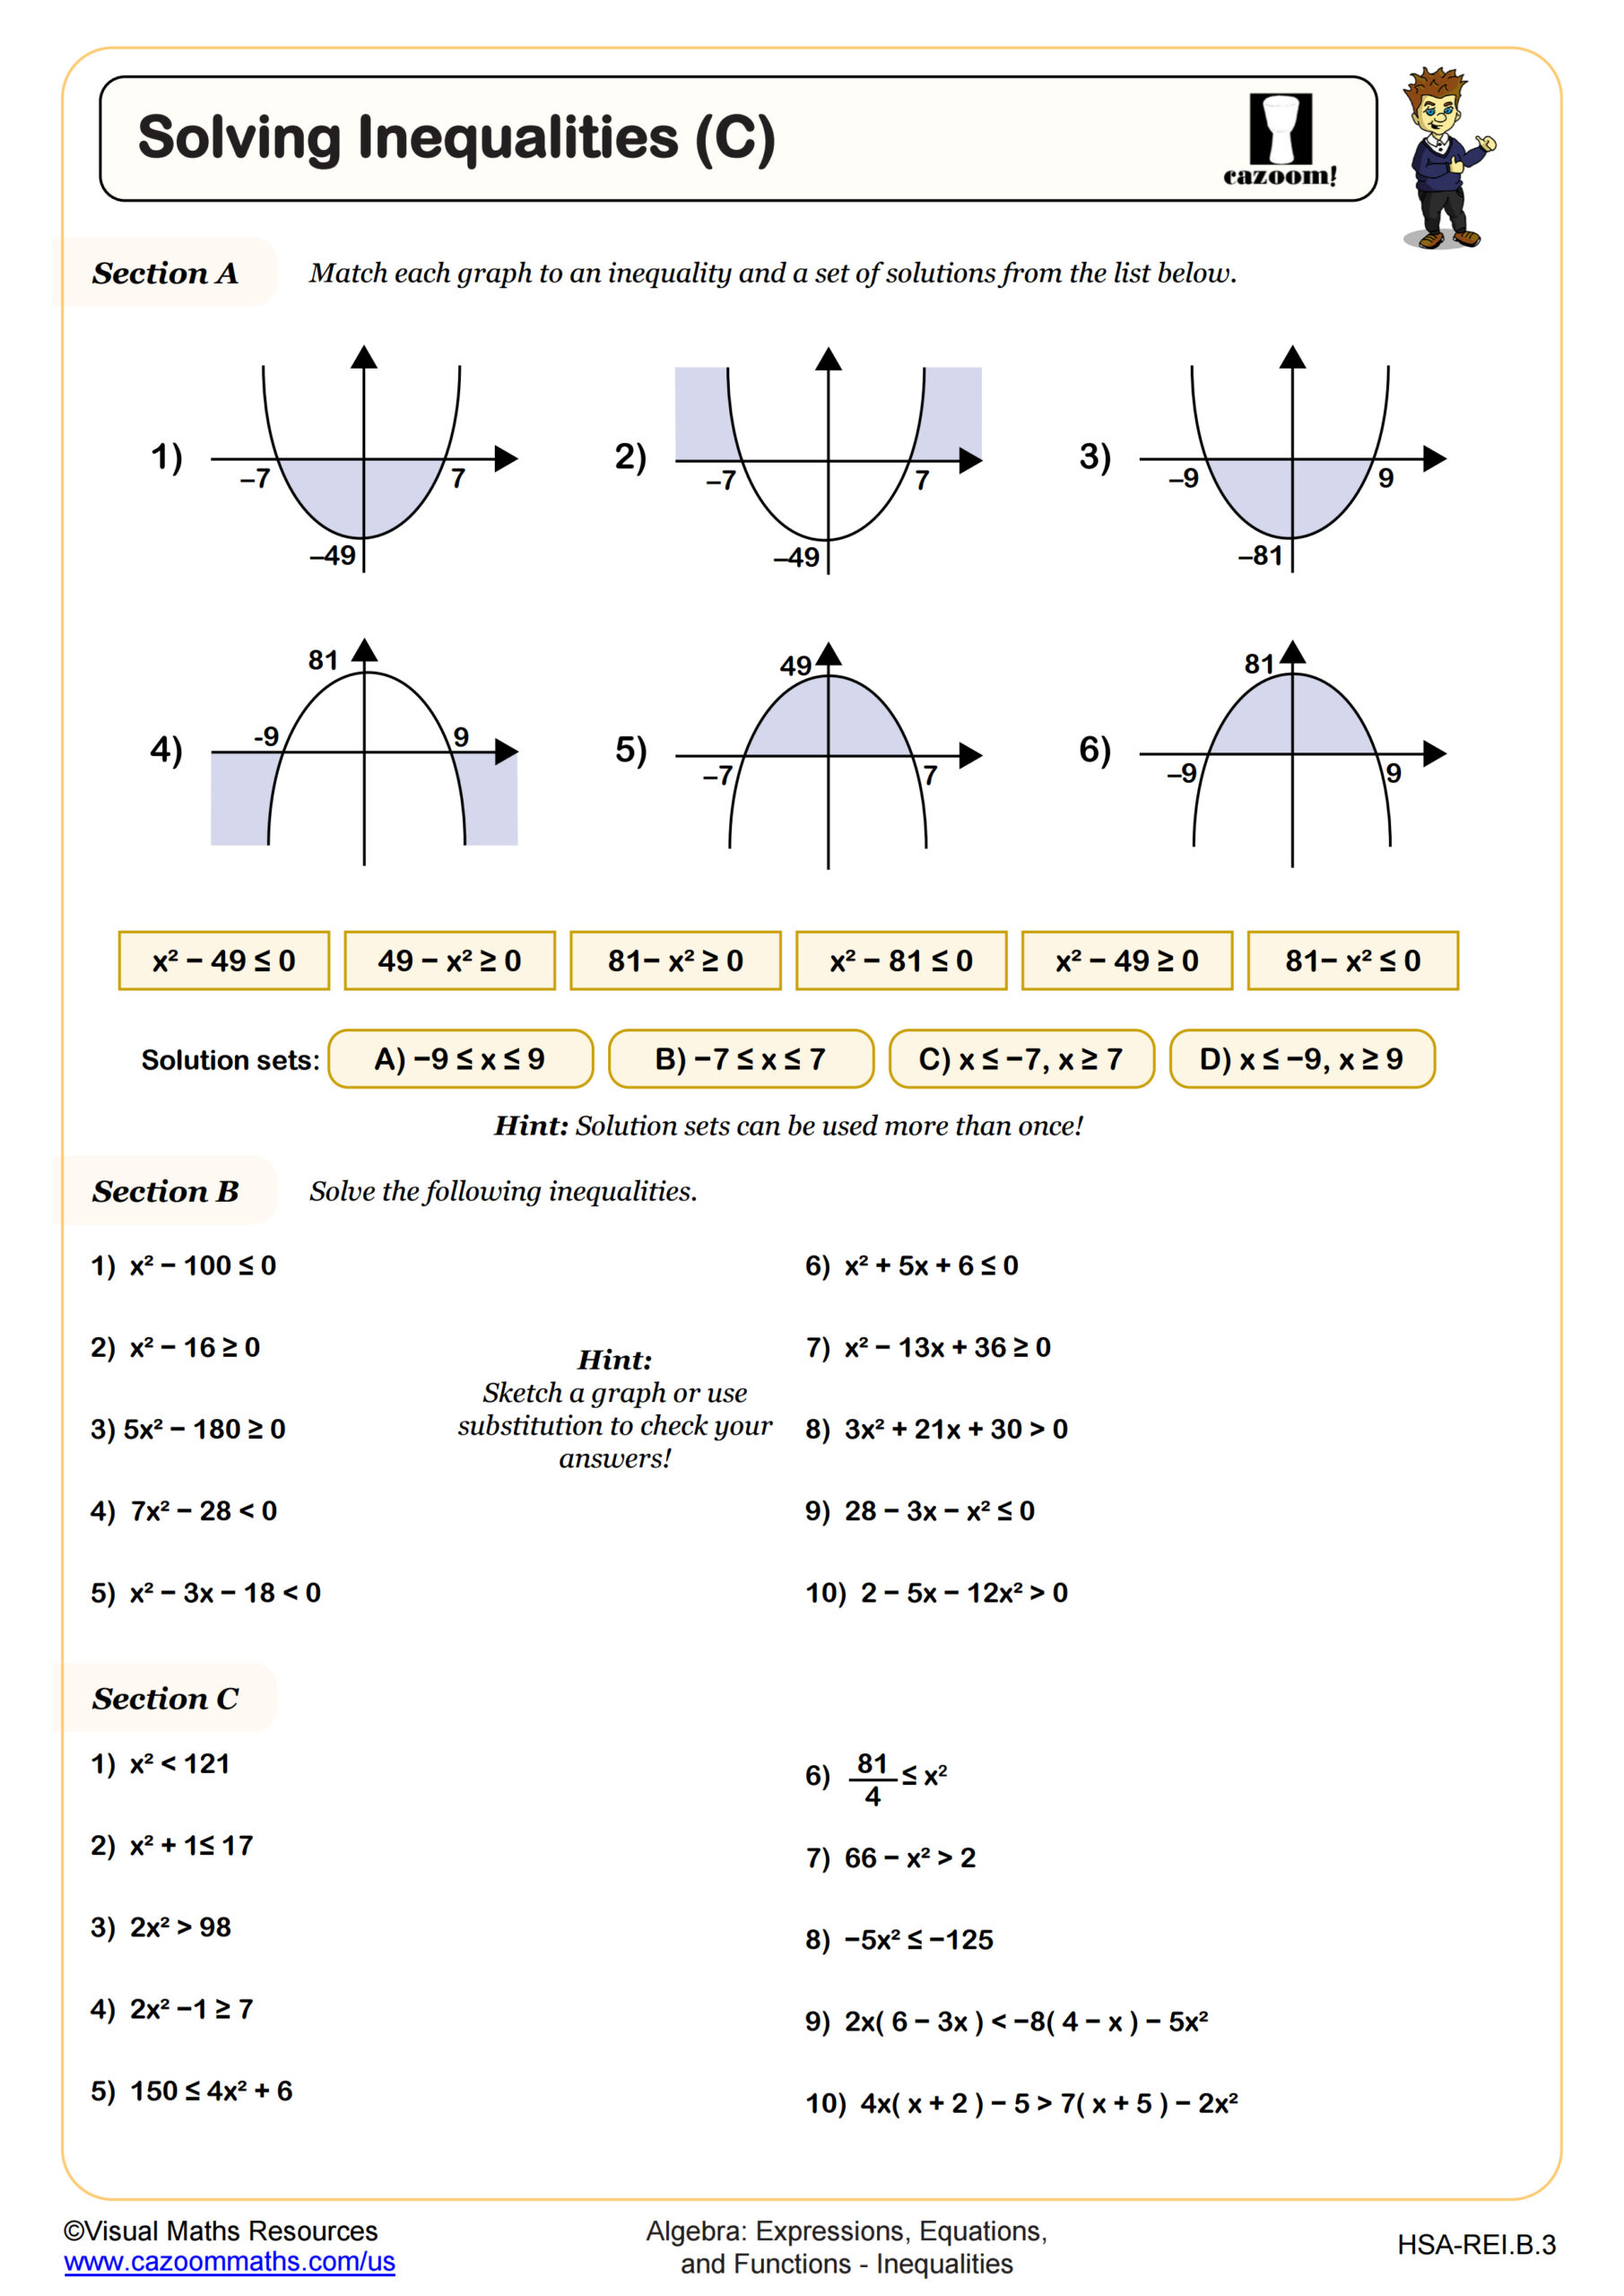
Solving Inequalities (C)
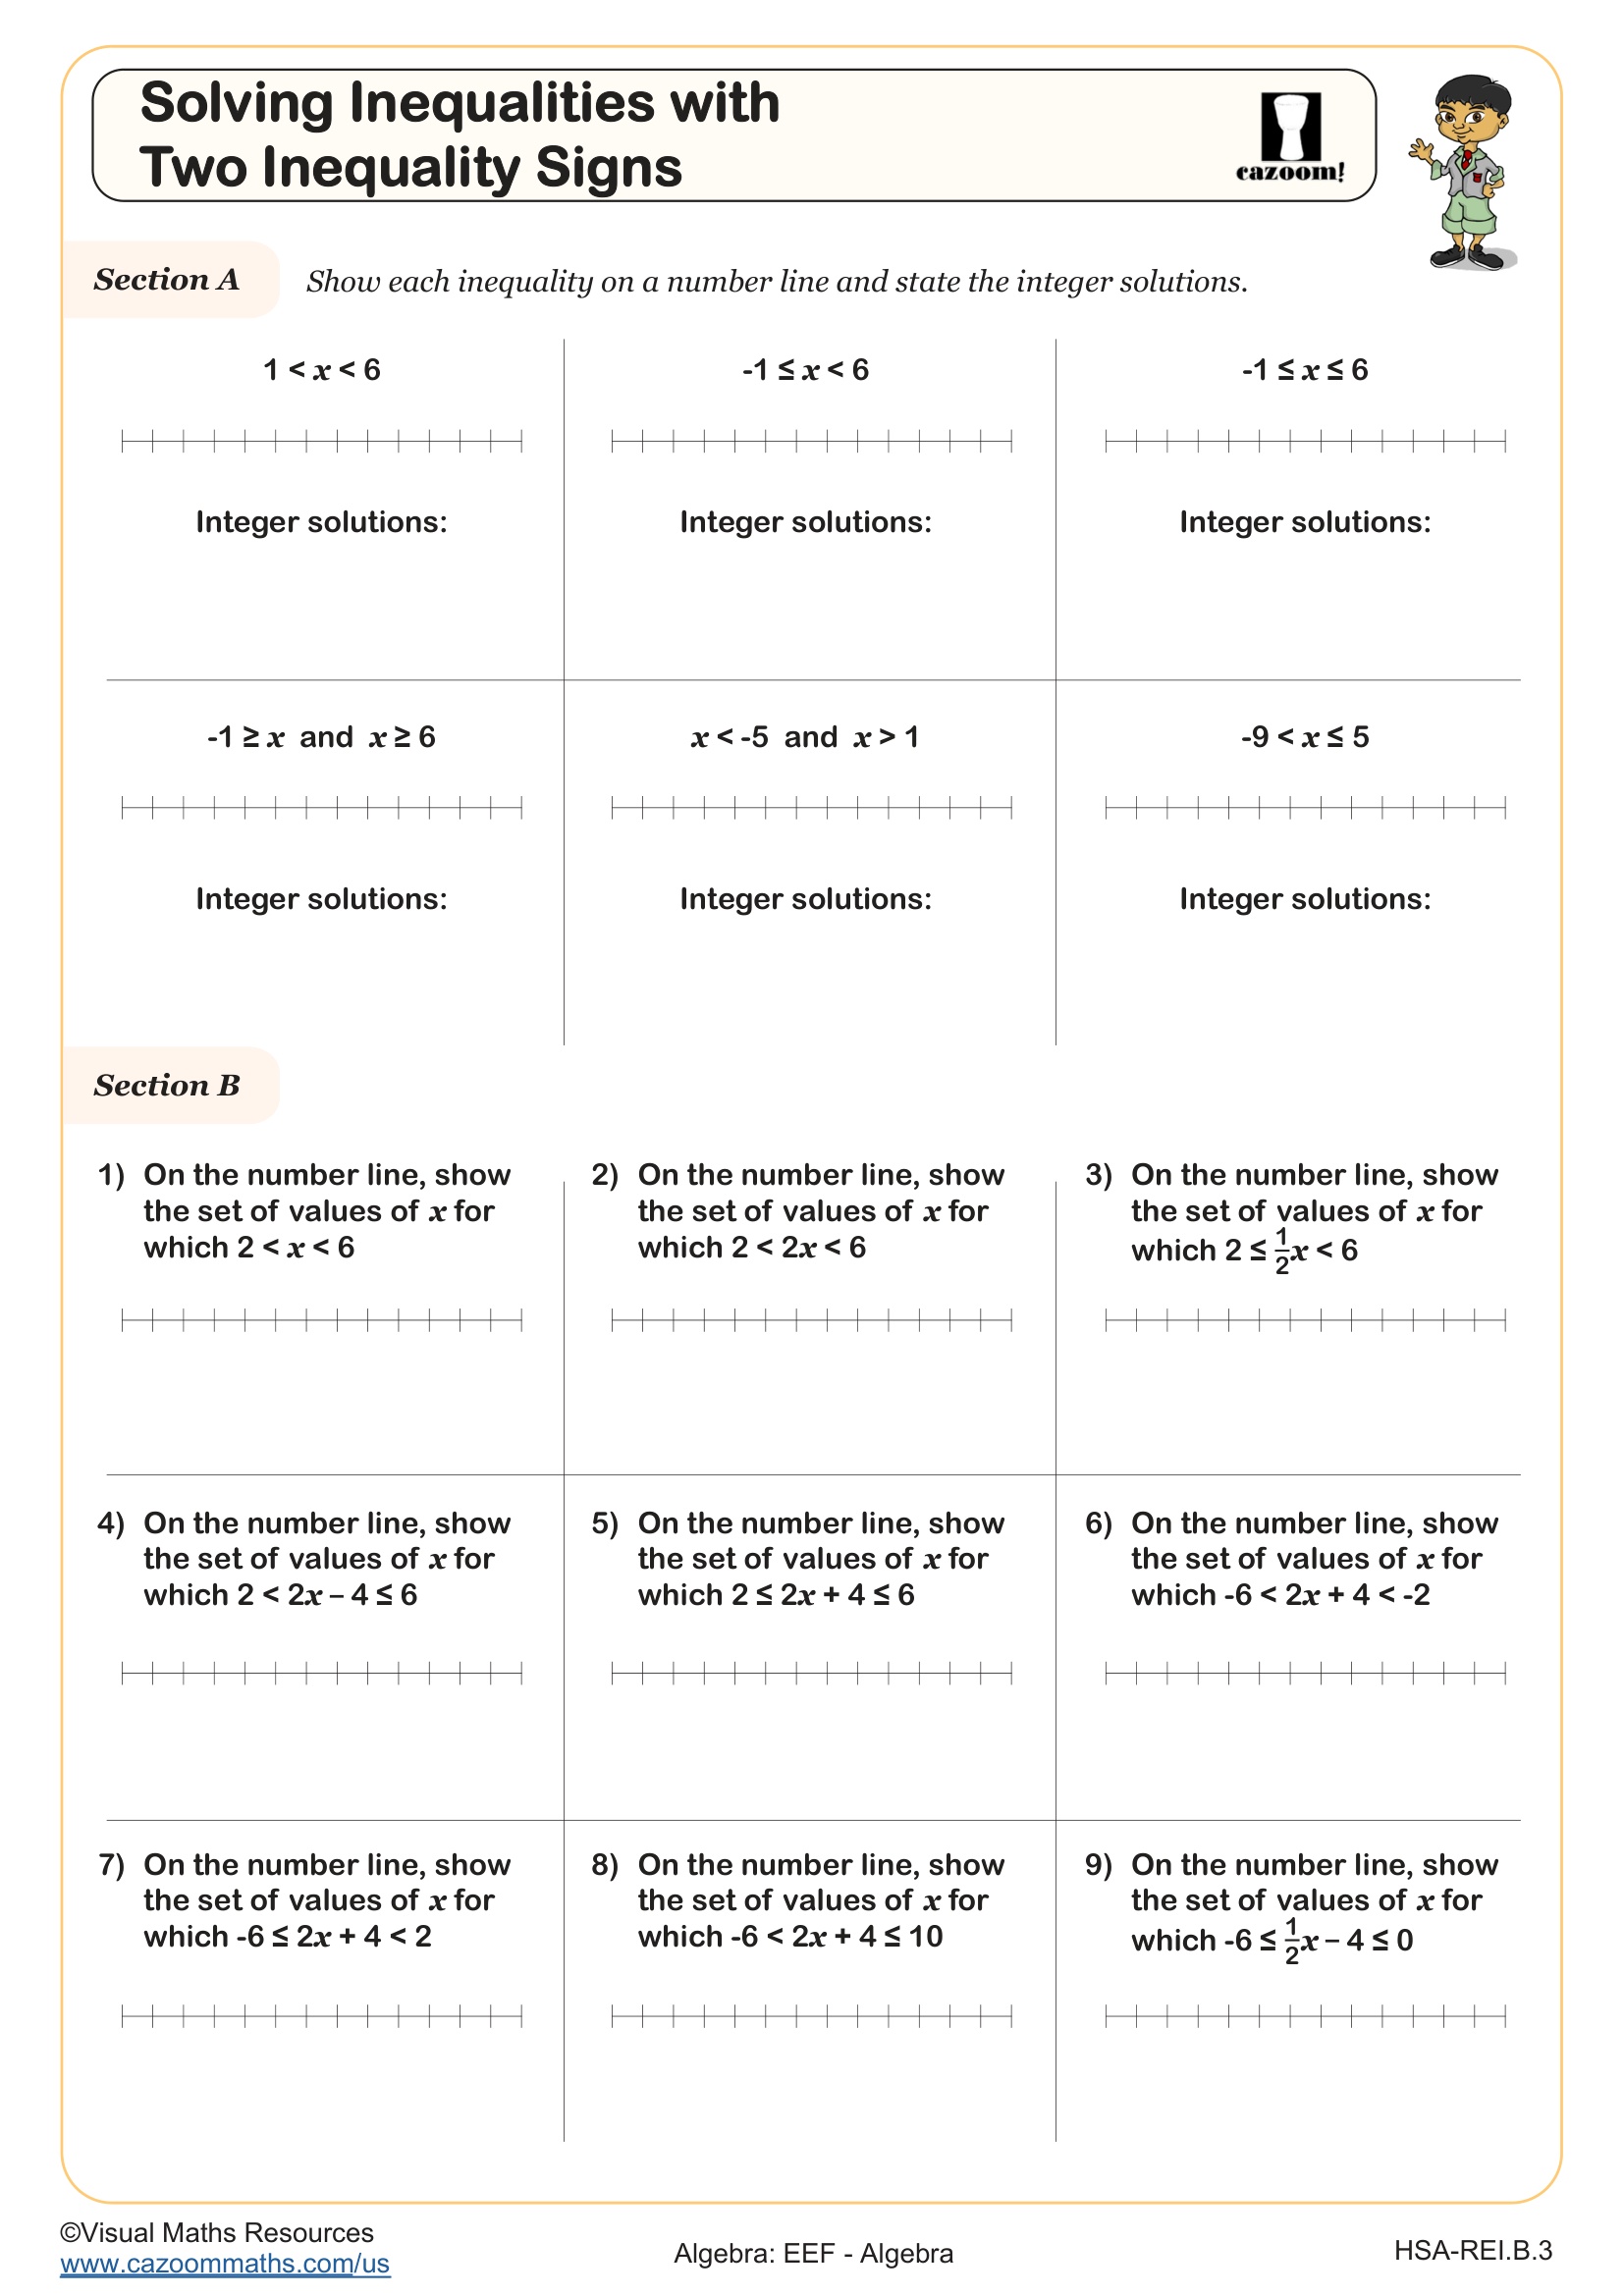
Solving Inequalities with Two Inequalitity Signs
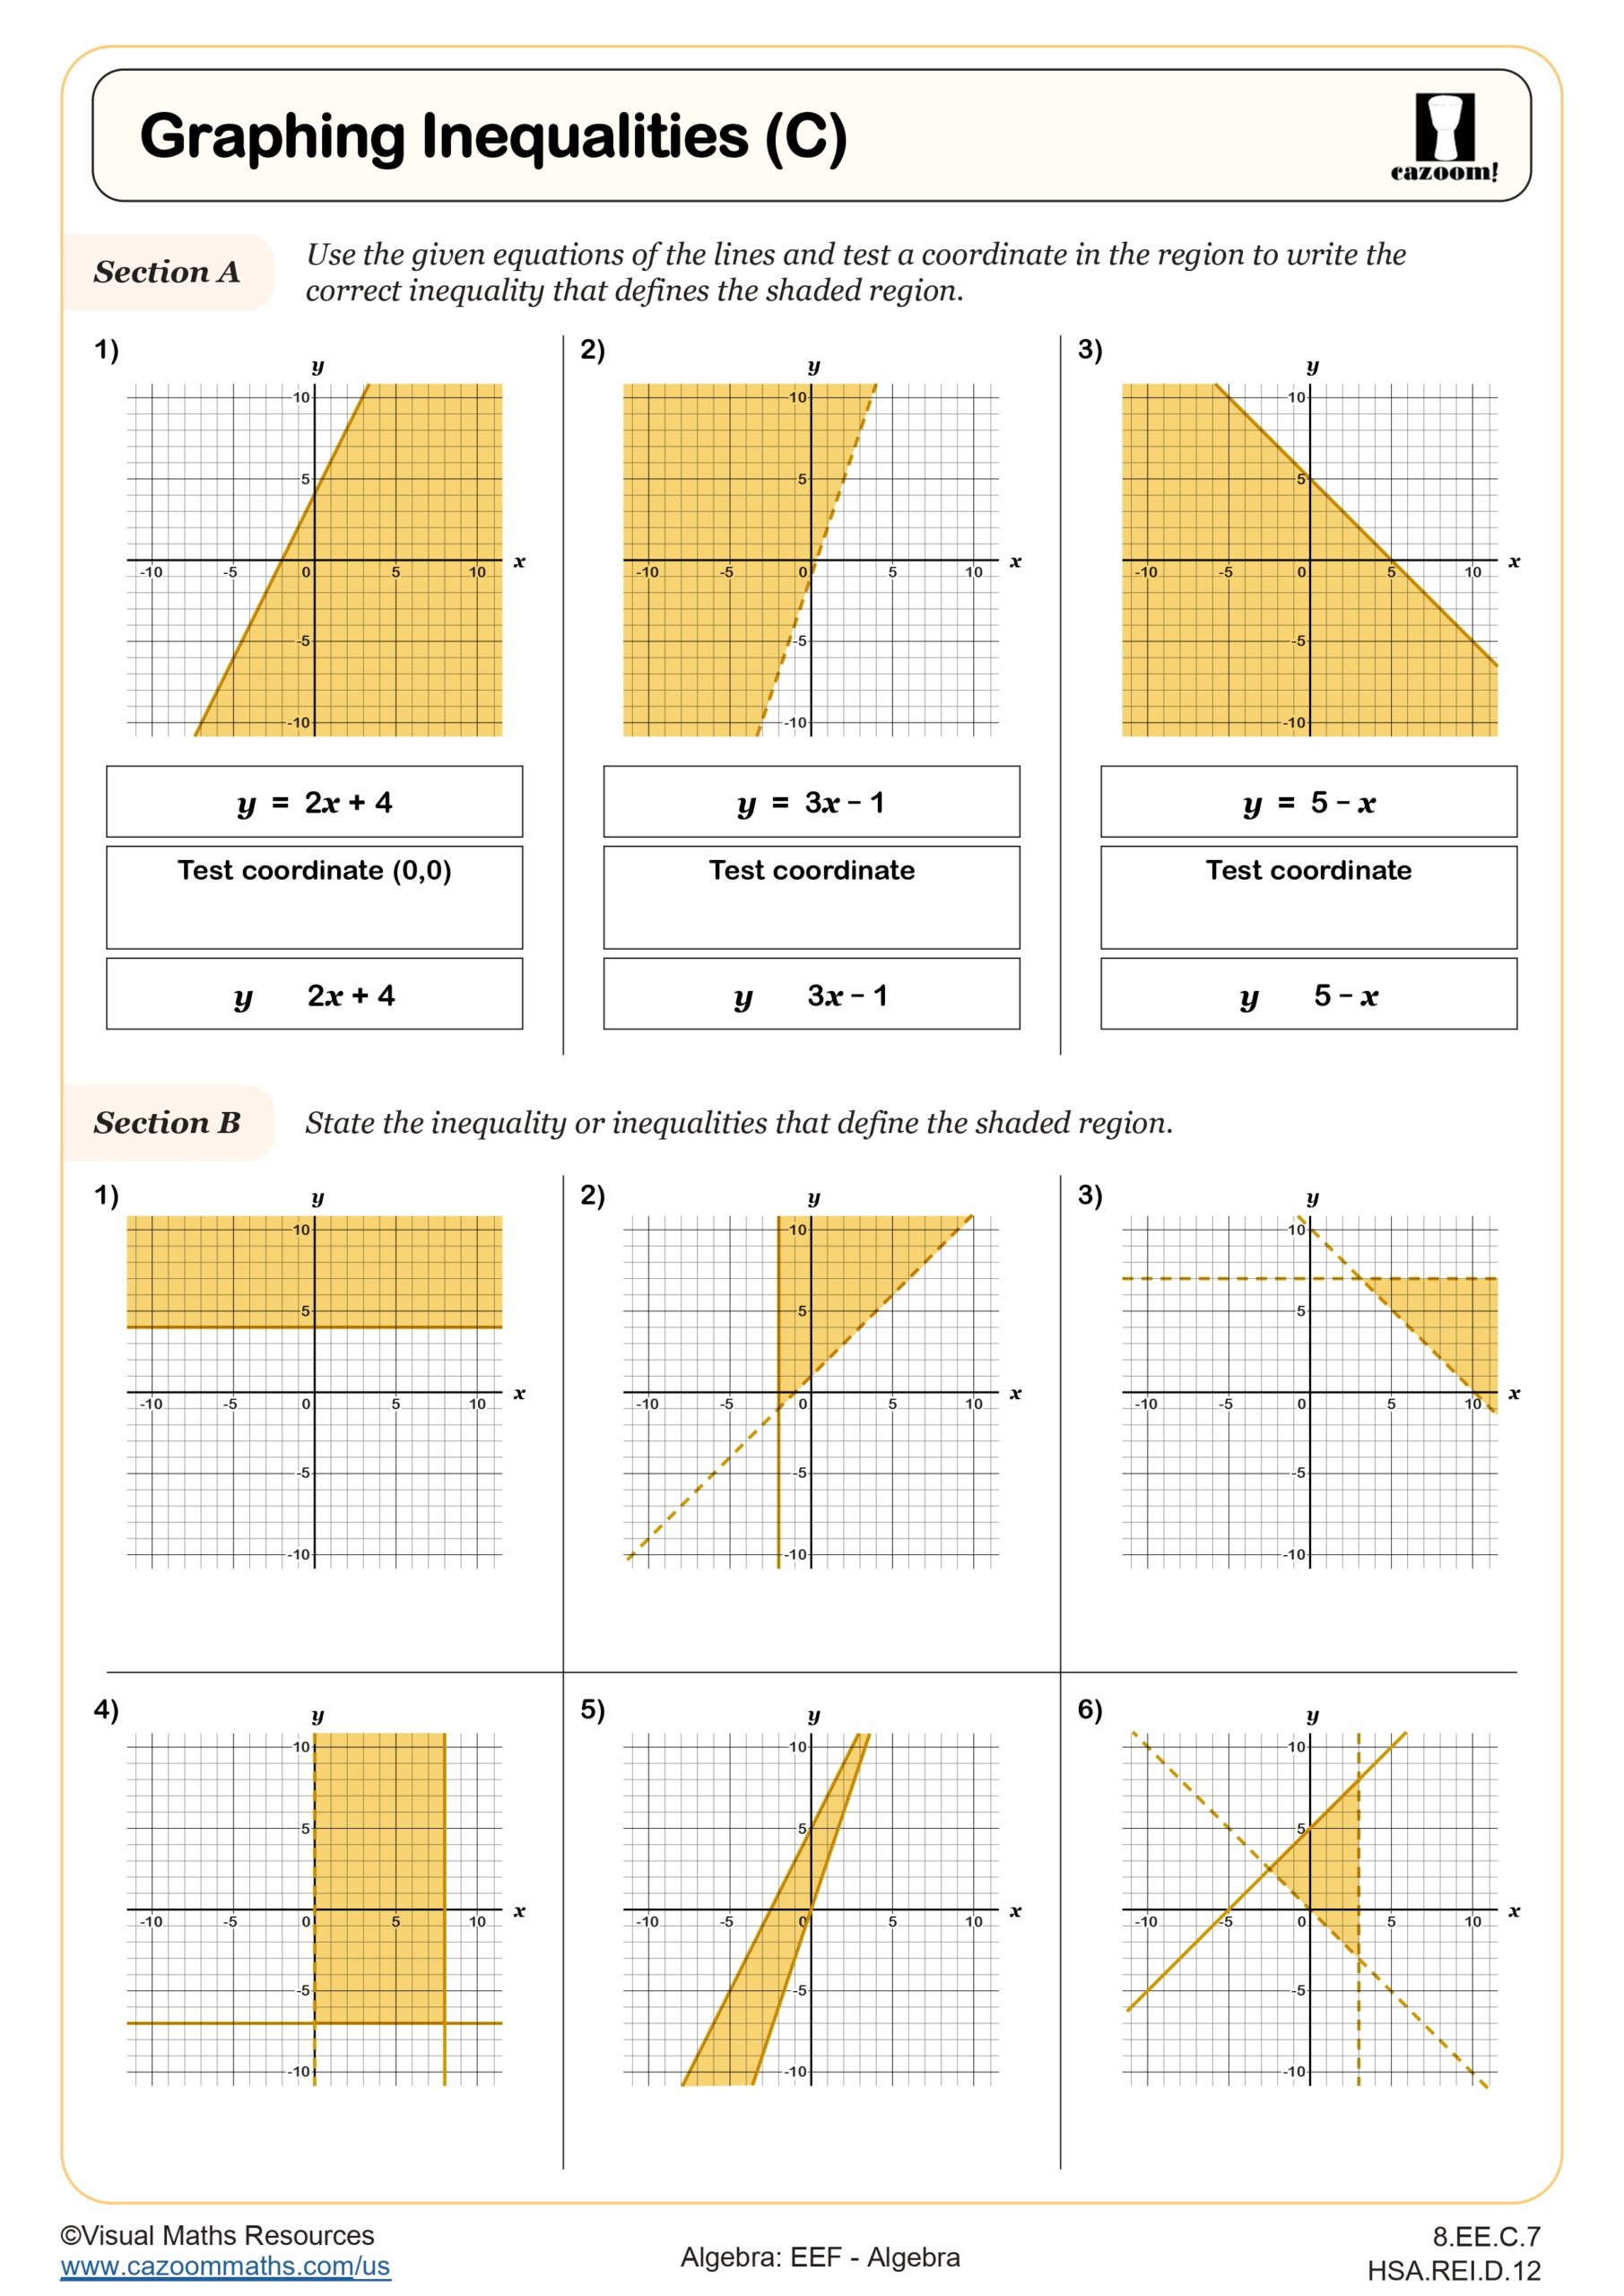
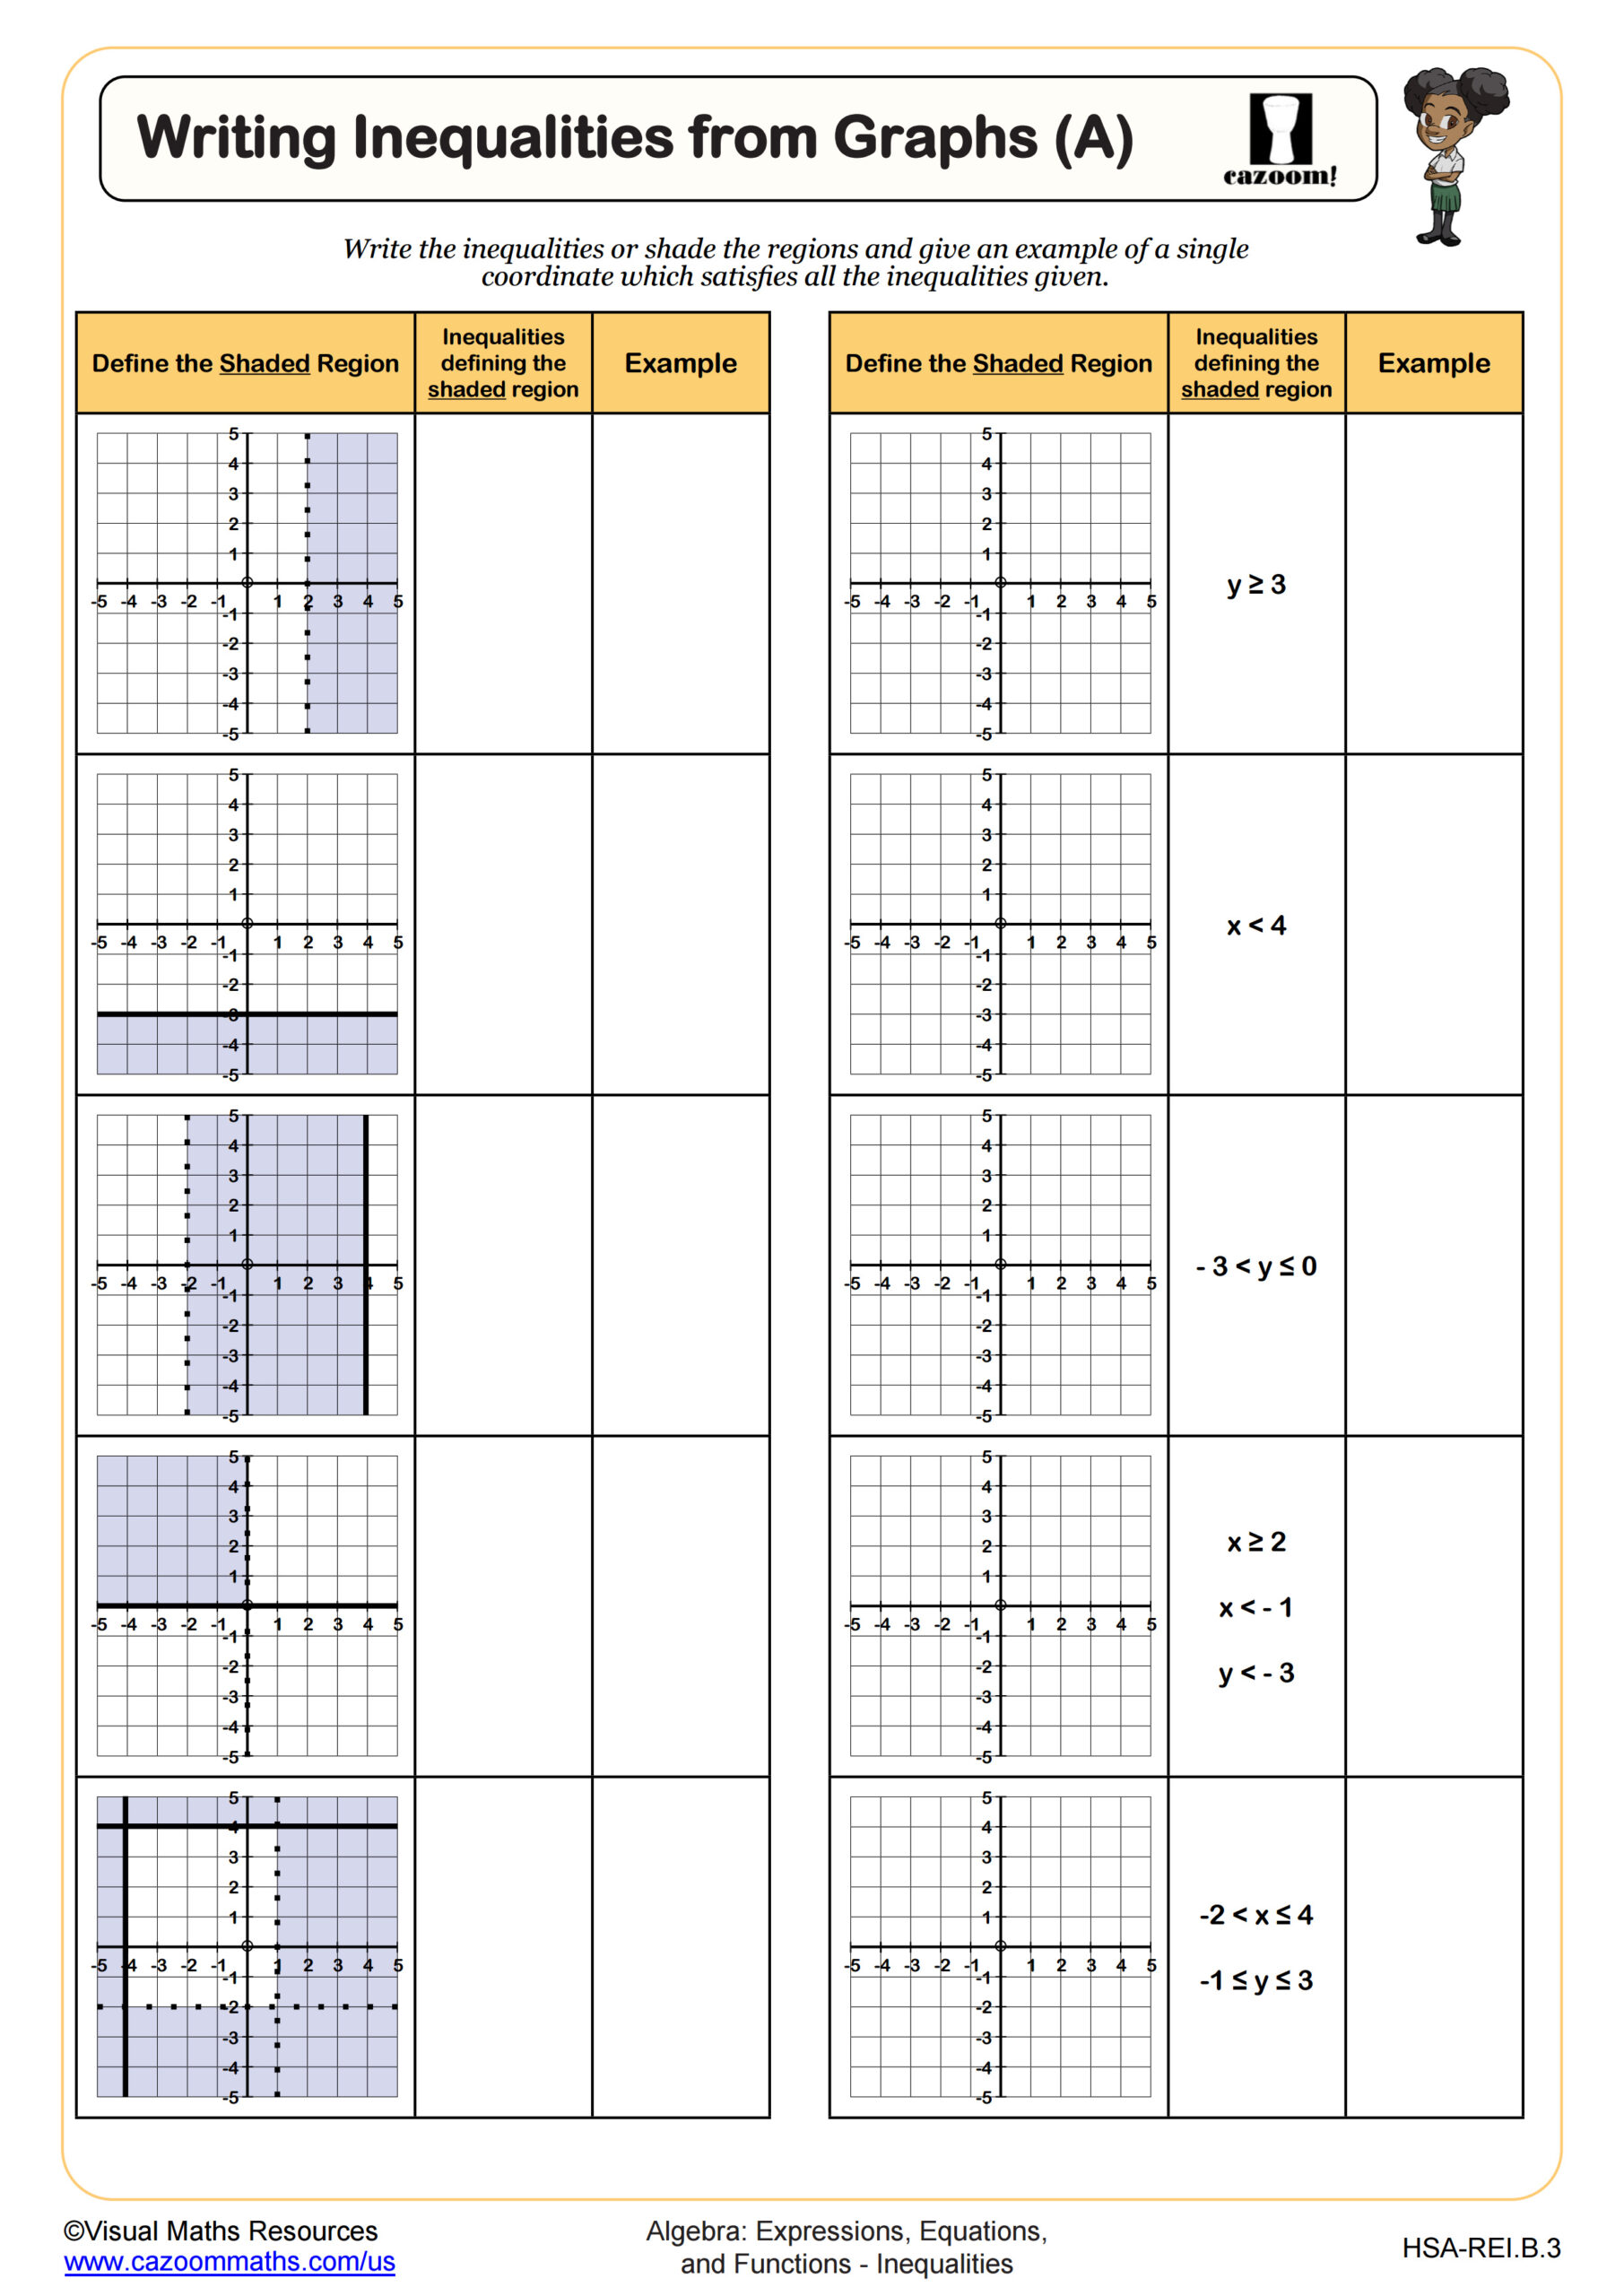
Writing Inequalities from Graphs (A)
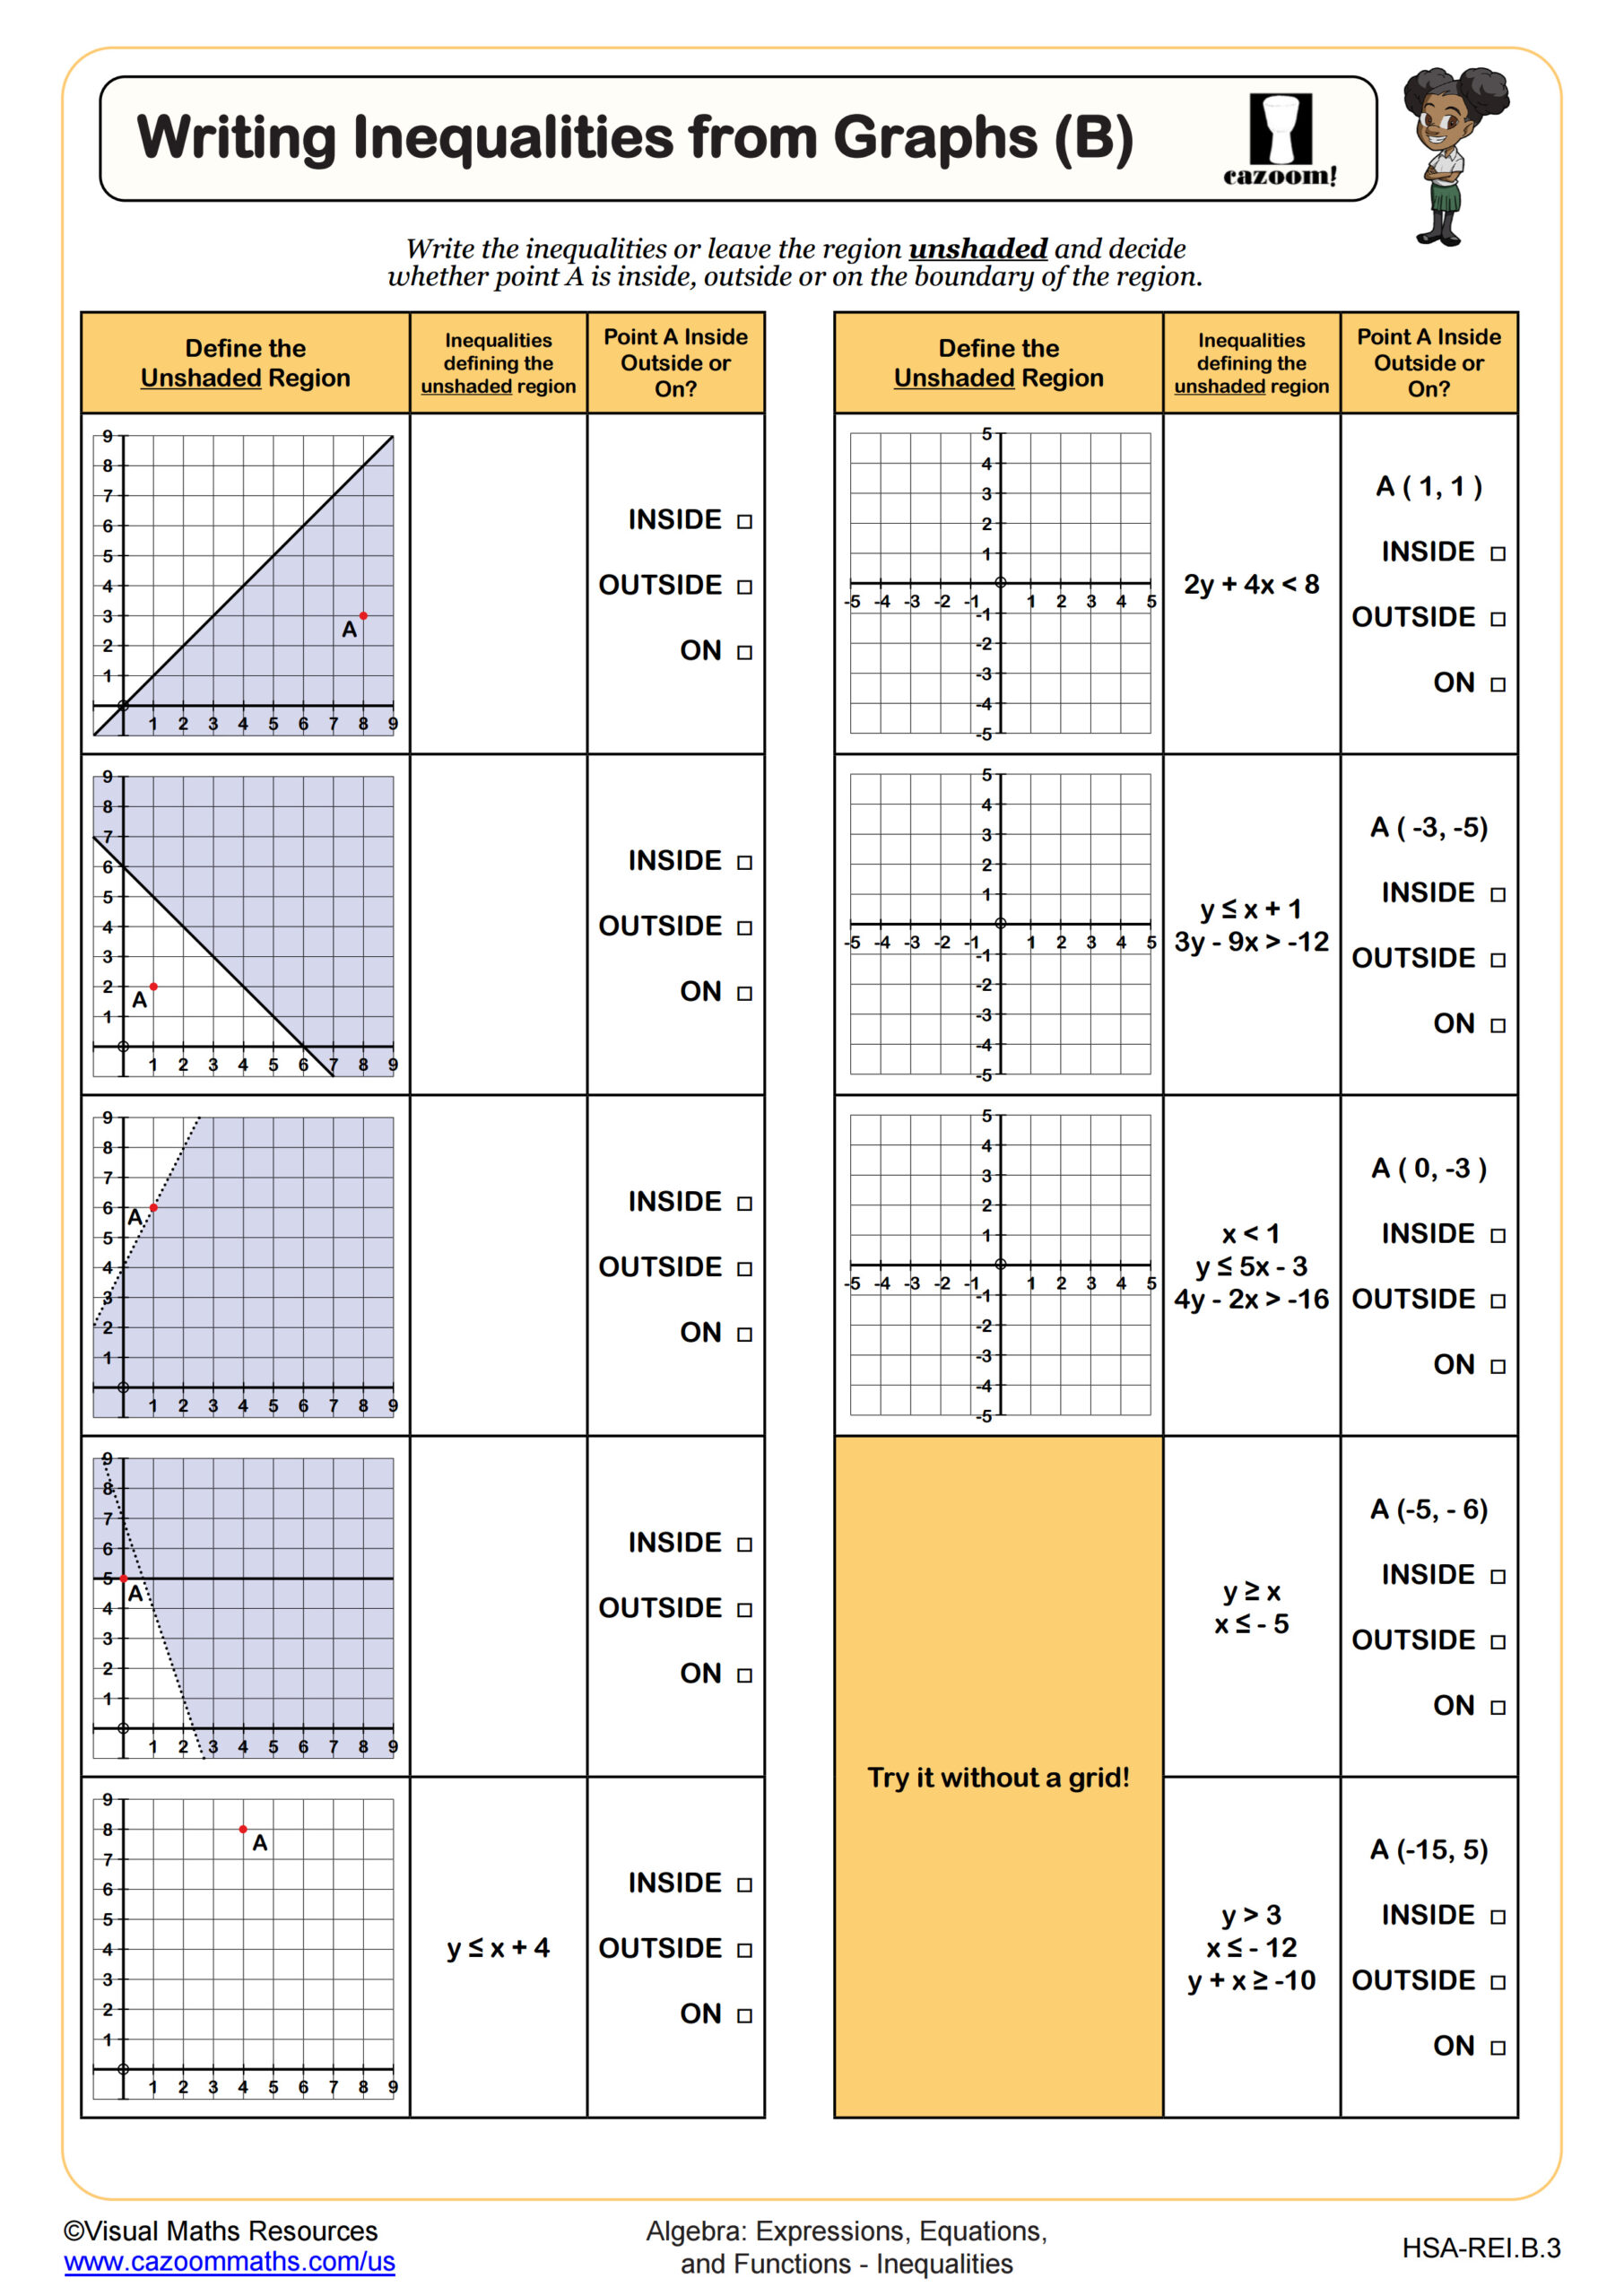
Writing Inequalities from Graphs (B)
All worksheets are created by the team of experienced teachers at Cazoom Math.
What makes a high-quality solving and graphing inequalities worksheet PDF effective for classroom use?
A well-designed solving and graphing inequalities worksheet PDF integrates algebraic problem-solving with coordinate plane visualization, following Common Core Standards for high school algebra. The worksheet should progress from basic one-variable inequalities to systems of inequalities, ensuring students practice both solution methods and graphing techniques systematically.
Teachers notice that students frequently forget to reverse inequality signs when multiplying or dividing by negative numbers, then carry this error into their graphs. Effective worksheets include multiple problems specifically targeting this misconception, with clear visual cues and step-by-step examples that reinforce the connection between algebraic solutions and their graphical representations.
Which grade levels should use solve and graph inequalities worksheet problems?
Most solve and graph inequalities worksheet content aligns with Algebra 1 and Algebra 2 curricula, typically serving grades 9-11. Students encounter basic linear inequalities in freshman algebra, then progress to compound and absolute value inequalities in more advanced courses. The graphing component connects directly to coordinate geometry standards across these grade levels.
Teachers find that 9th graders often need additional scaffolding when first learning to graph inequalities on coordinate planes. Students who mastered solving linear equations may struggle with the transition to inequality notation and shading regions. By 11th grade, students should fluently move between algebraic and graphical representations while solving real-world optimization problems in economics and engineering contexts.
How do compound inequalities differ from basic inequalities in worksheet practice?
Compound inequalities require students to solve two inequality statements simultaneously, either as "and" statements (intersection) or "or" statements (union). These problems appear frequently in Algebra 2 curricula and challenge students to coordinate multiple solution sets. Writing and graphing inequalities worksheet problems with compound statements develop critical thinking about overlapping solution regions.
Teachers observe that students often confuse the graphical representation of "and" versus "or" compound inequalities. Many students incorrectly shade the entire solution space rather than identifying the specific intersection or union regions. Effective worksheet practice includes visual examples showing how compound inequality solutions translate to number line representations and coordinate plane graphs.
What teaching strategies work best when using inequalities worksheets in class?
Teachers achieve better results by having students solve inequalities algebraically first, then immediately graph their solutions on the same worksheet. This dual approach reinforces the connection between symbolic manipulation and visual representation. Using colored pencils or highlighters helps students distinguish between different inequality regions and boundary lines during graphing practice.
Many teachers implement partner checking strategies where students compare both algebraic solutions and graphs before consulting answer keys. This peer review process catches common errors like incorrect boundary line types (solid versus dashed) and shading mistakes. Students benefit from verifying their solutions by testing coordinate points within shaded regions, strengthening their understanding of inequality solution sets.