High School Linear Functions Worksheets
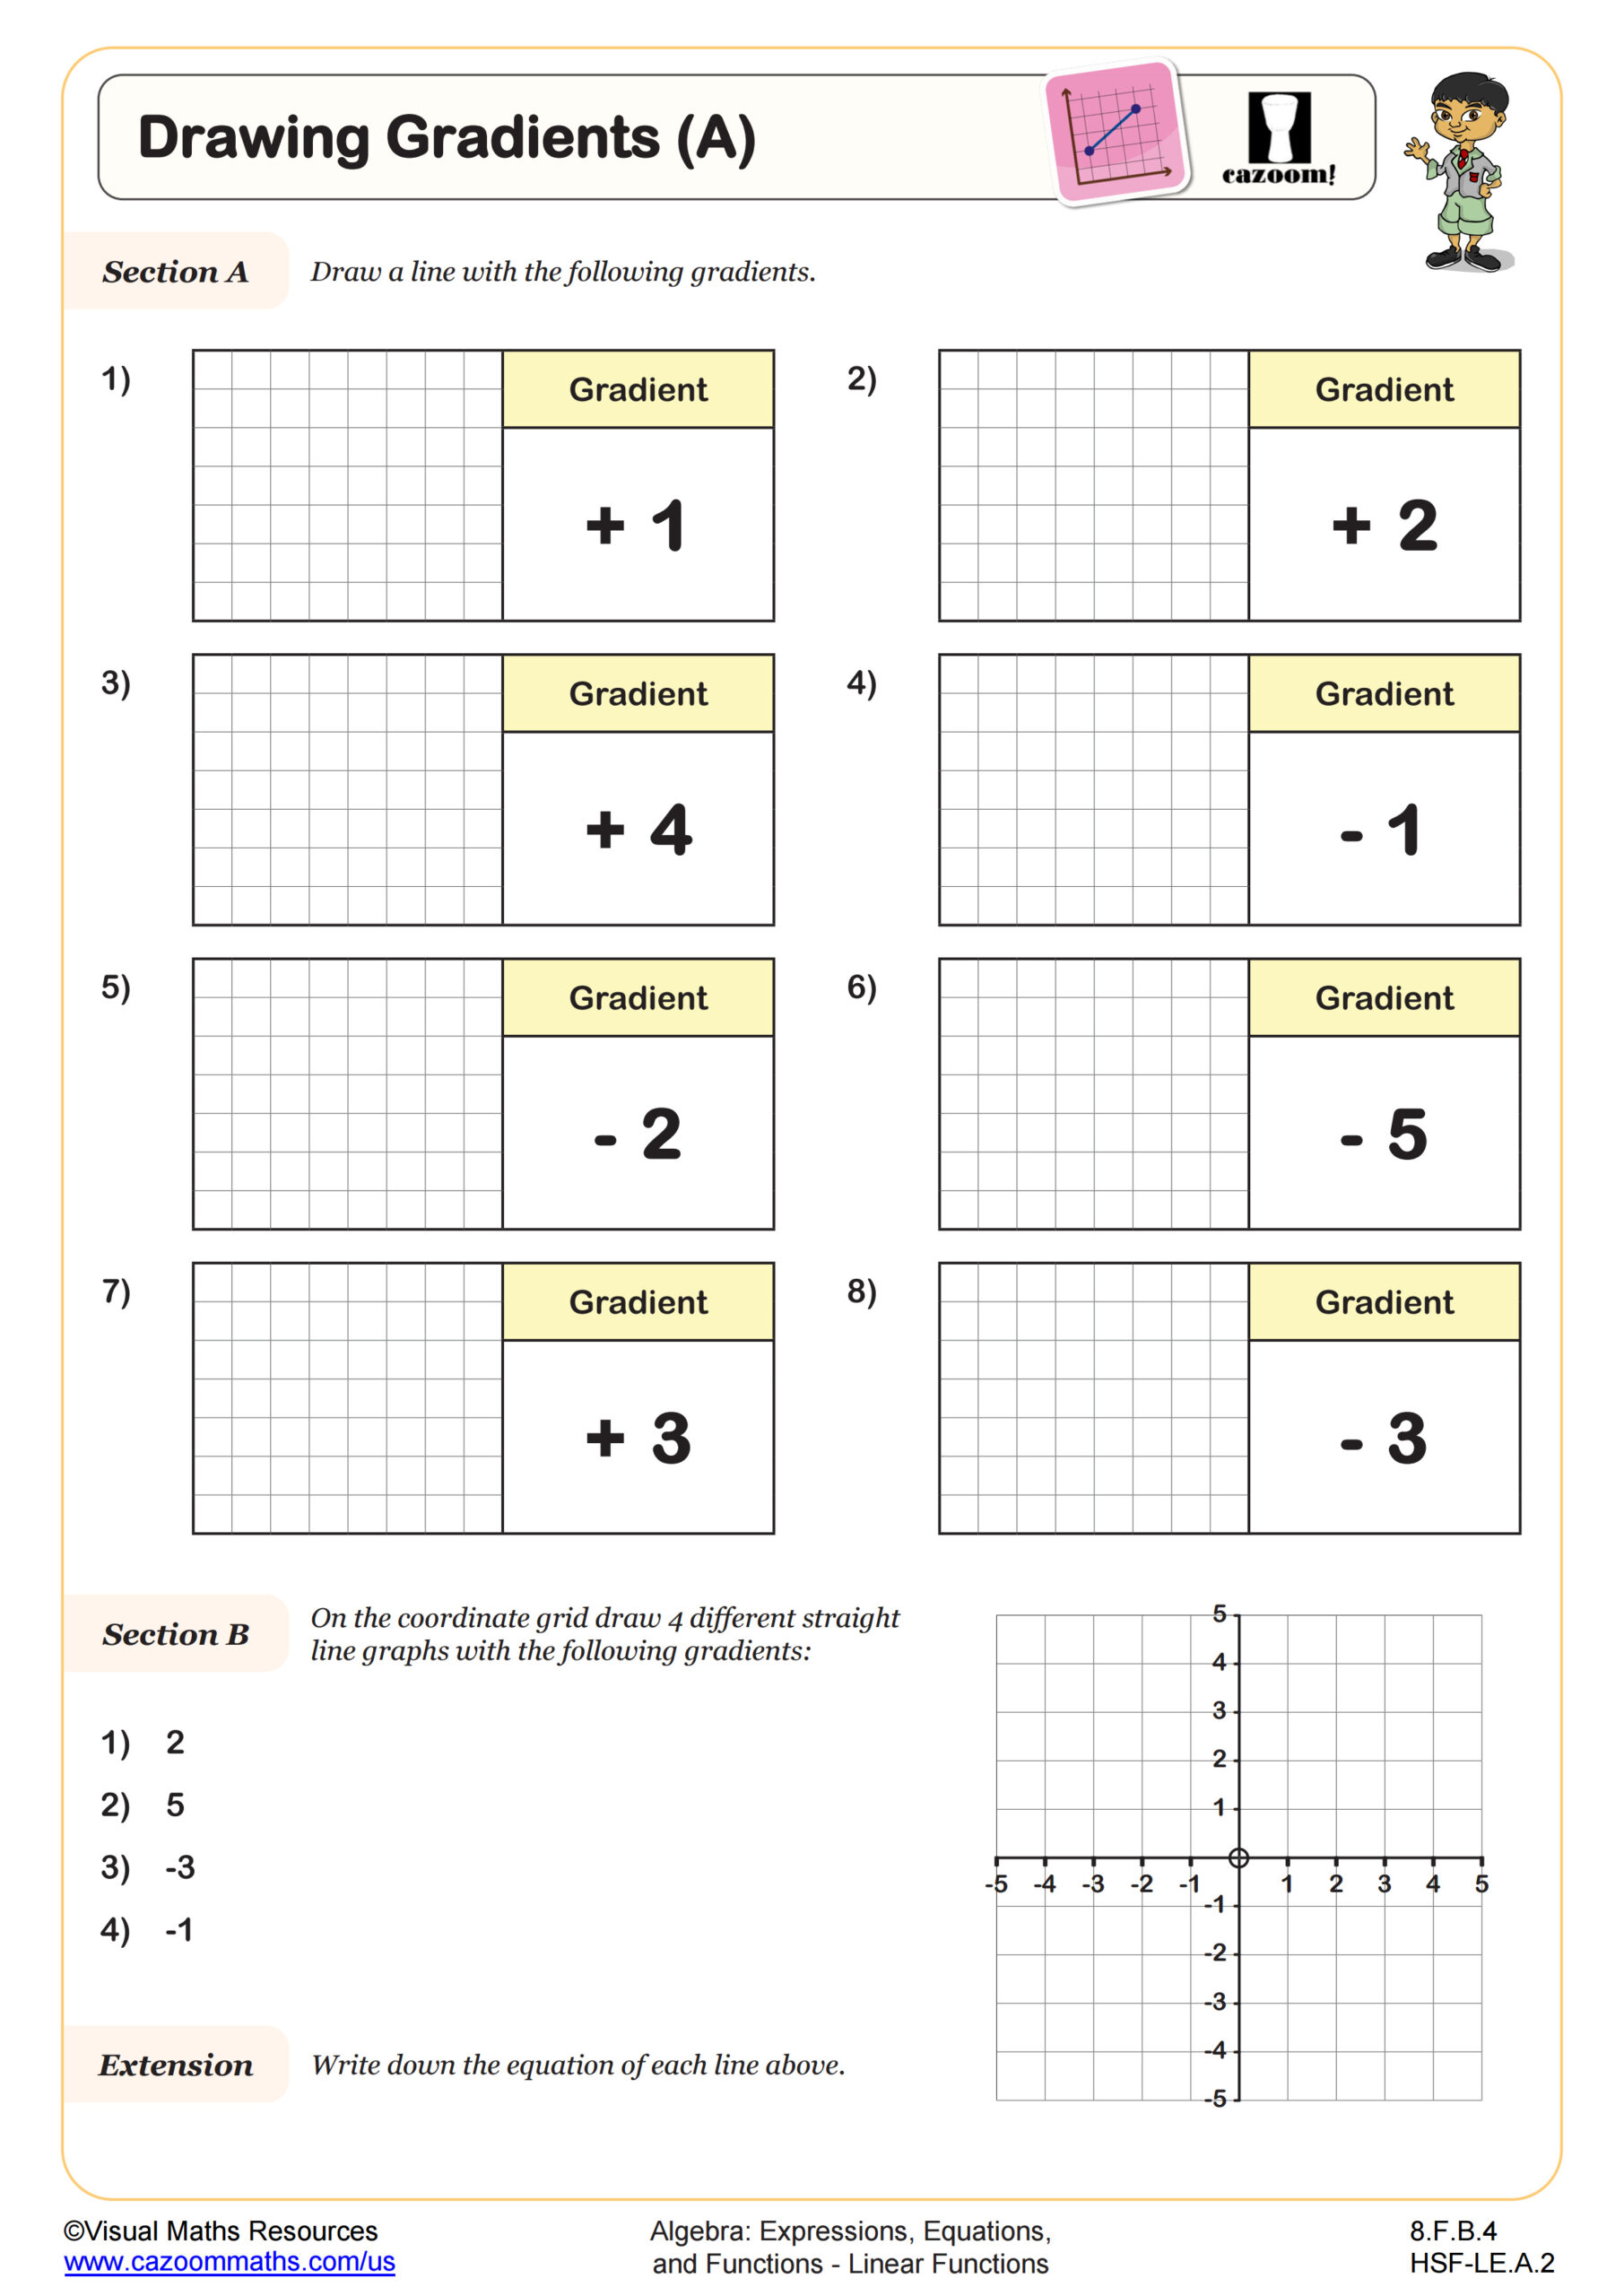
Drawing Gradients (A)
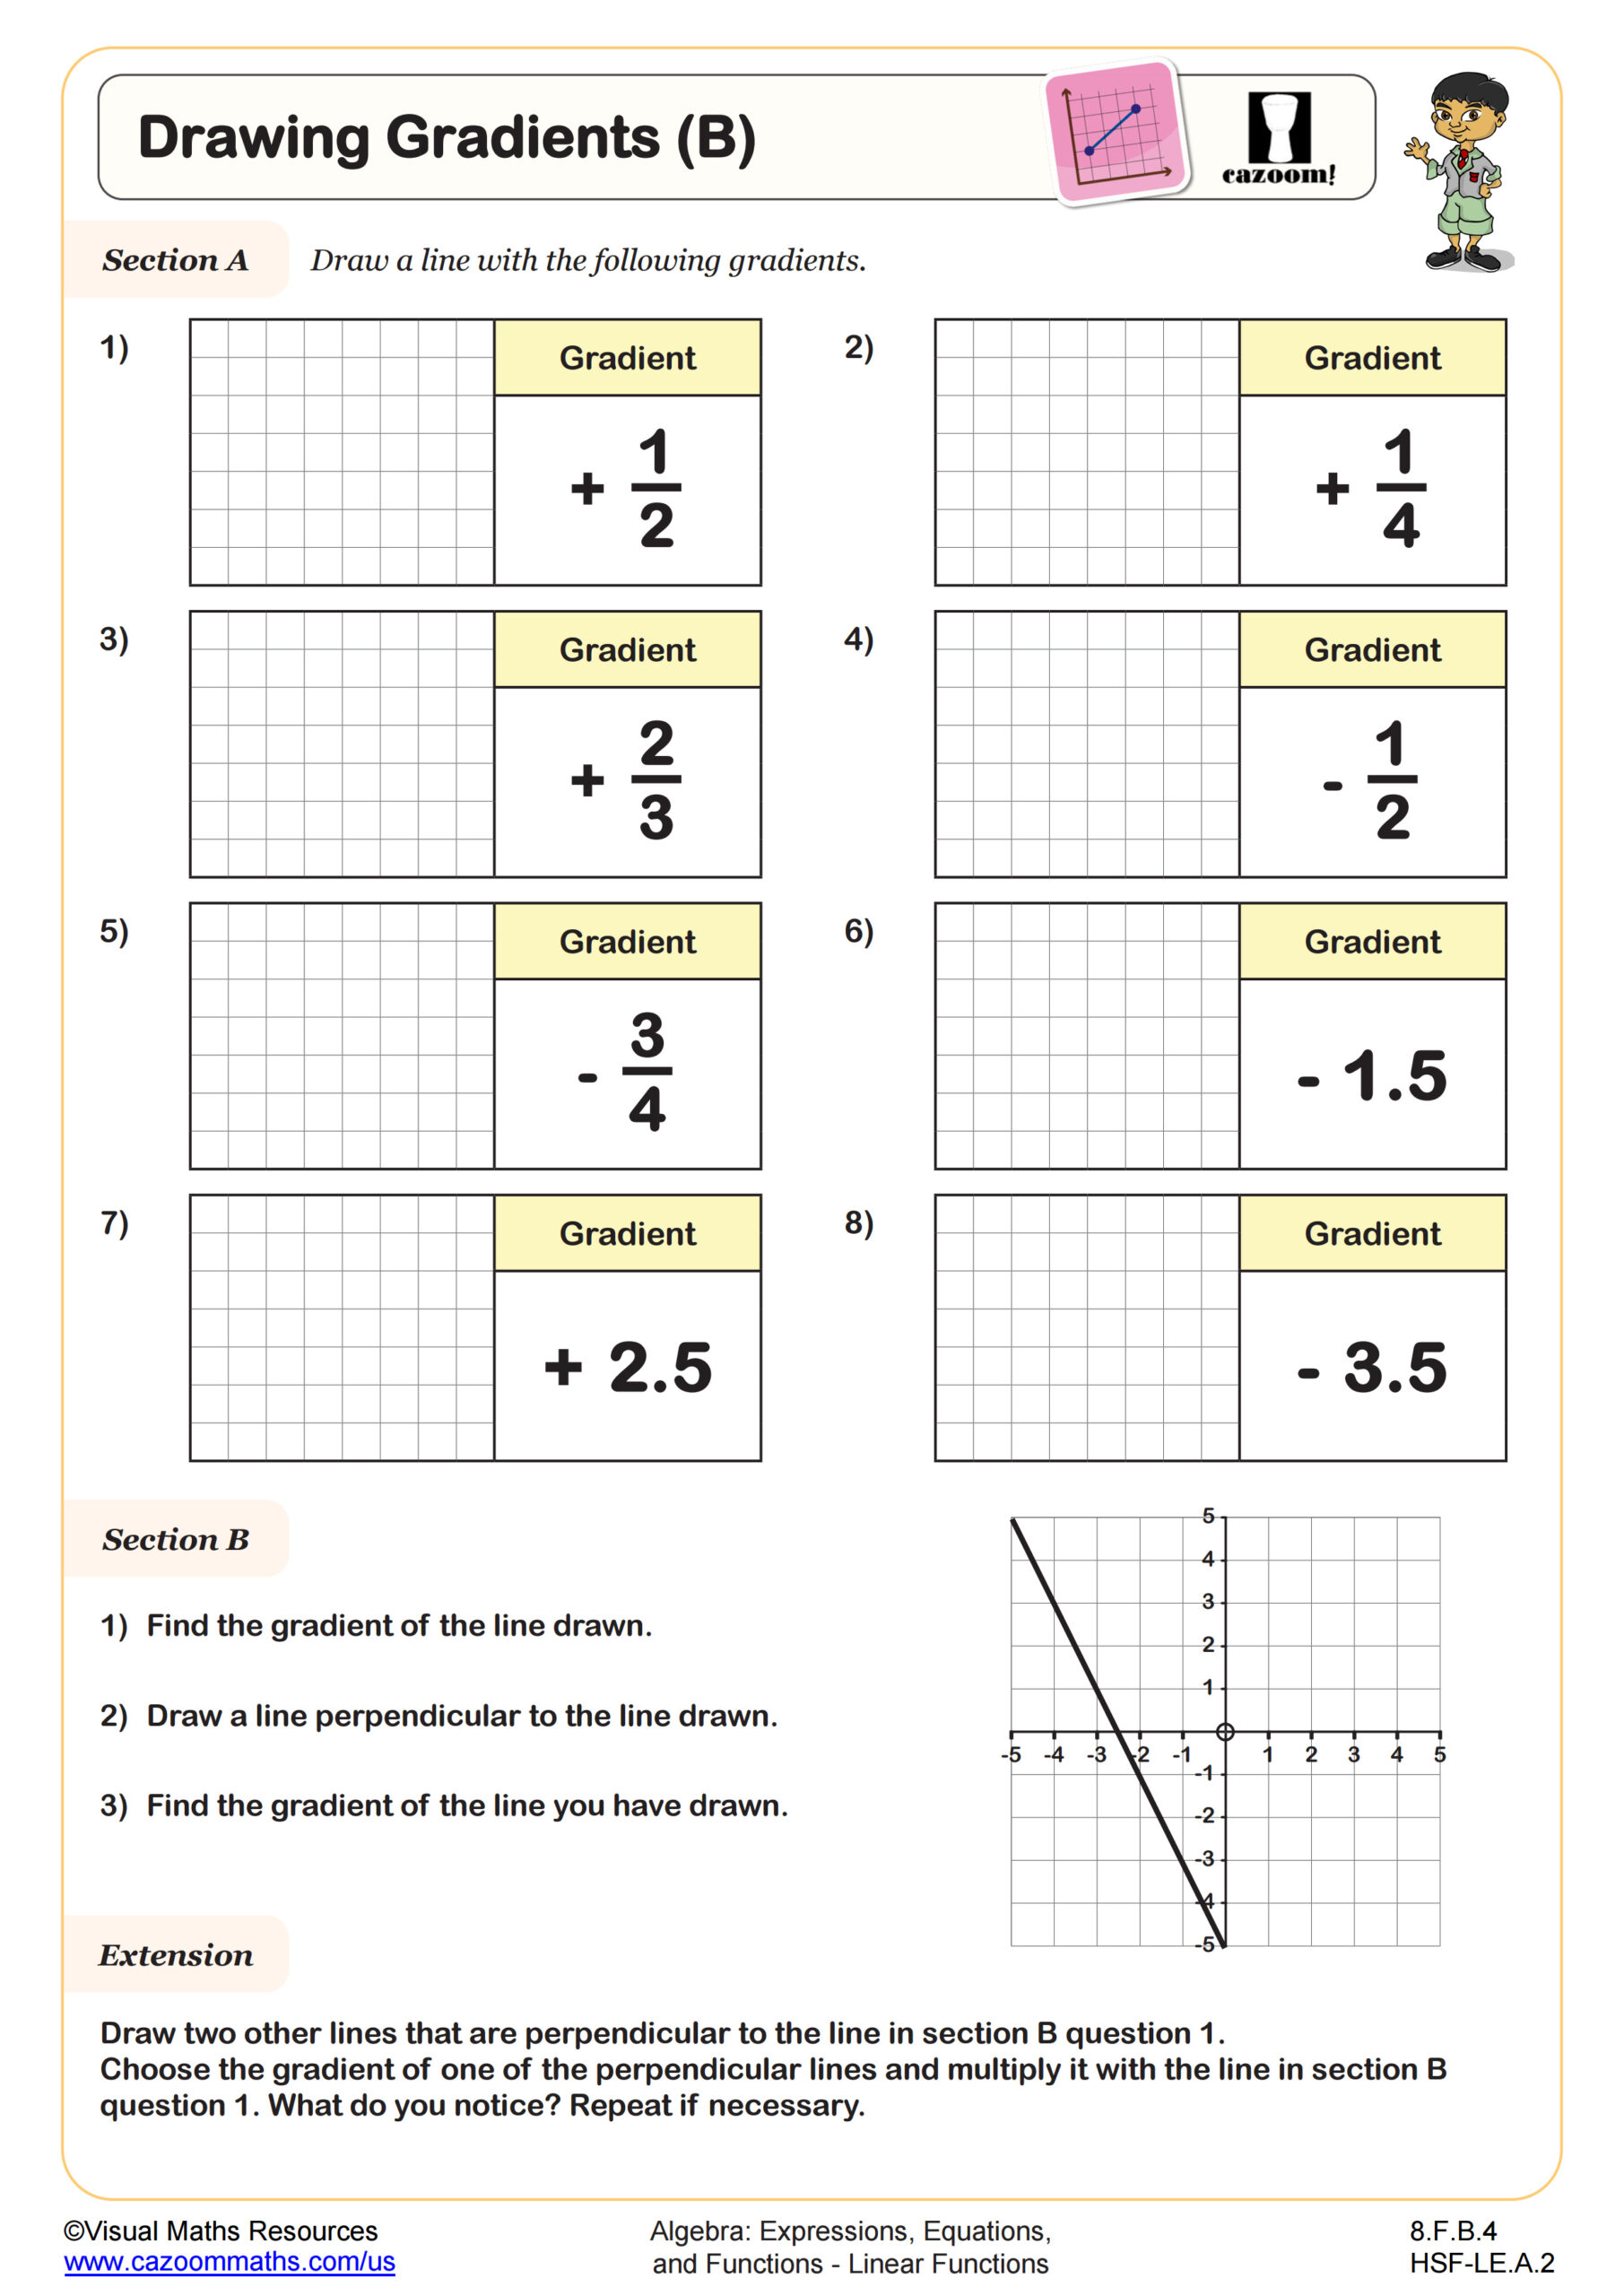
Drawing Gradients (B)
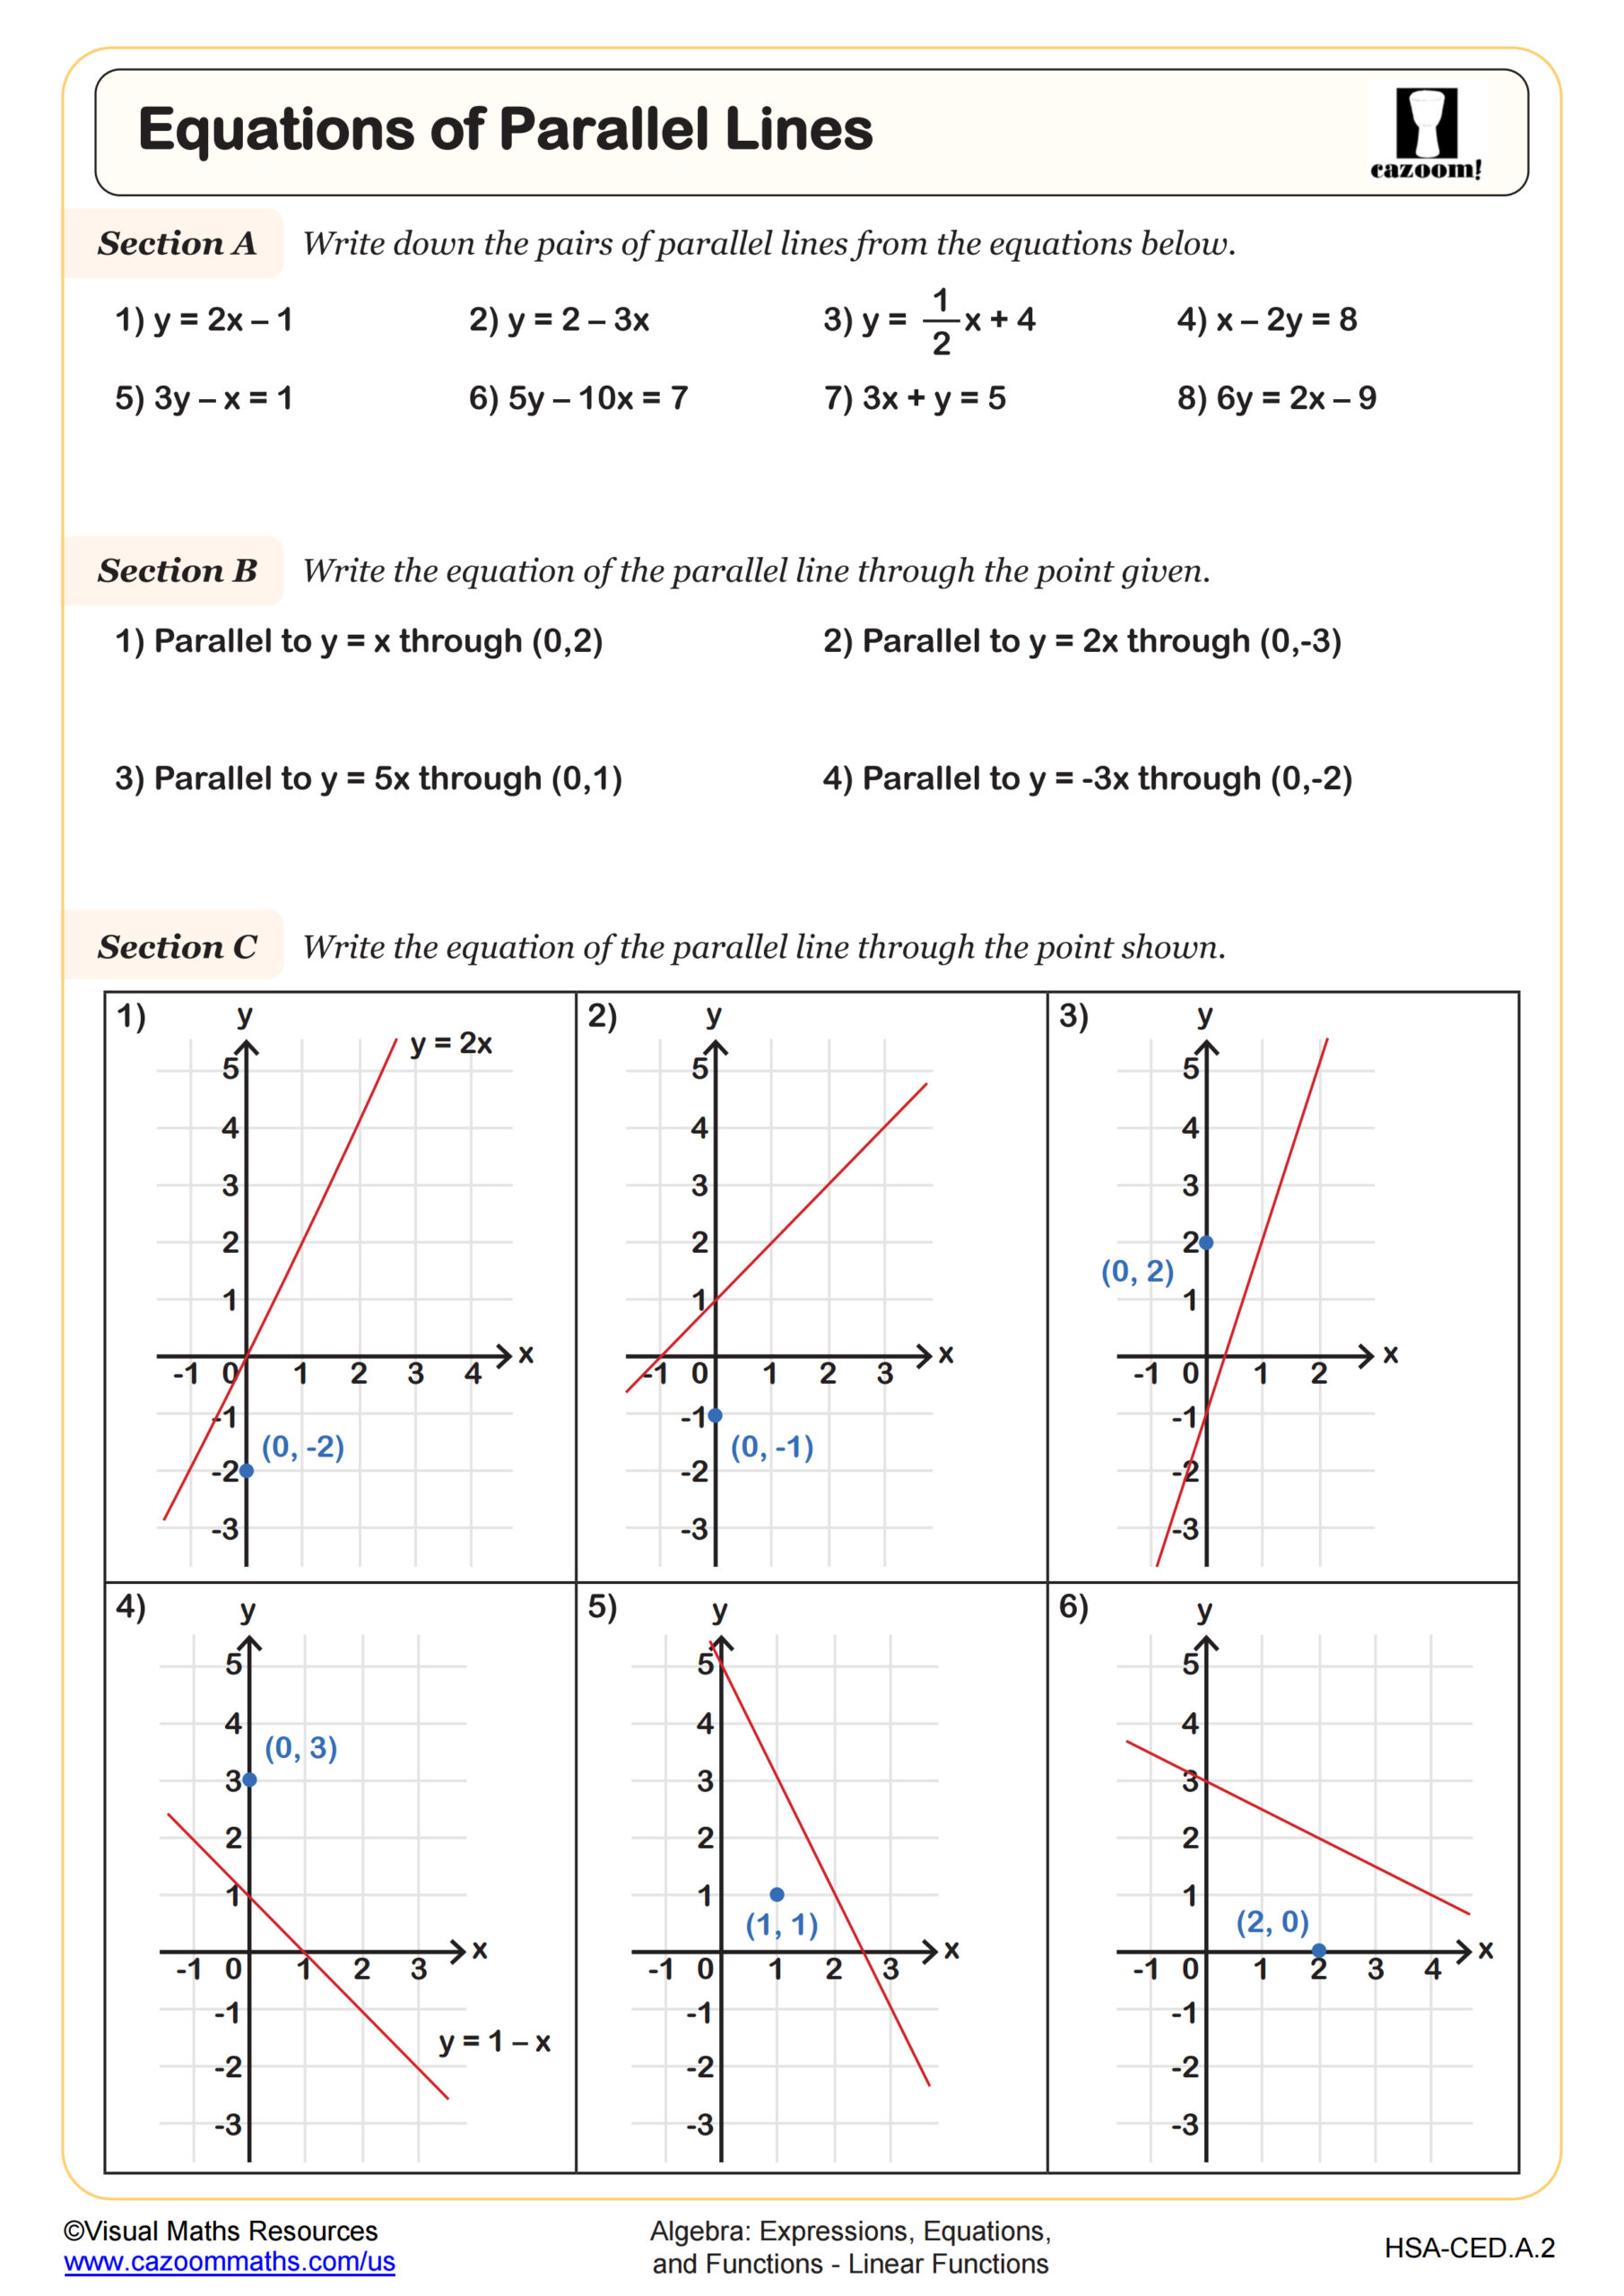
Equations of Parallel Lines
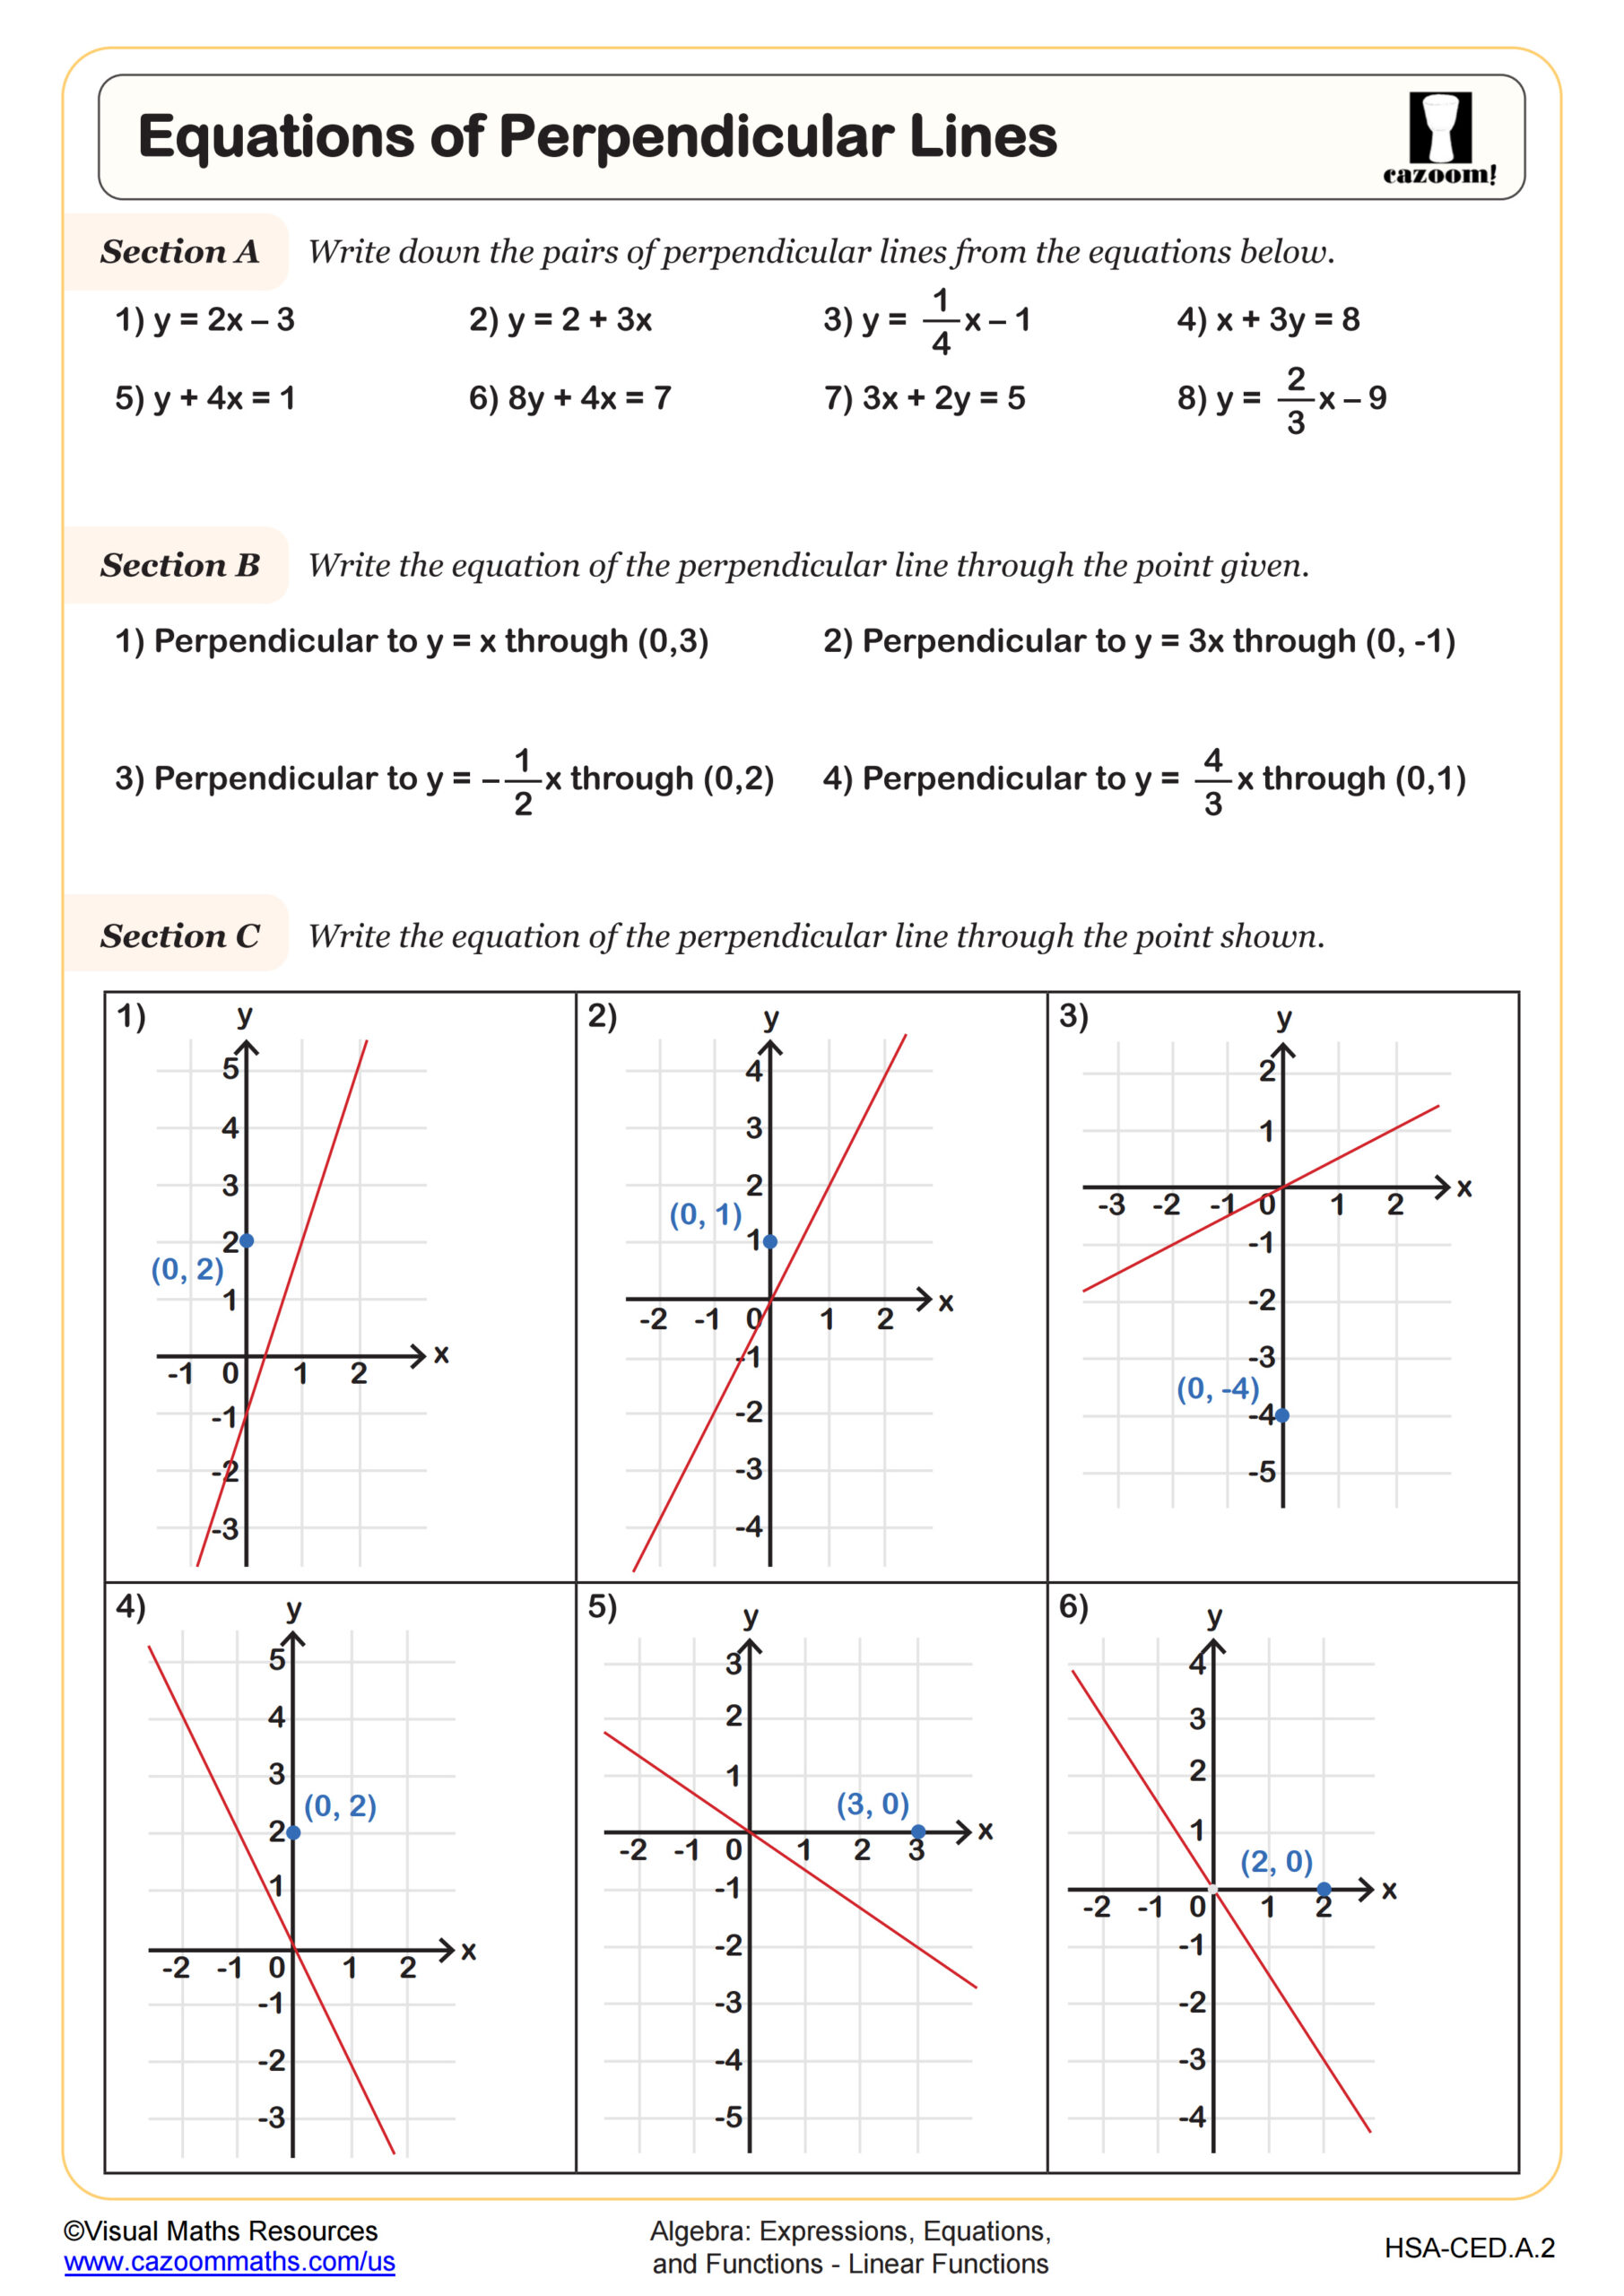
Equations of Perpendicular Lines
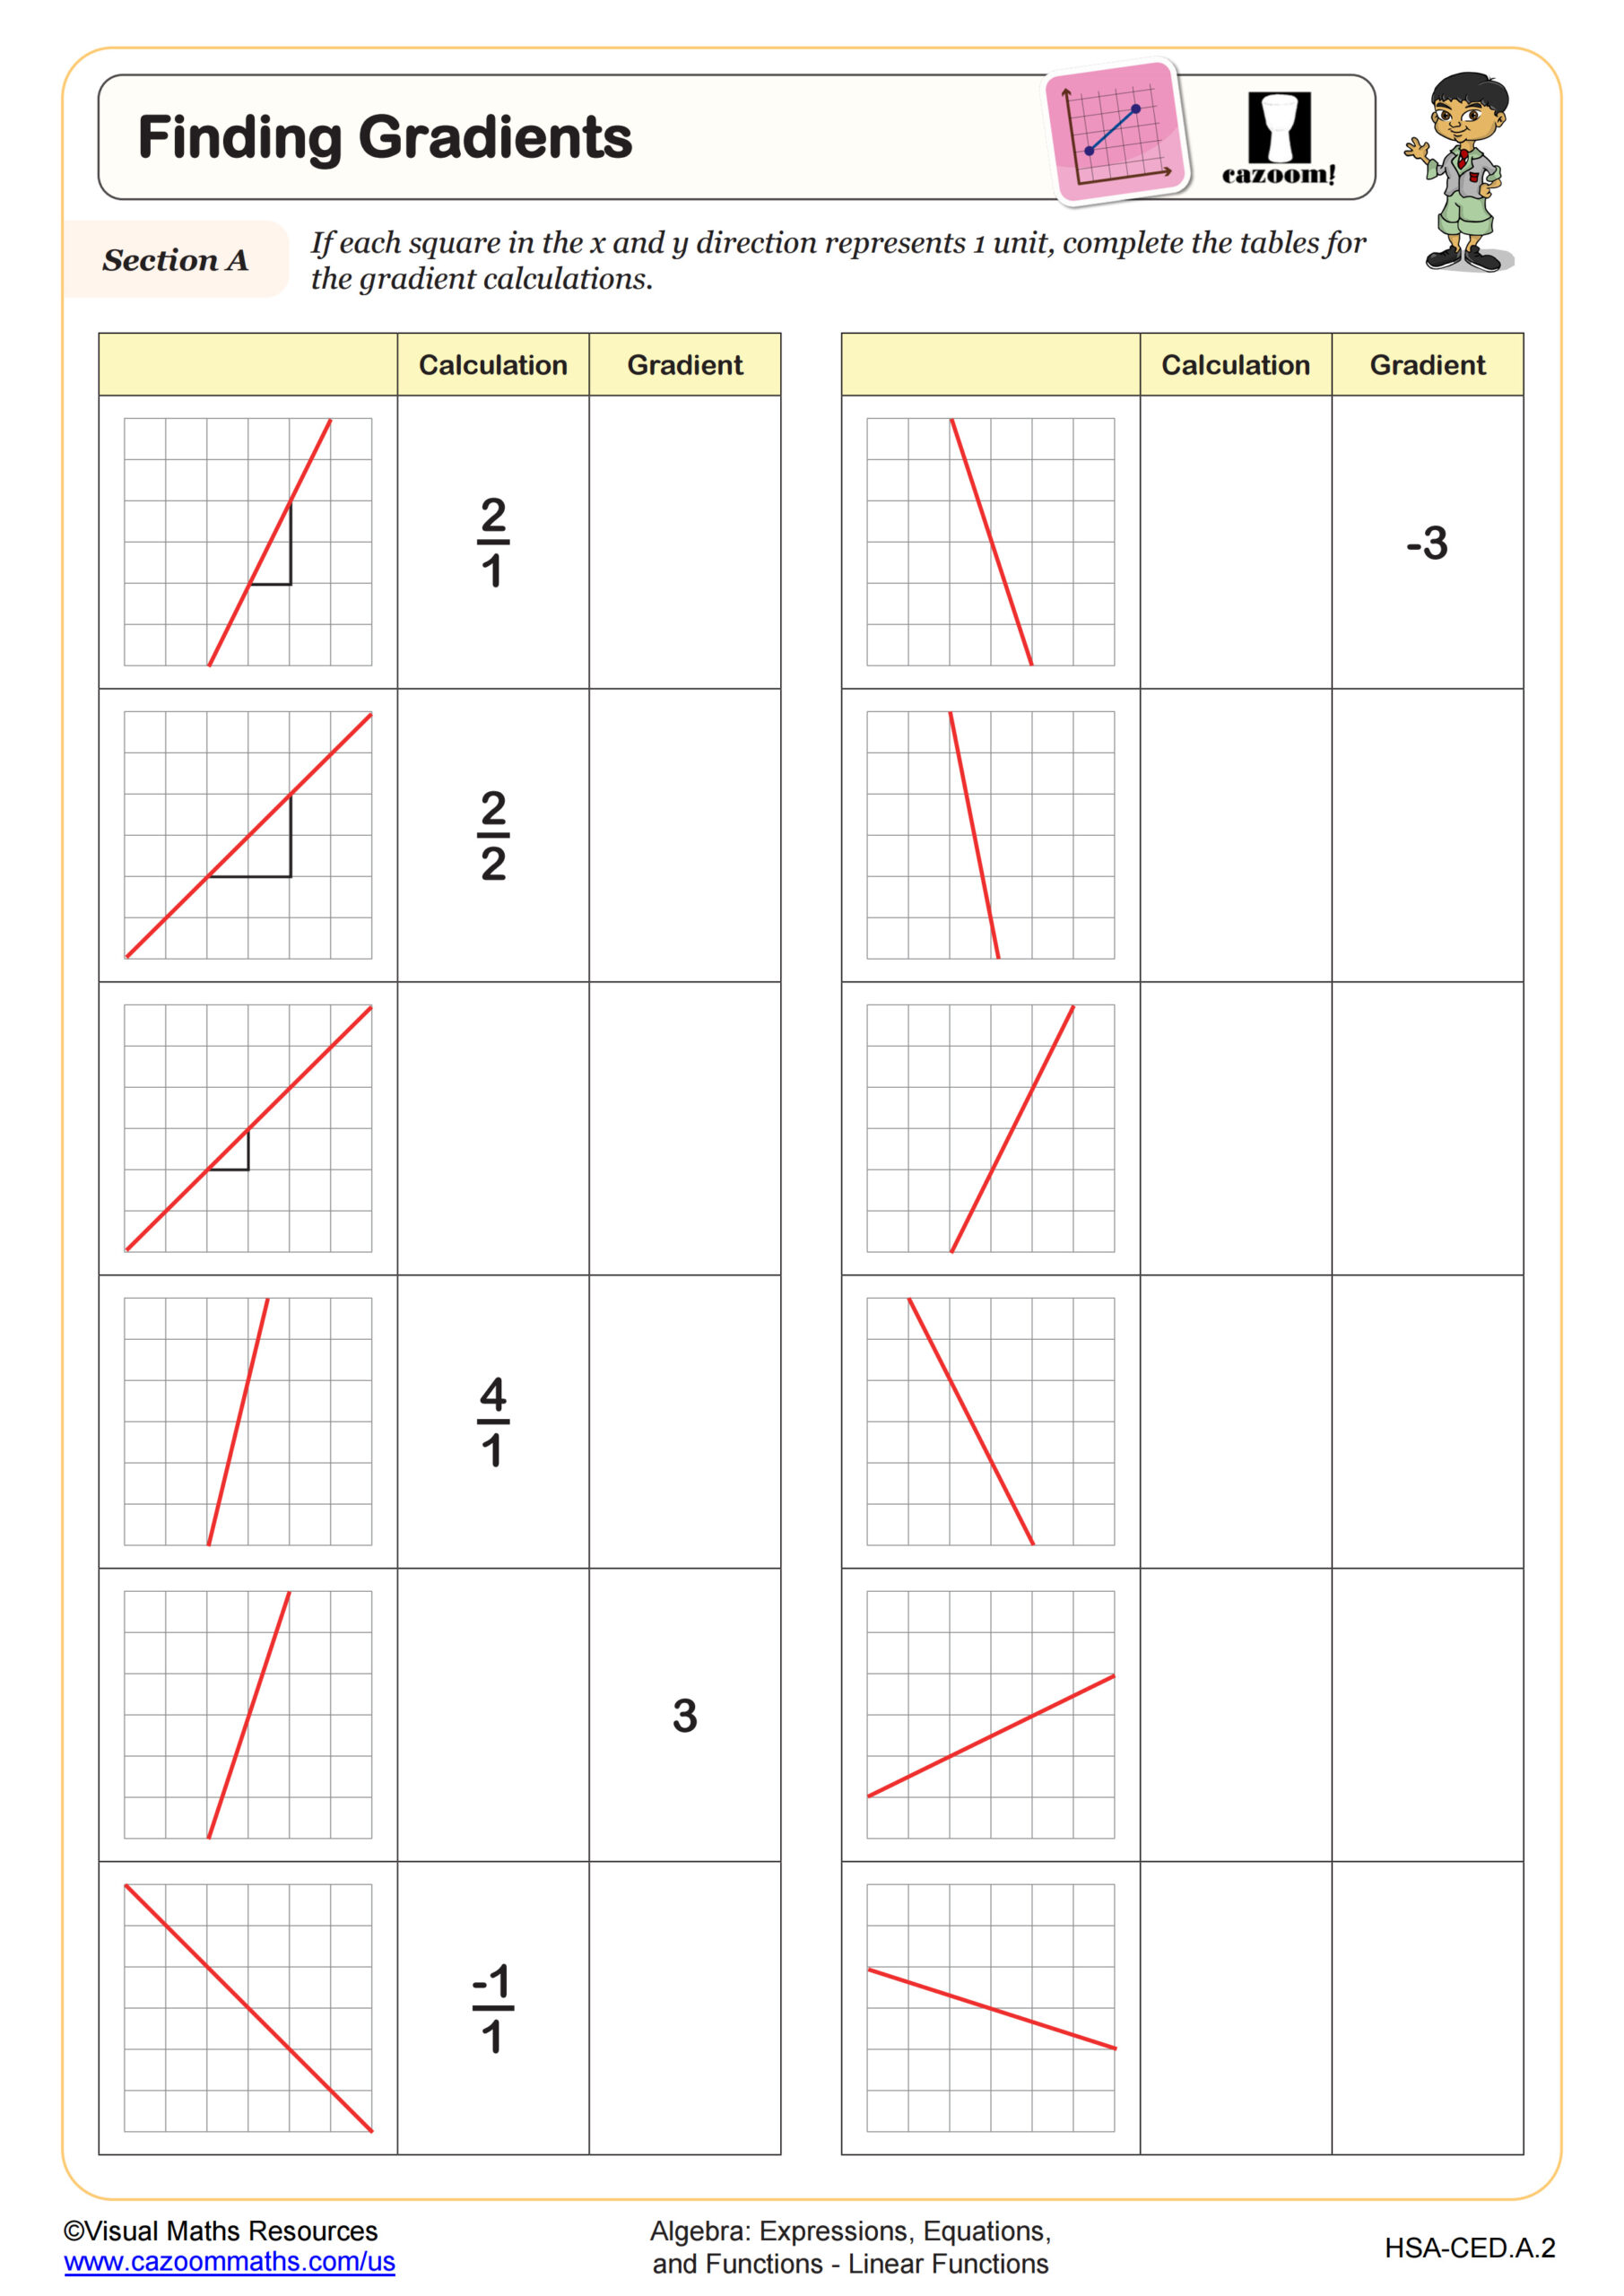
Finding Gradients
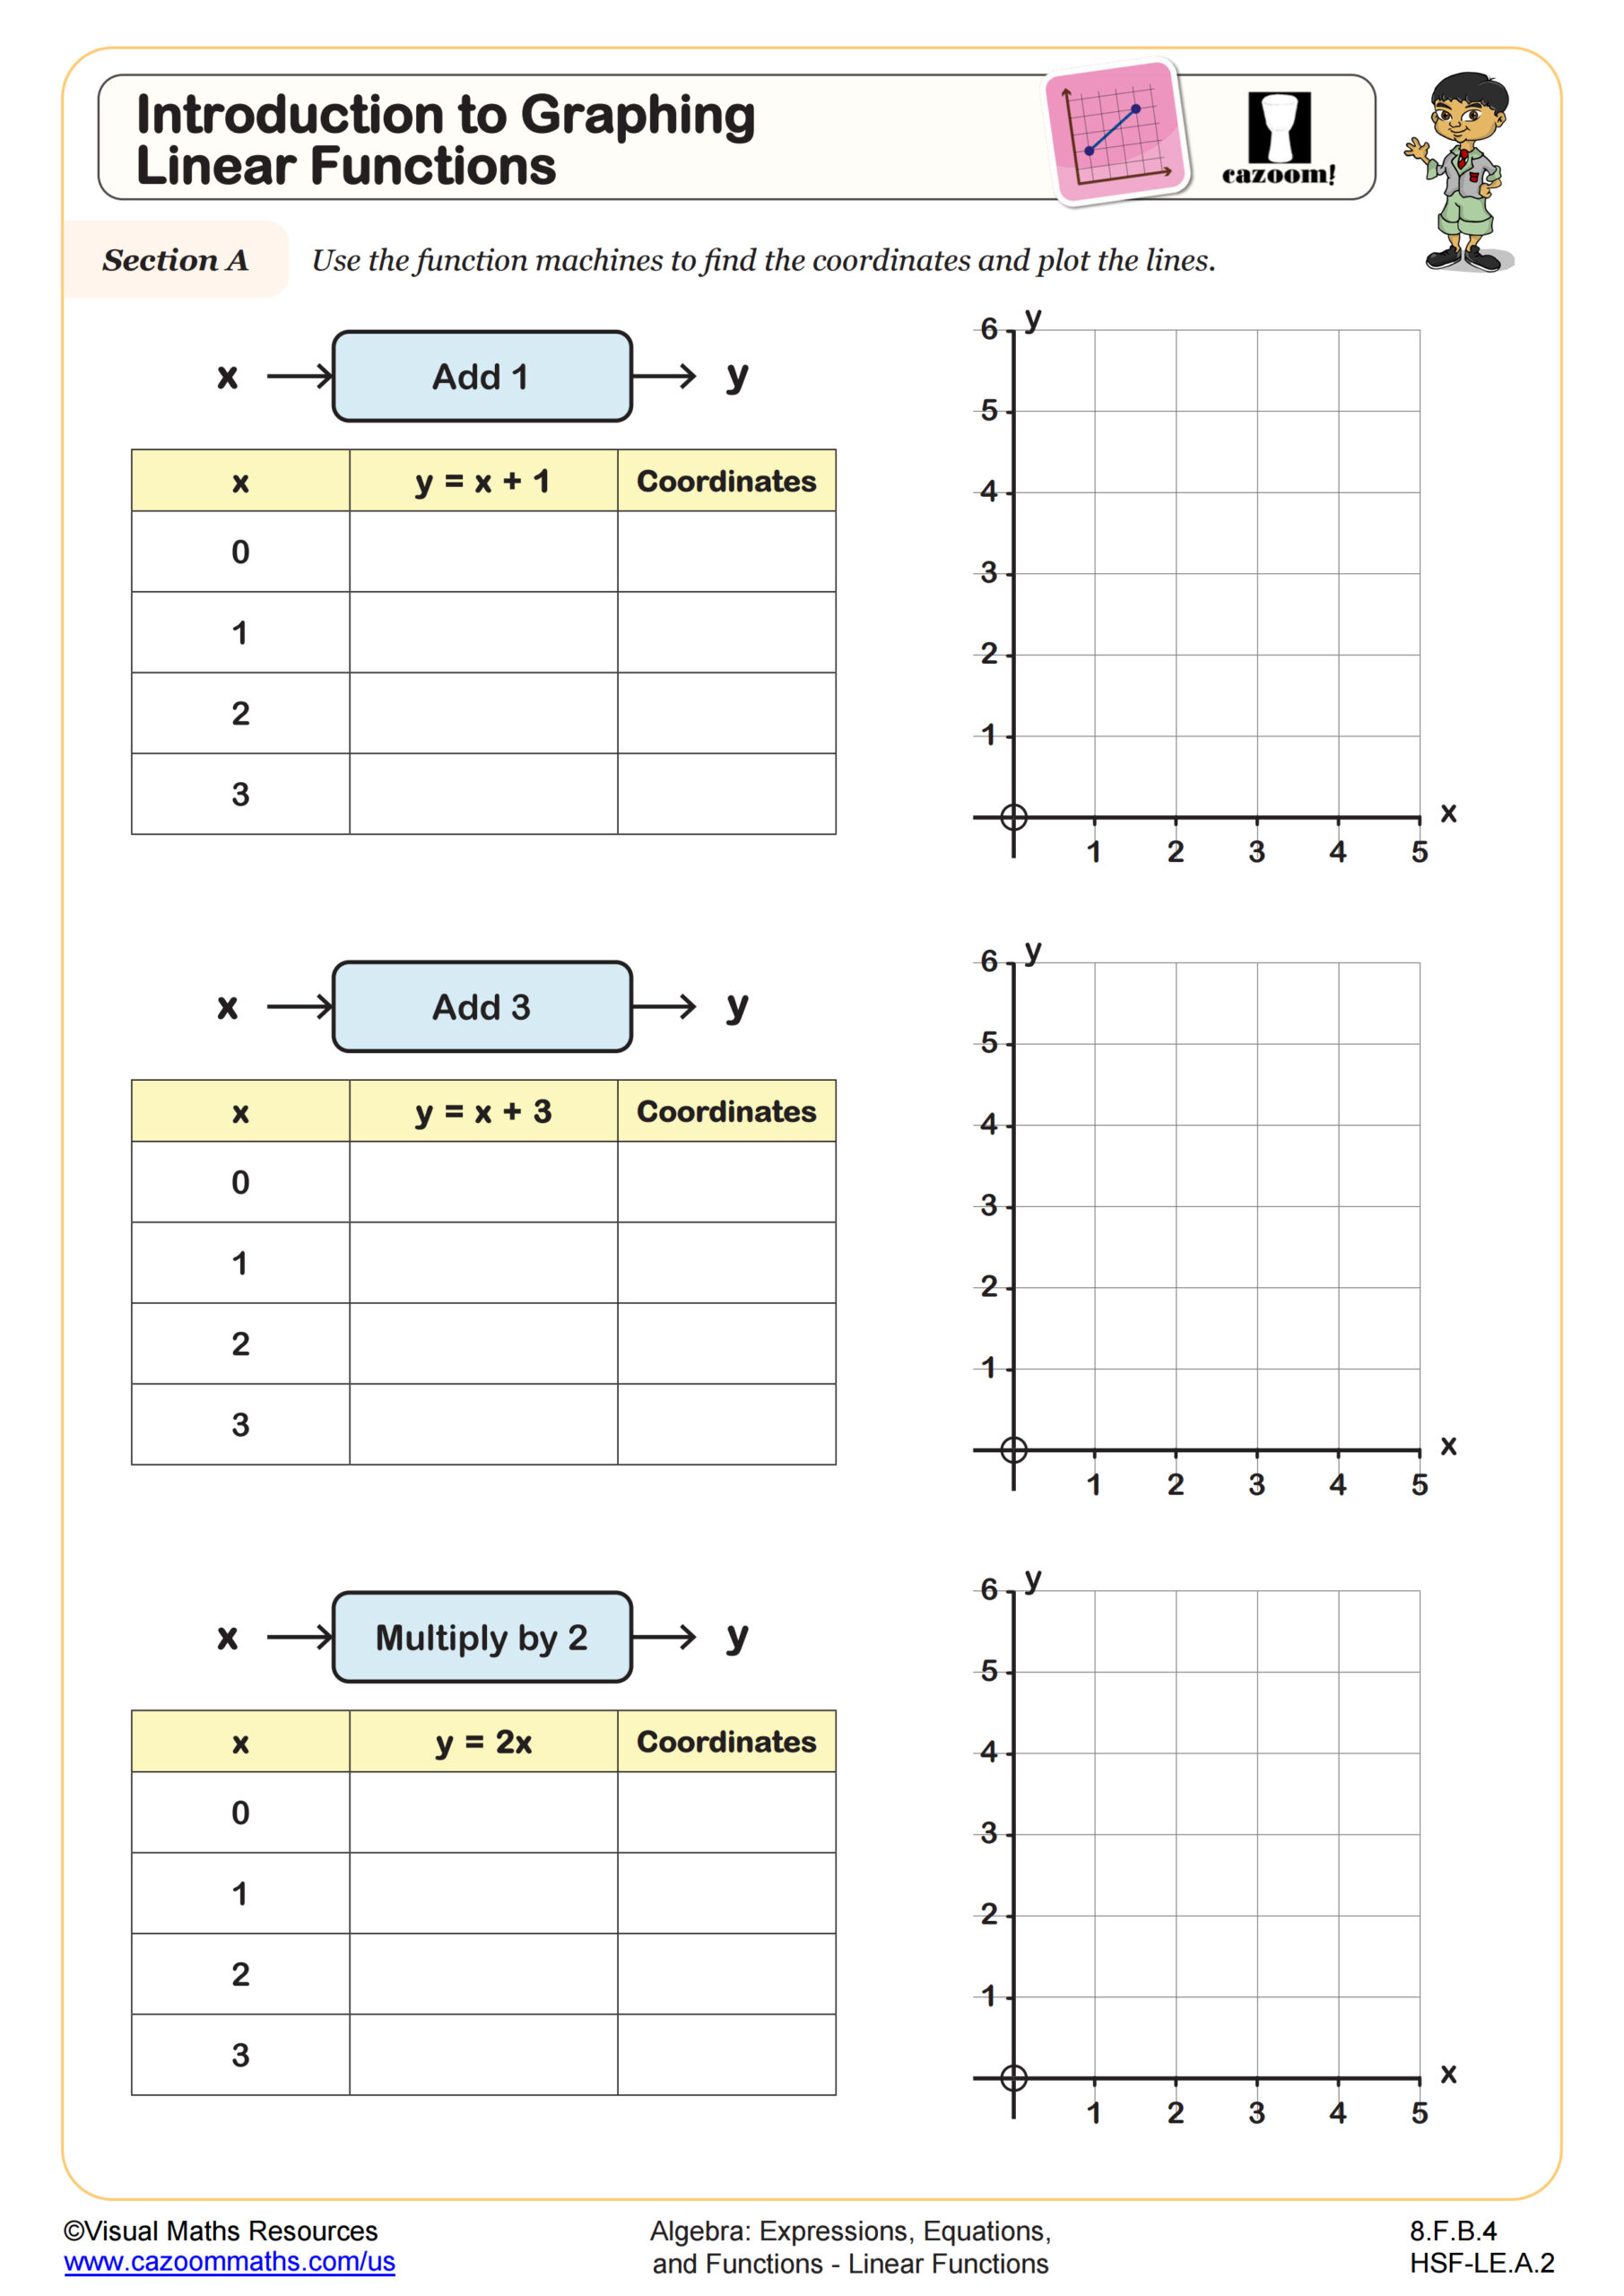
Introduction to Graphing Linear Functions
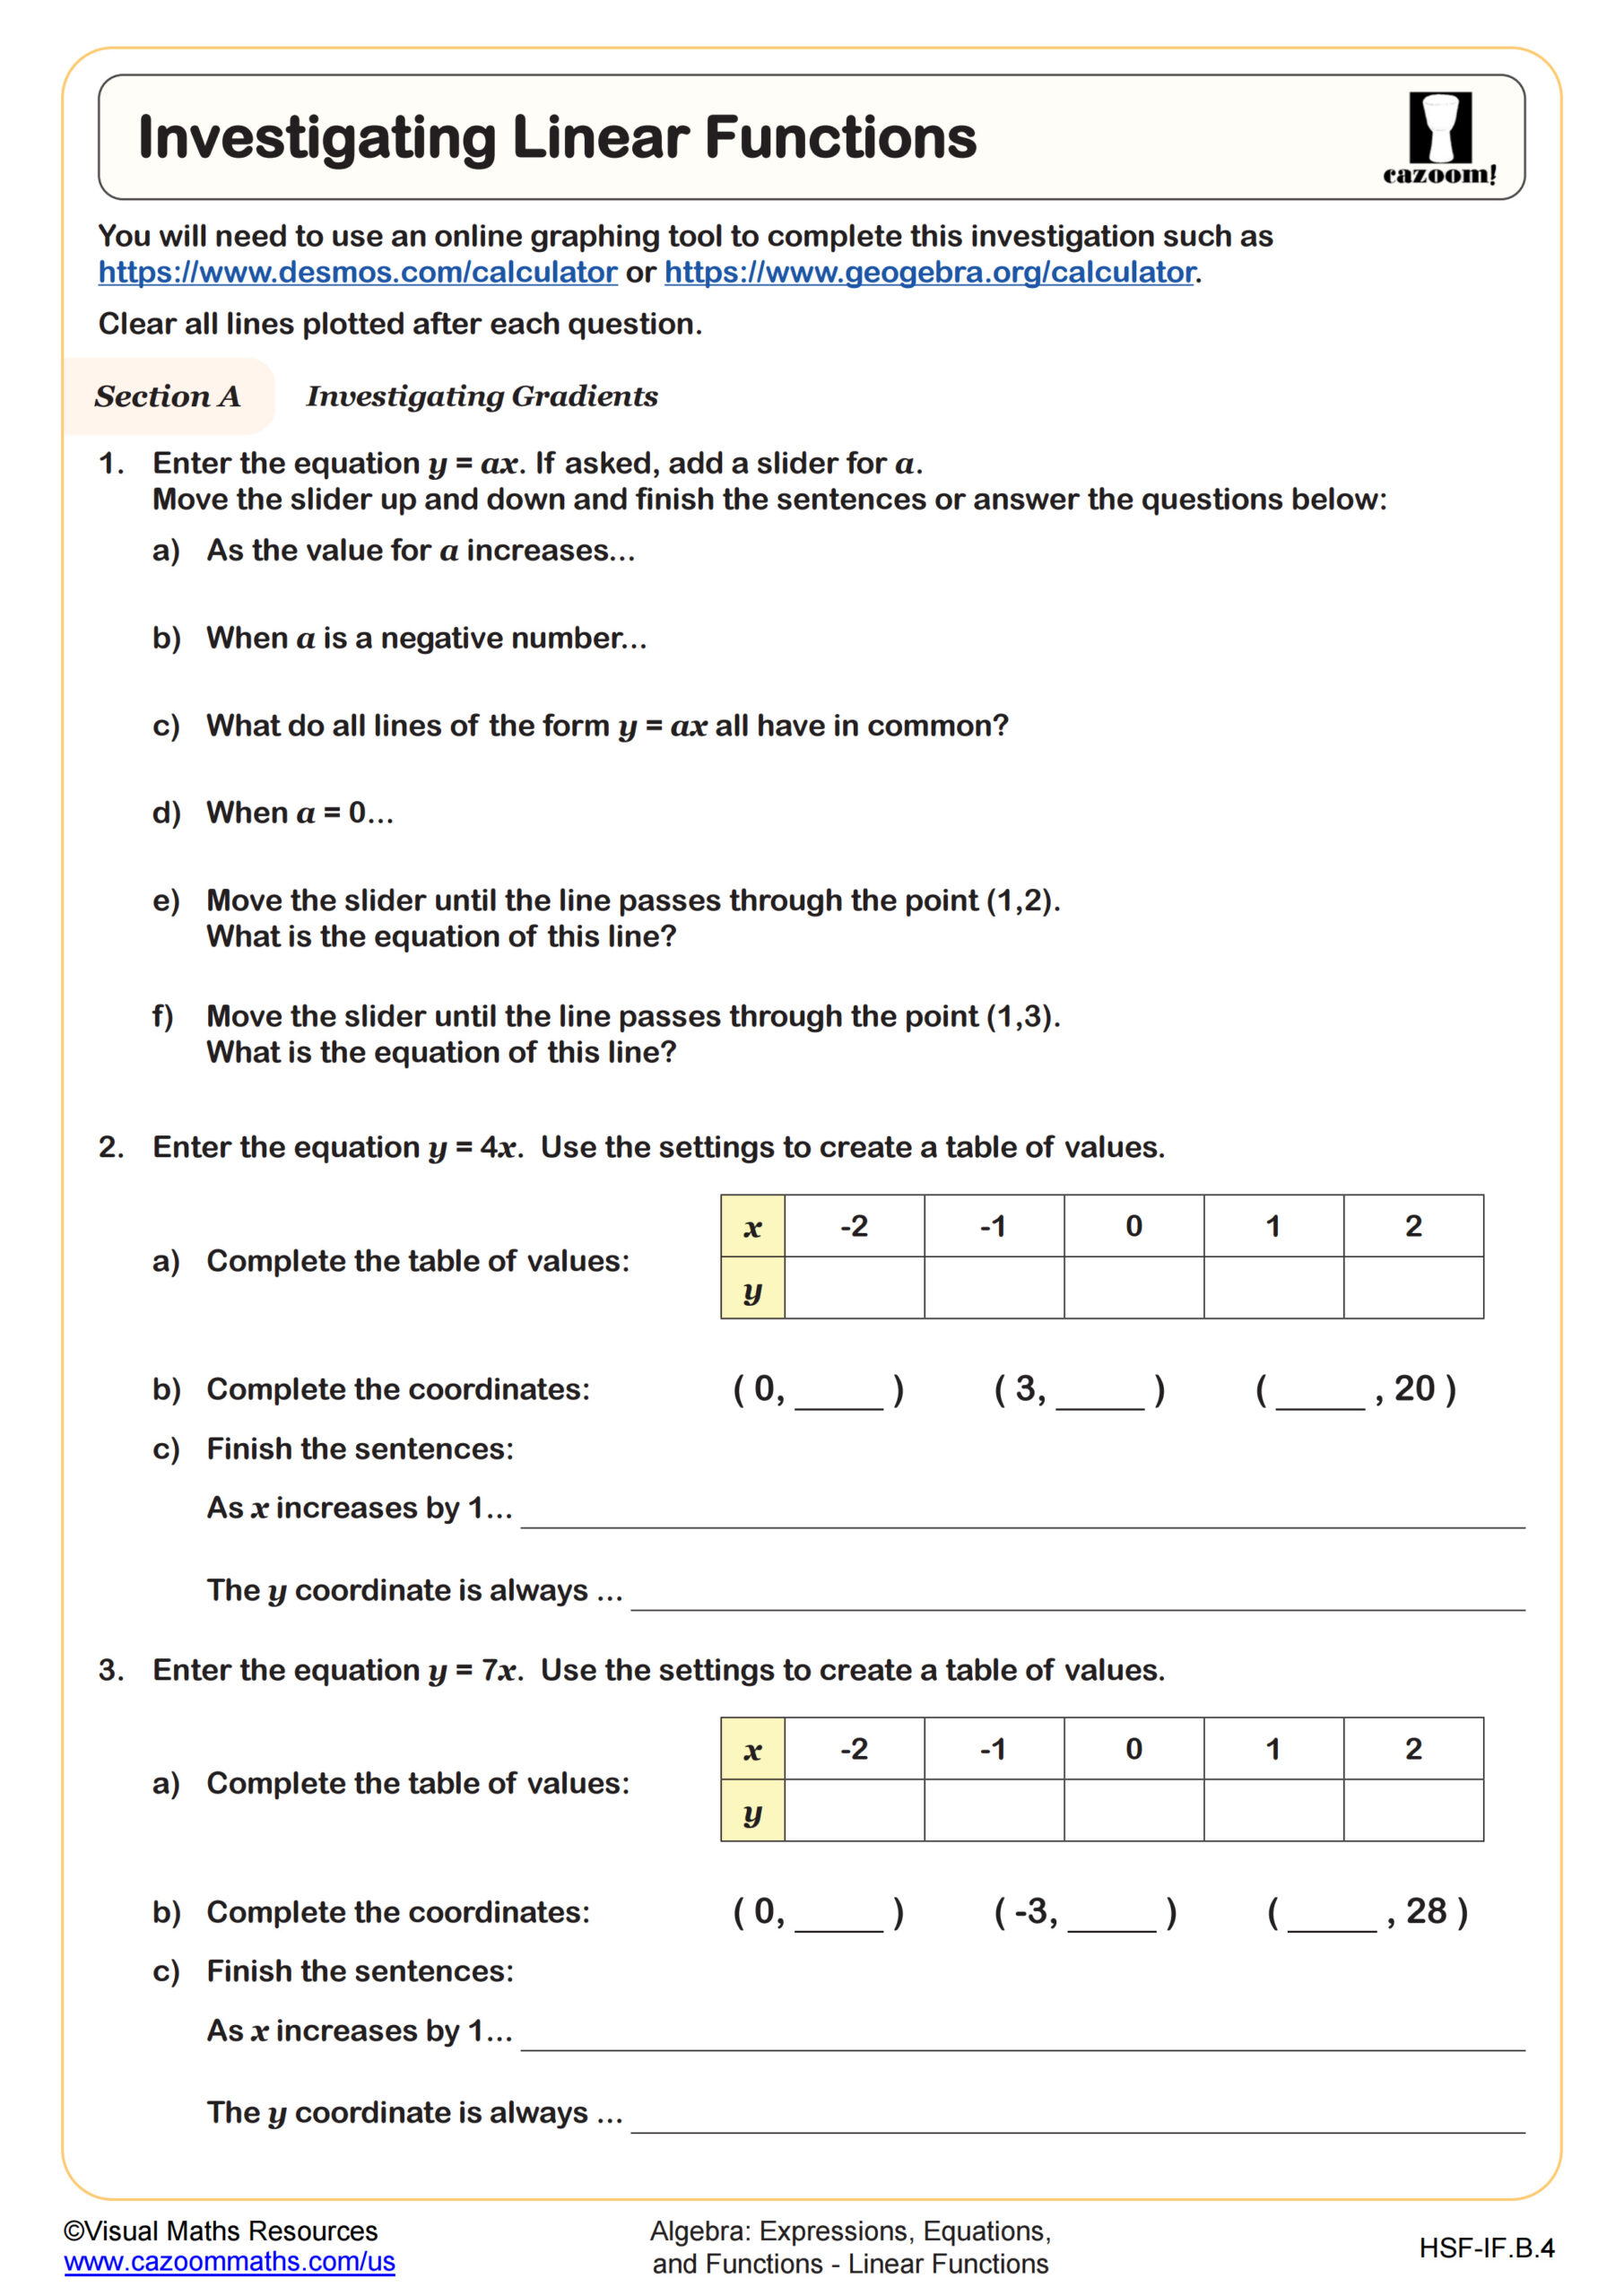
Investigating Linear Functions
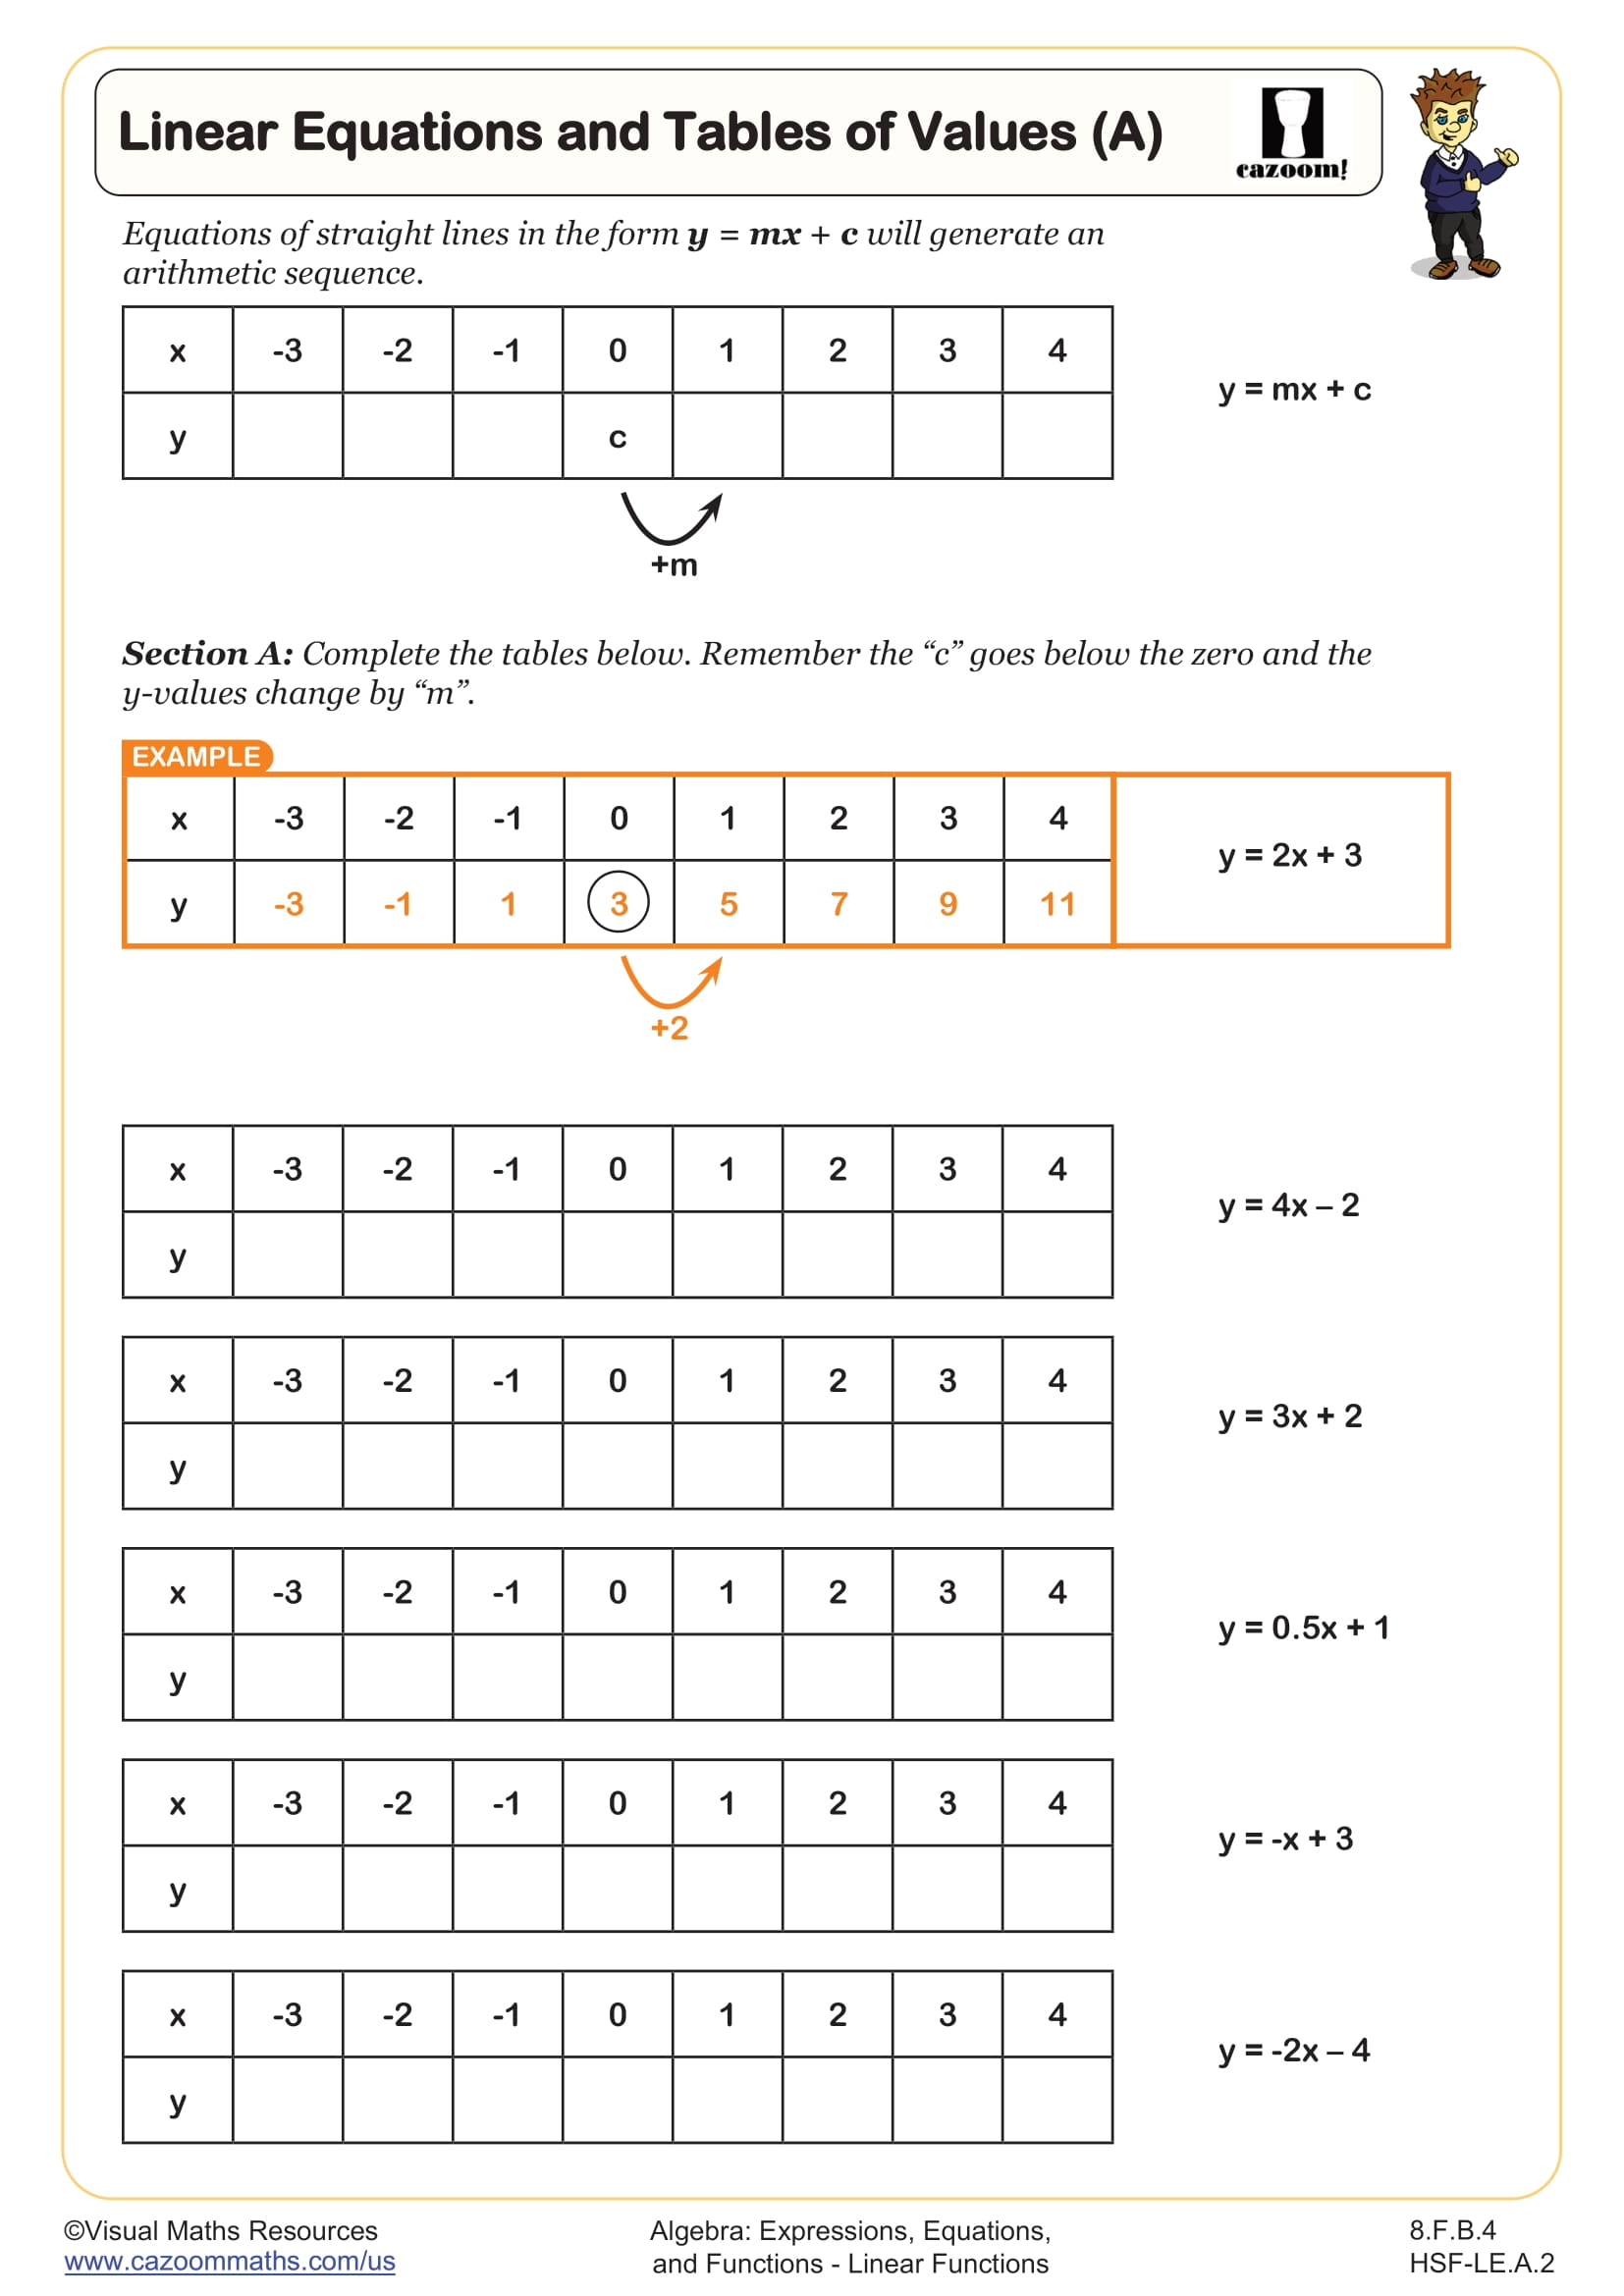
Linear Equations and Tables of Values (A)
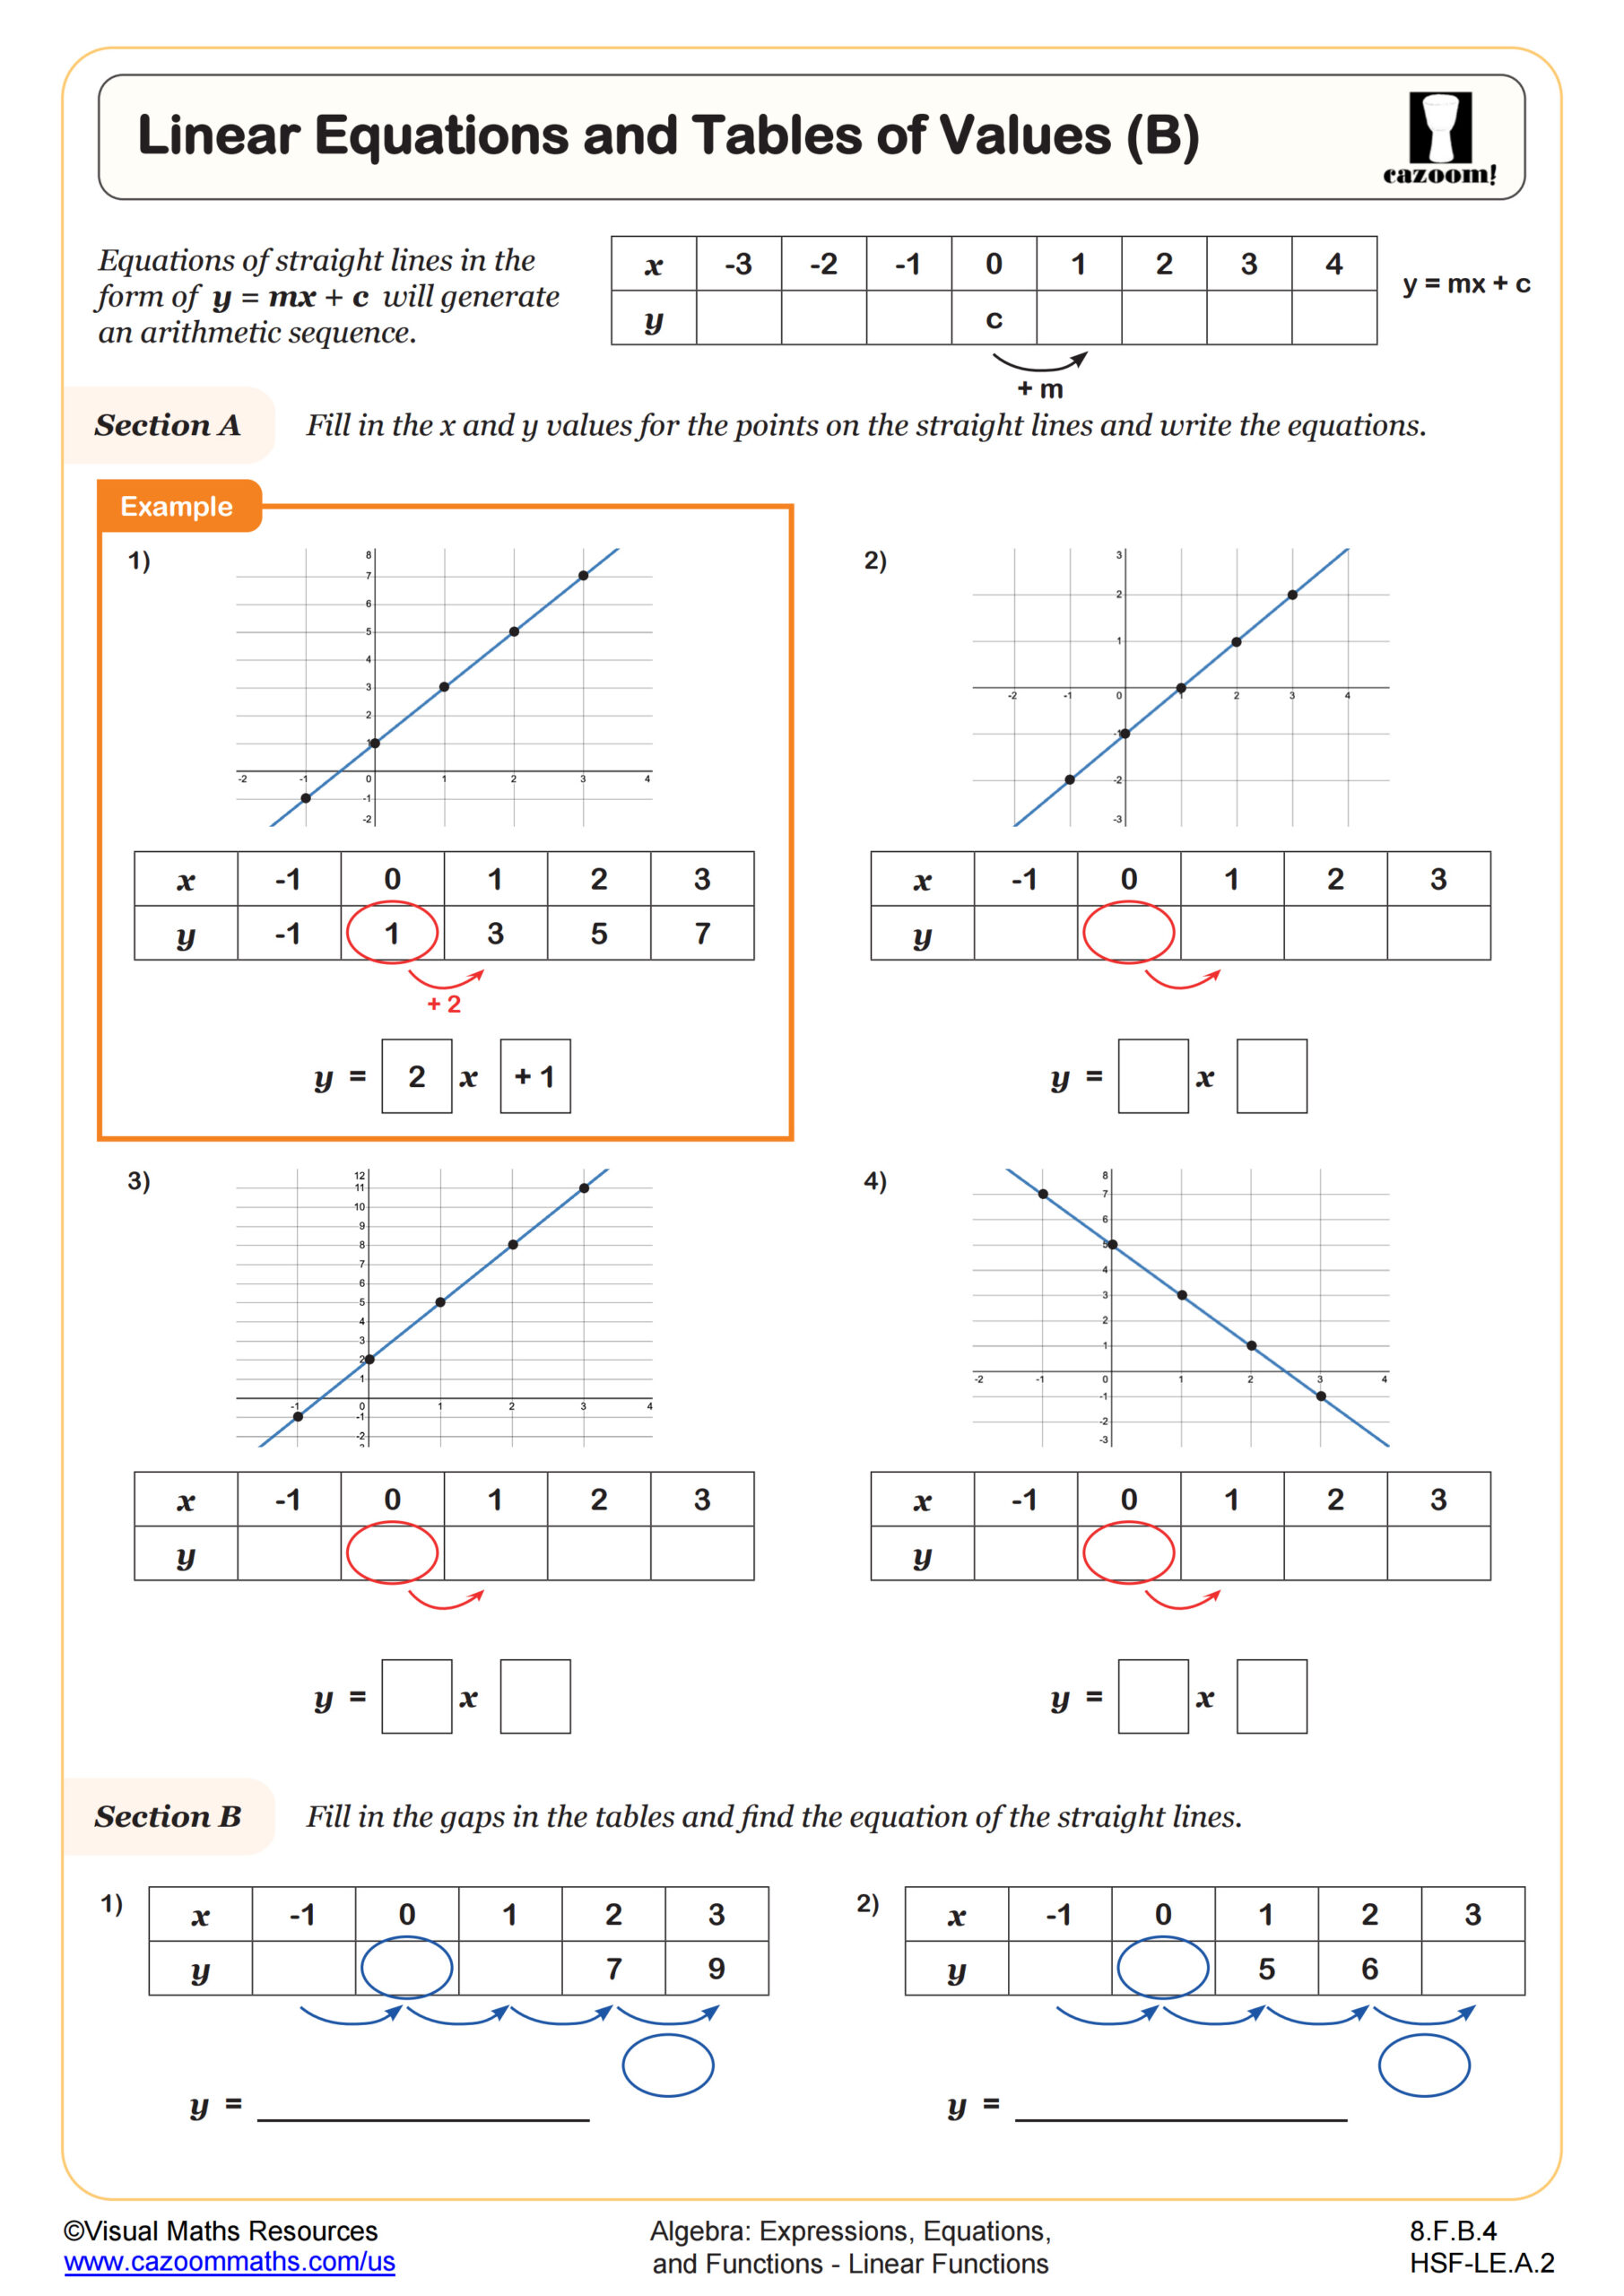
Linear Equations and Tables of Values (B)
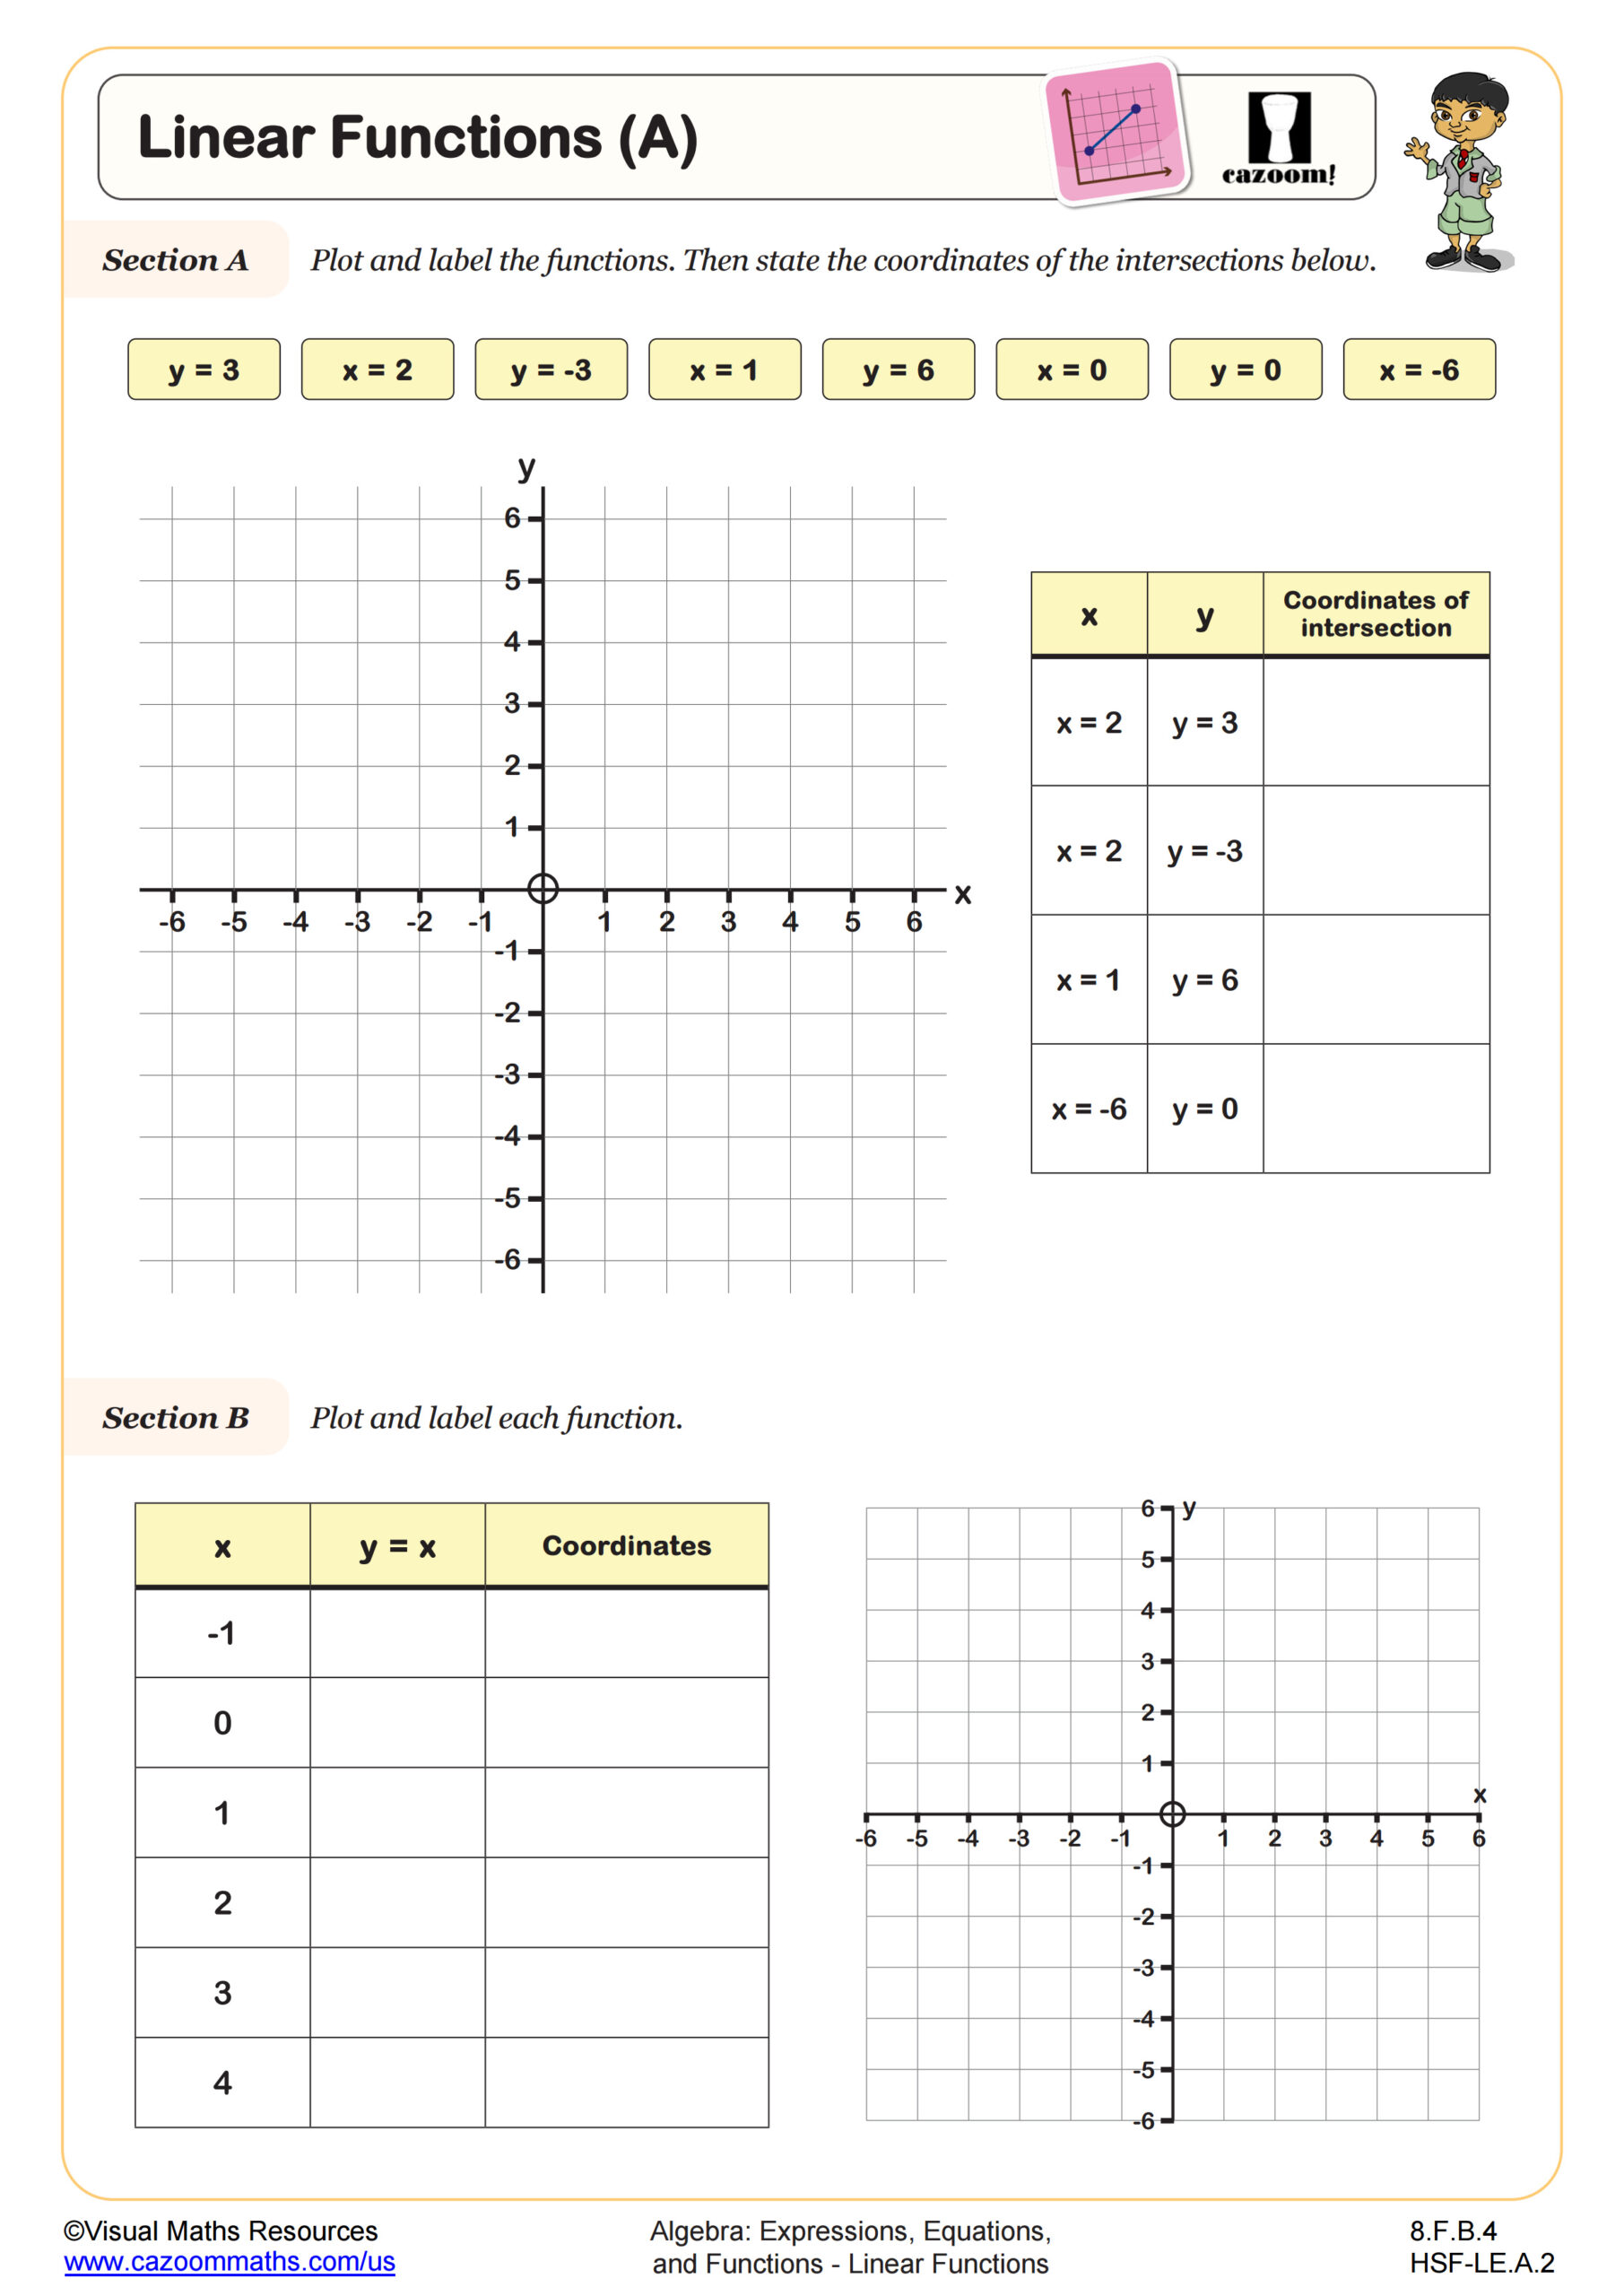
Linear Functions (A)
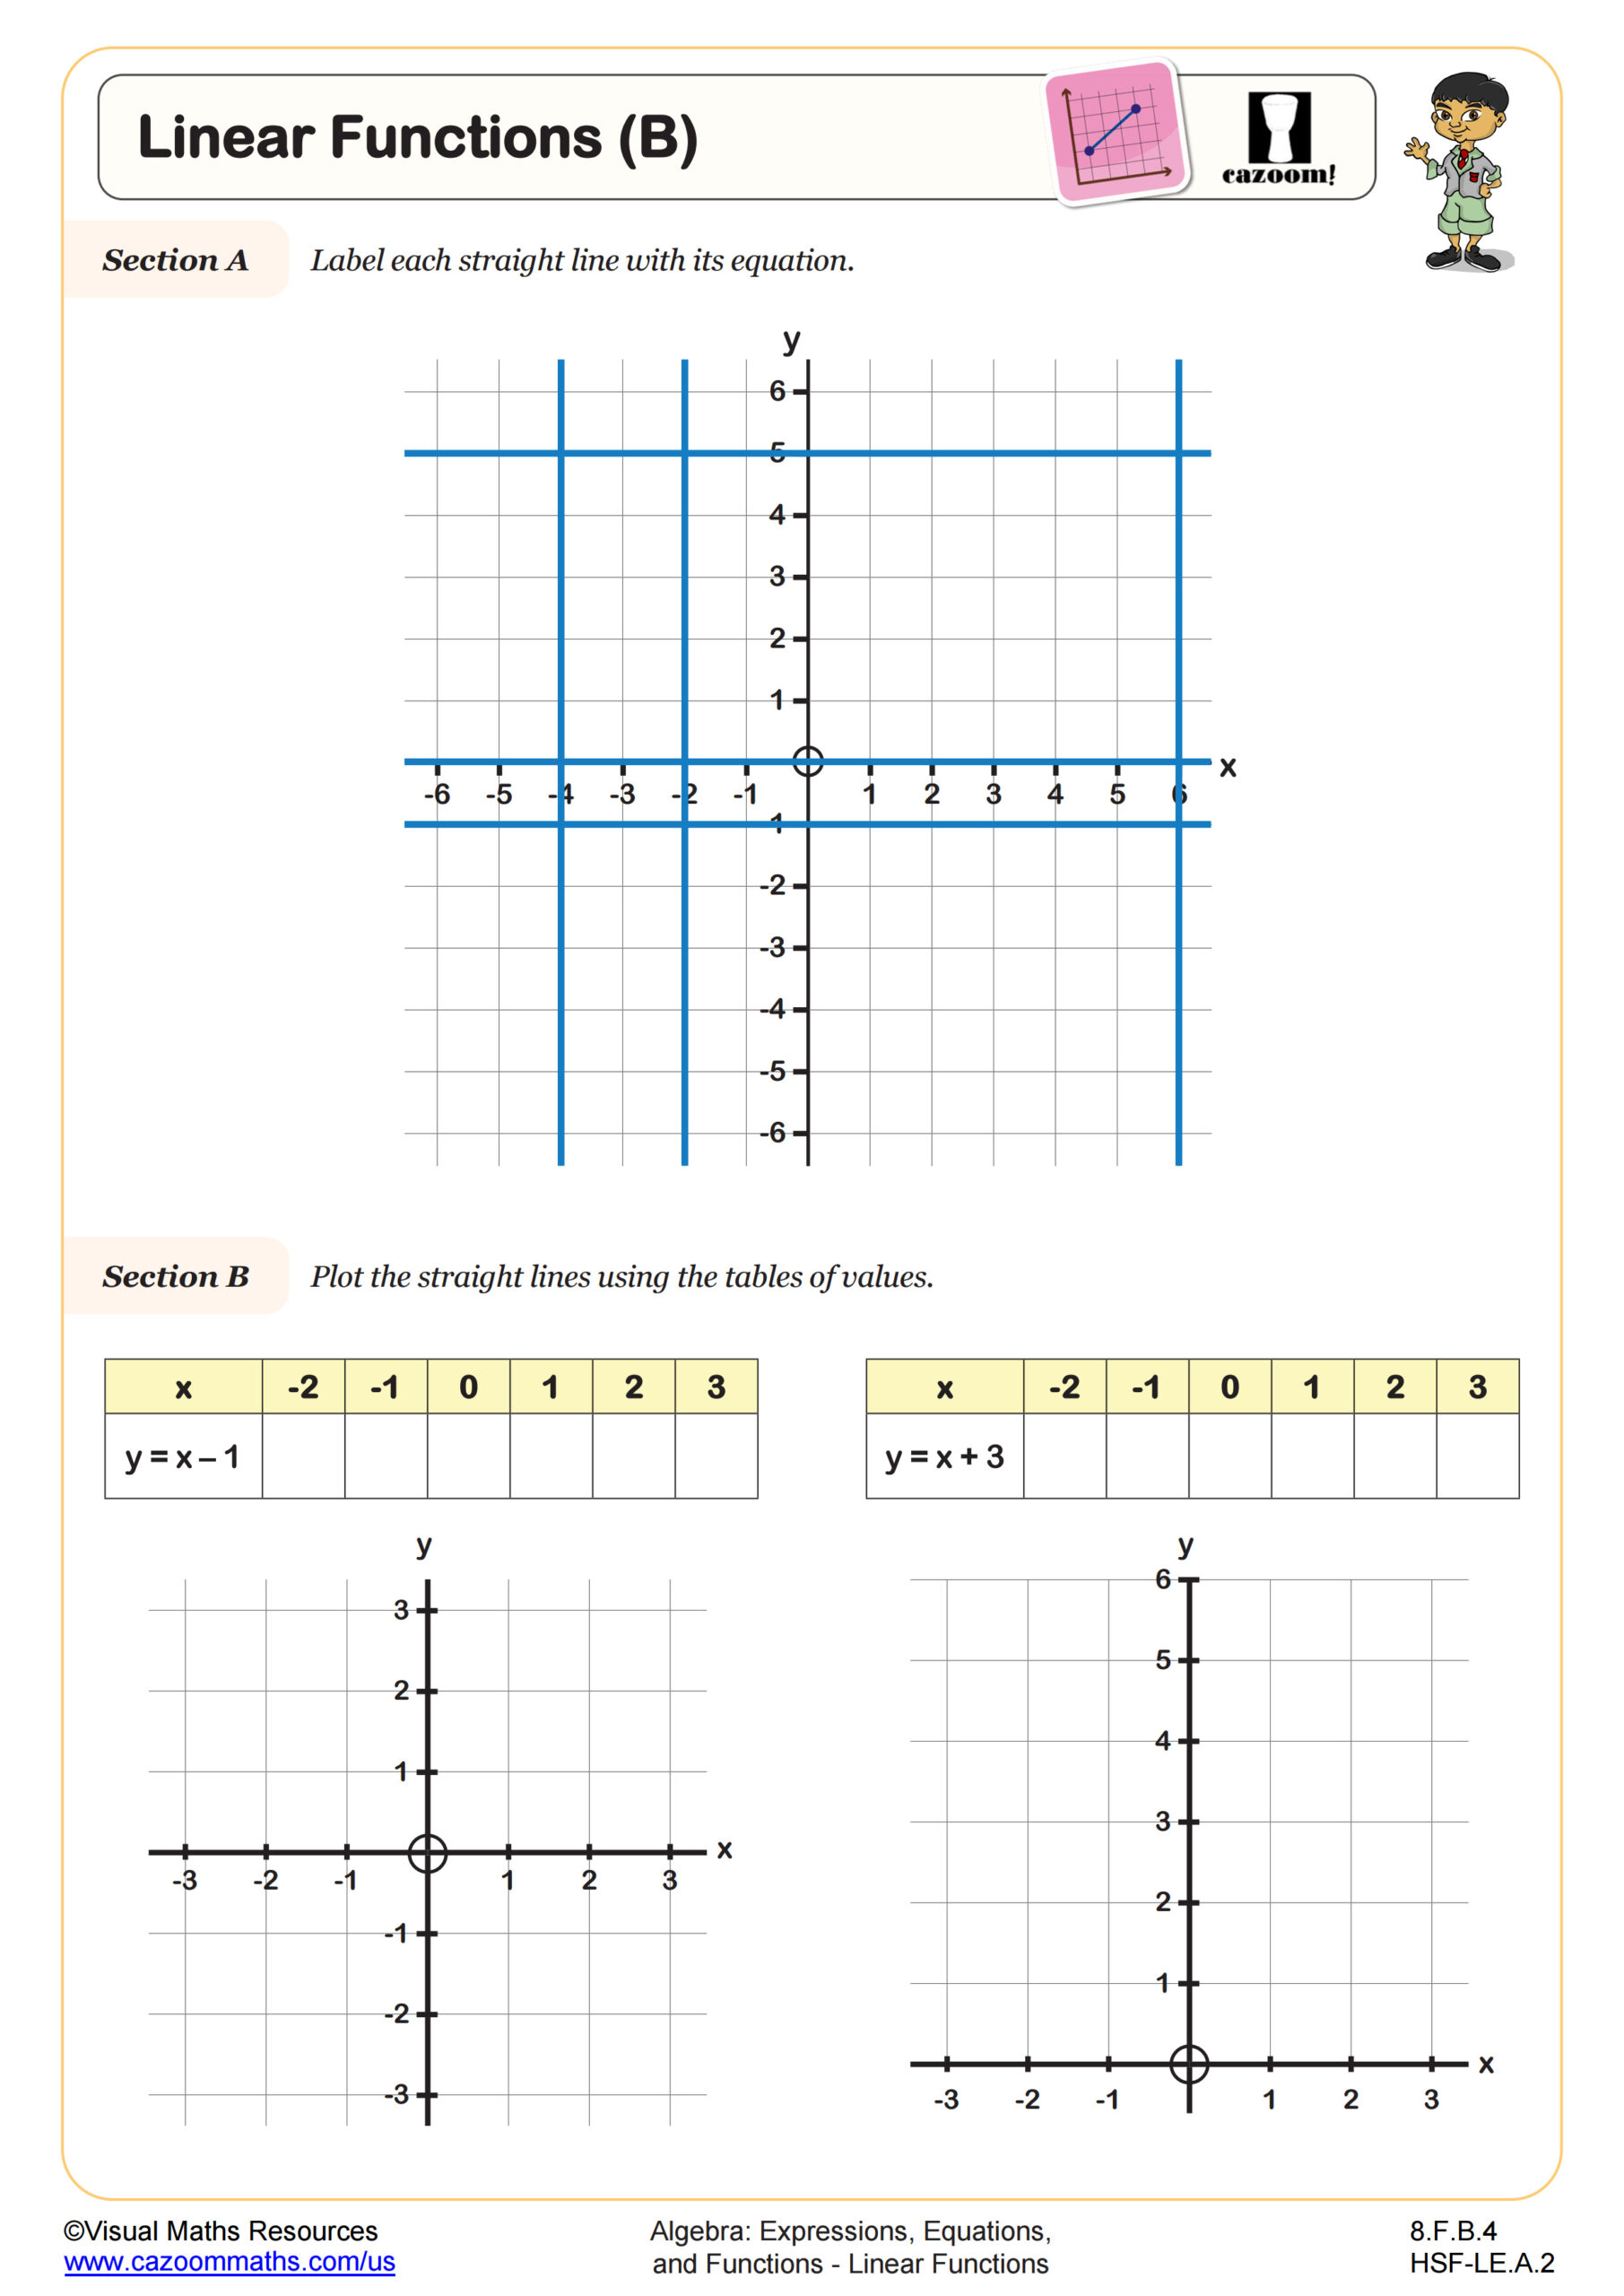
Linear Functions (B)
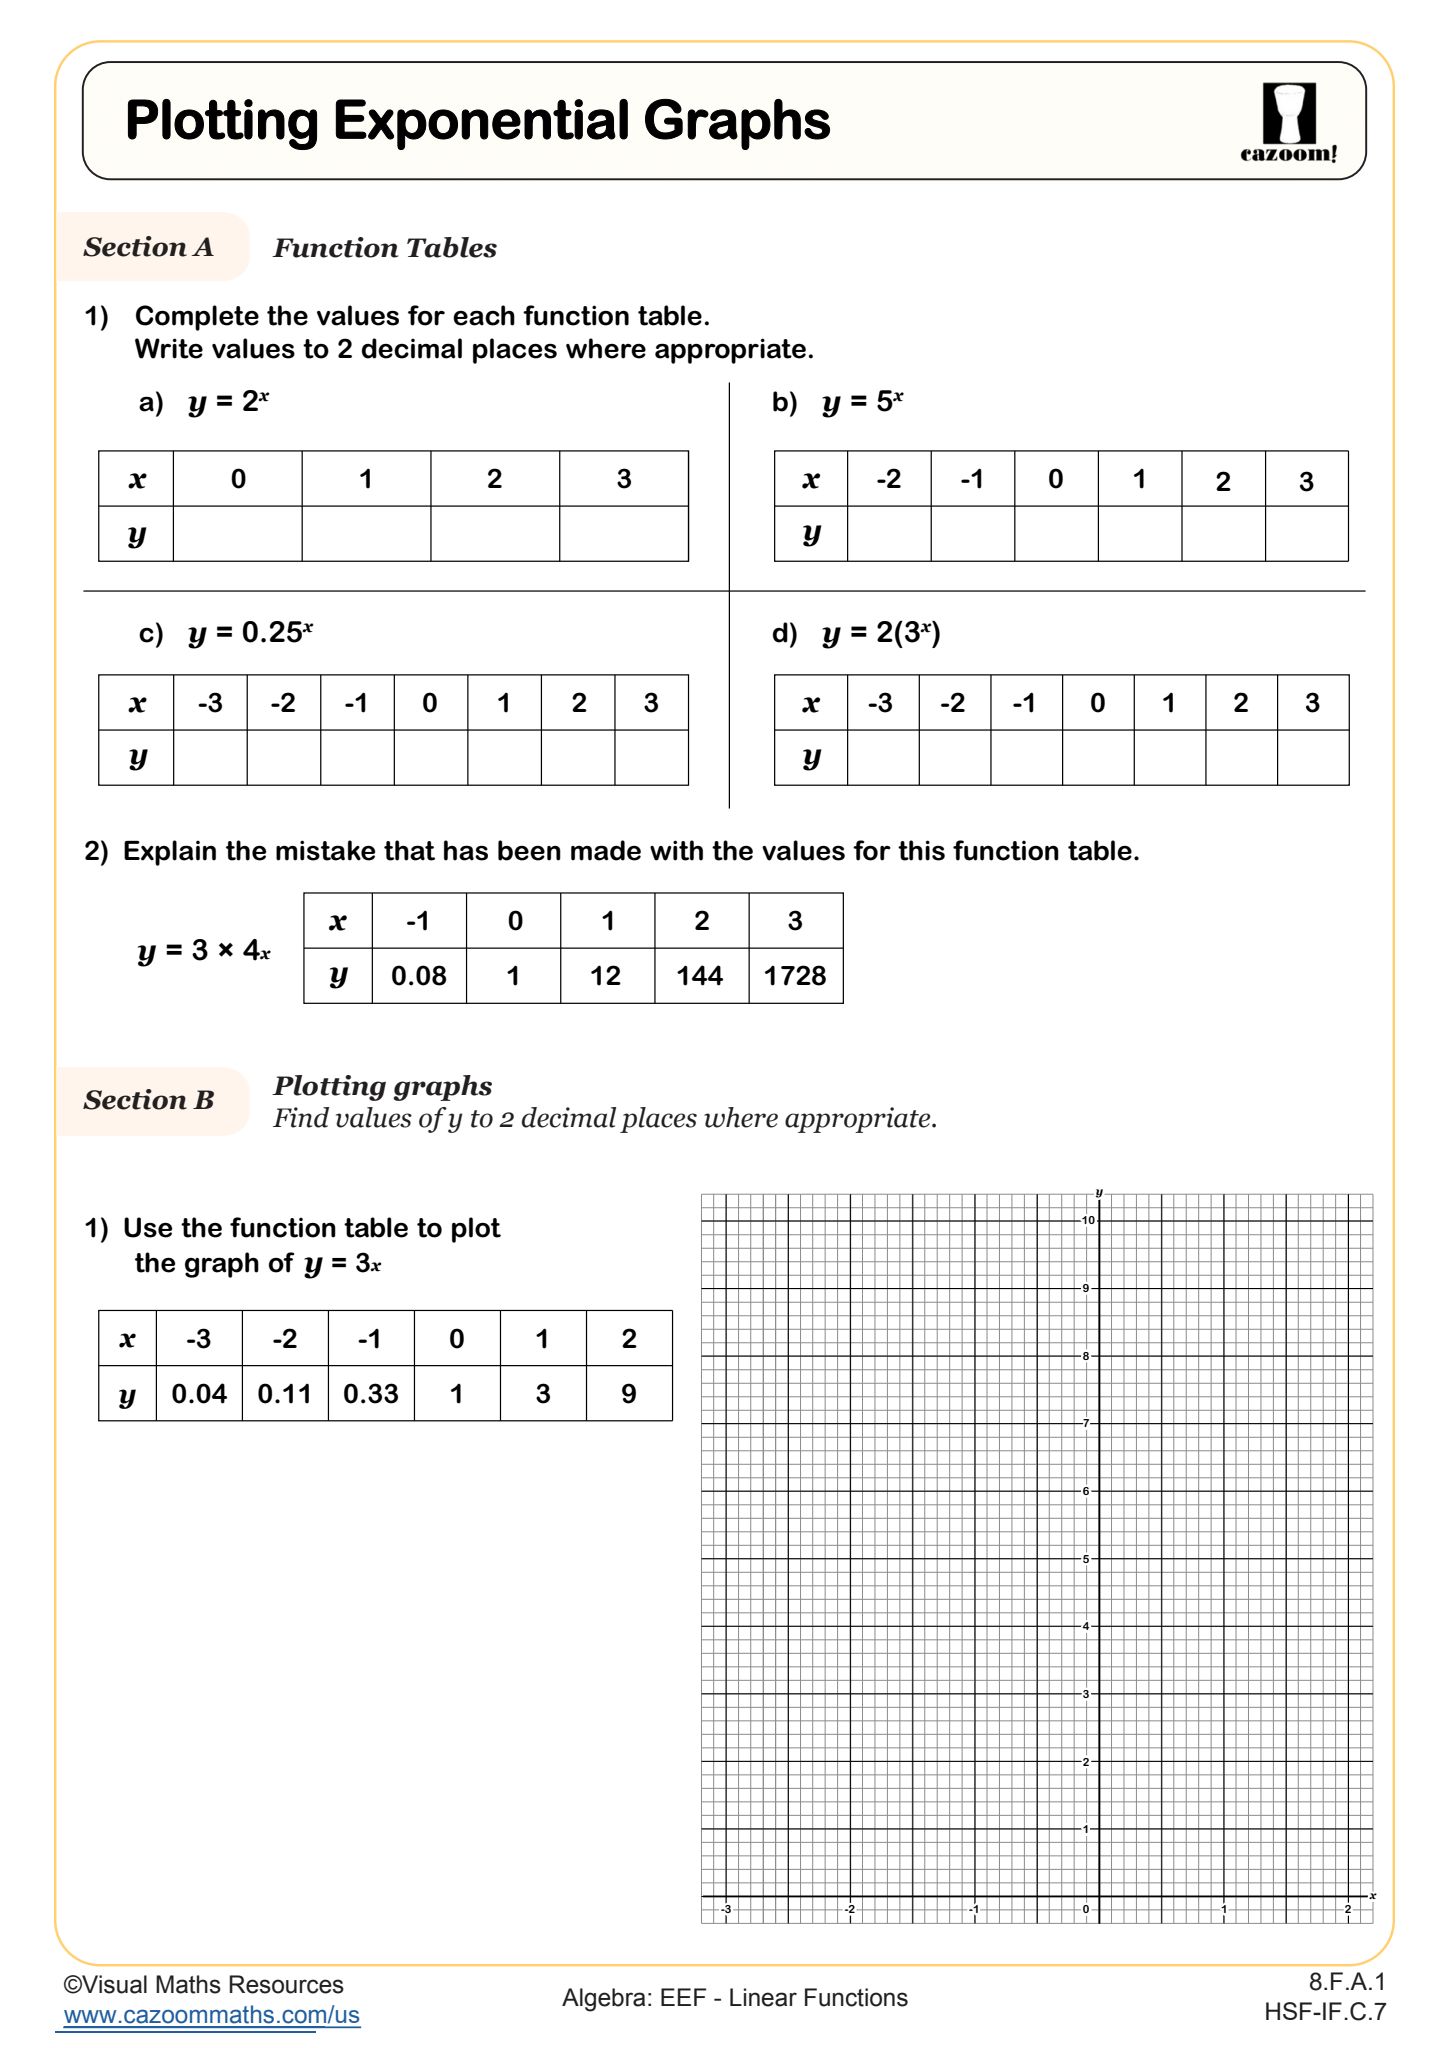
Plotting Exponential Graphs
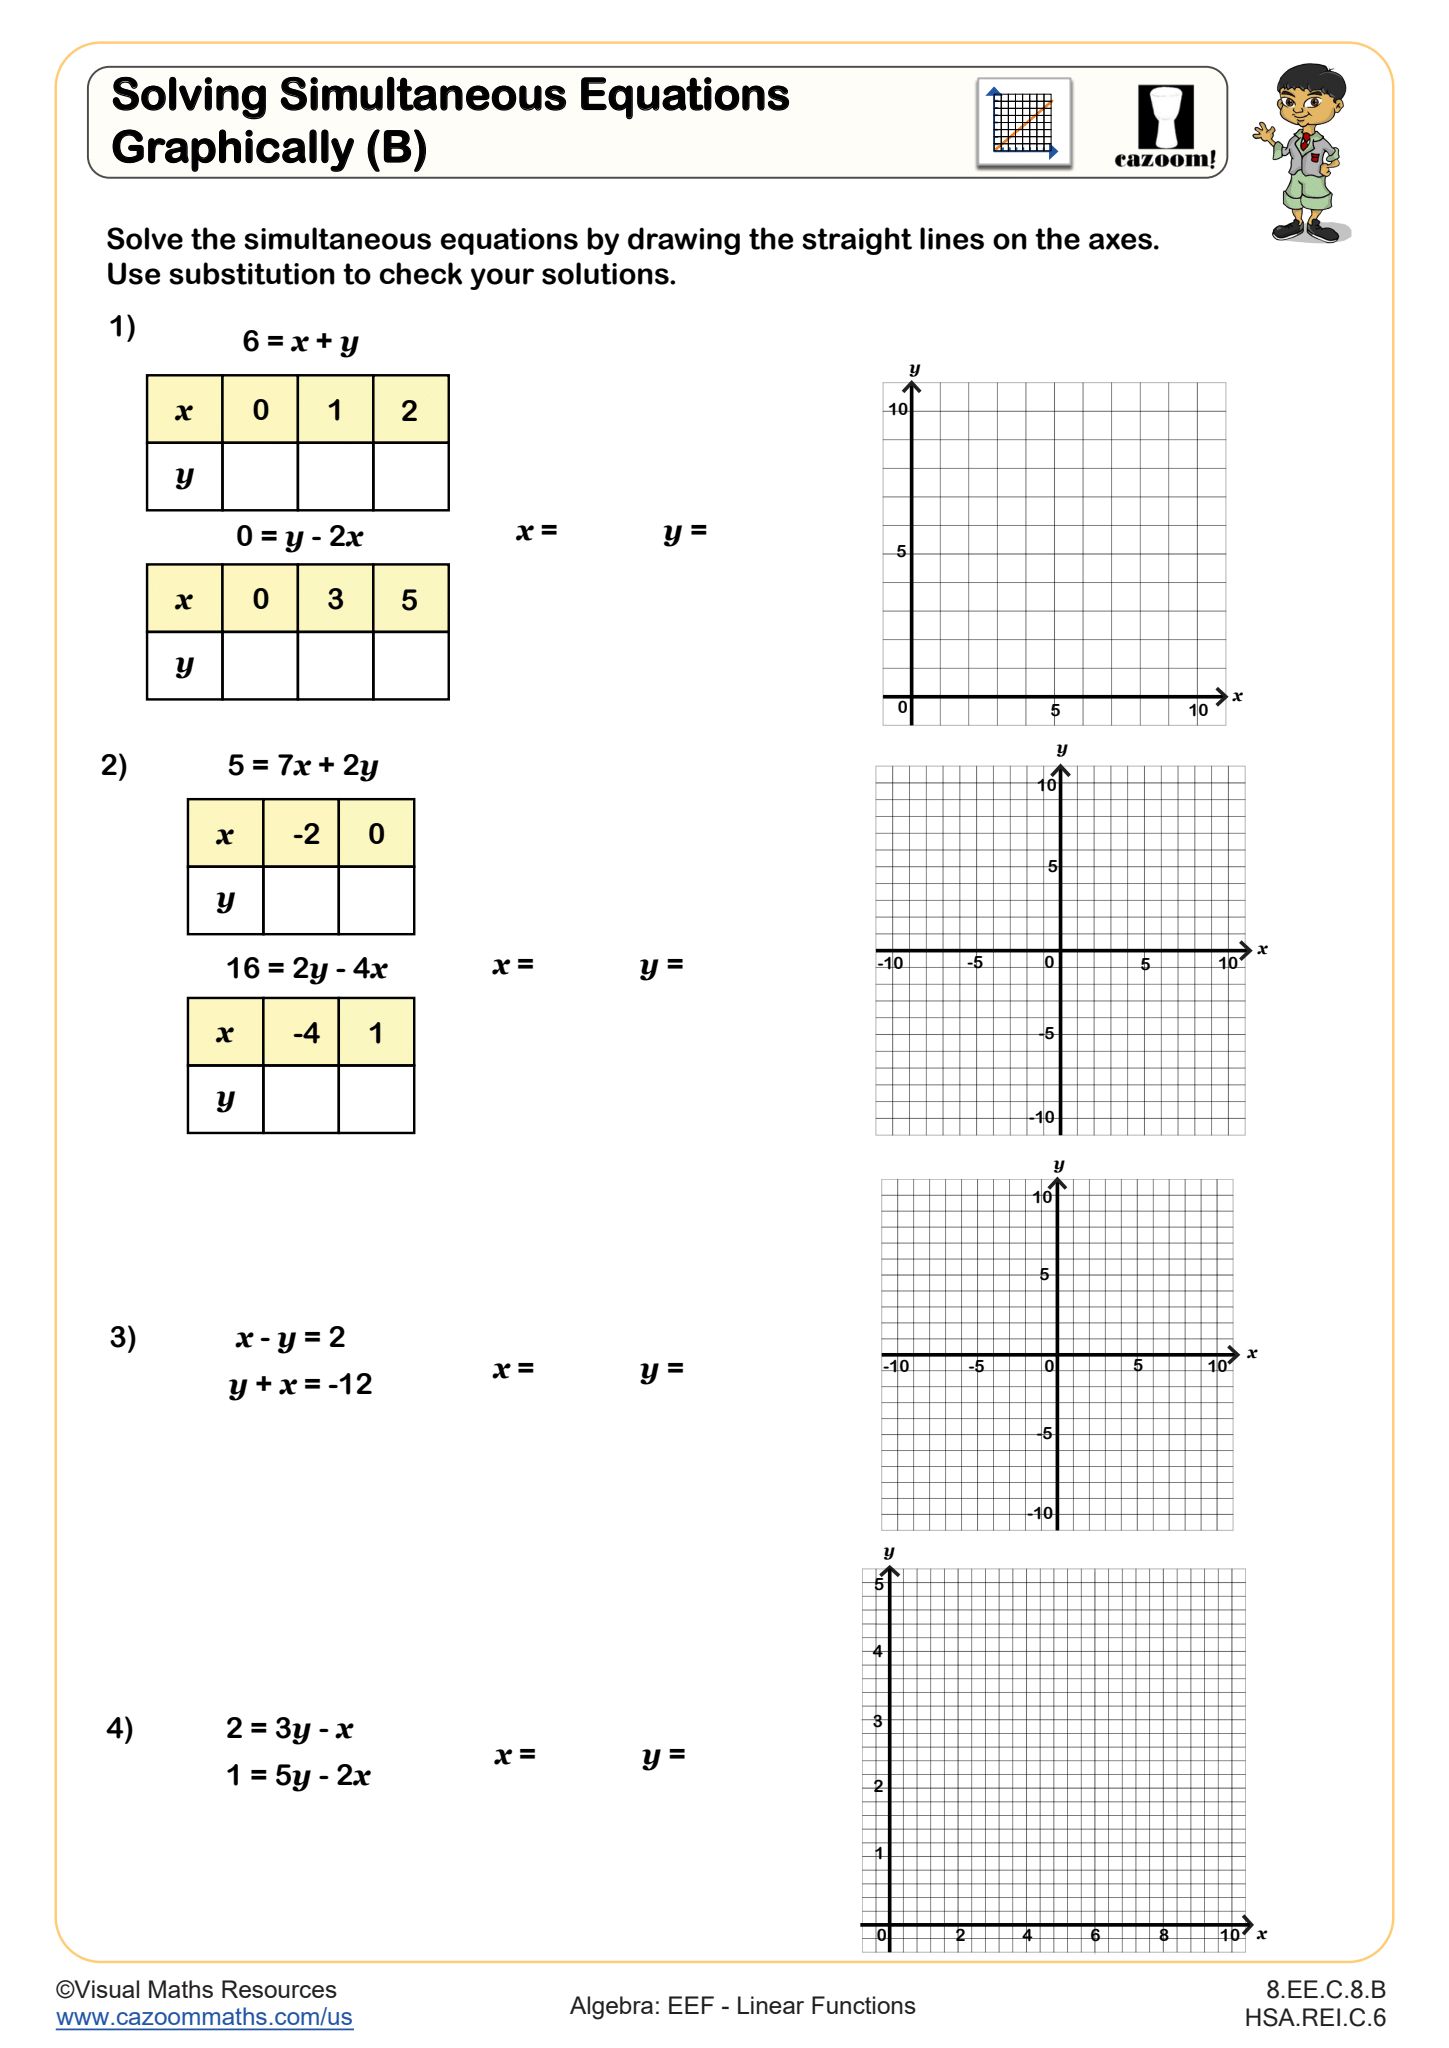
Solving Simultaneous Equations Graphically (B)
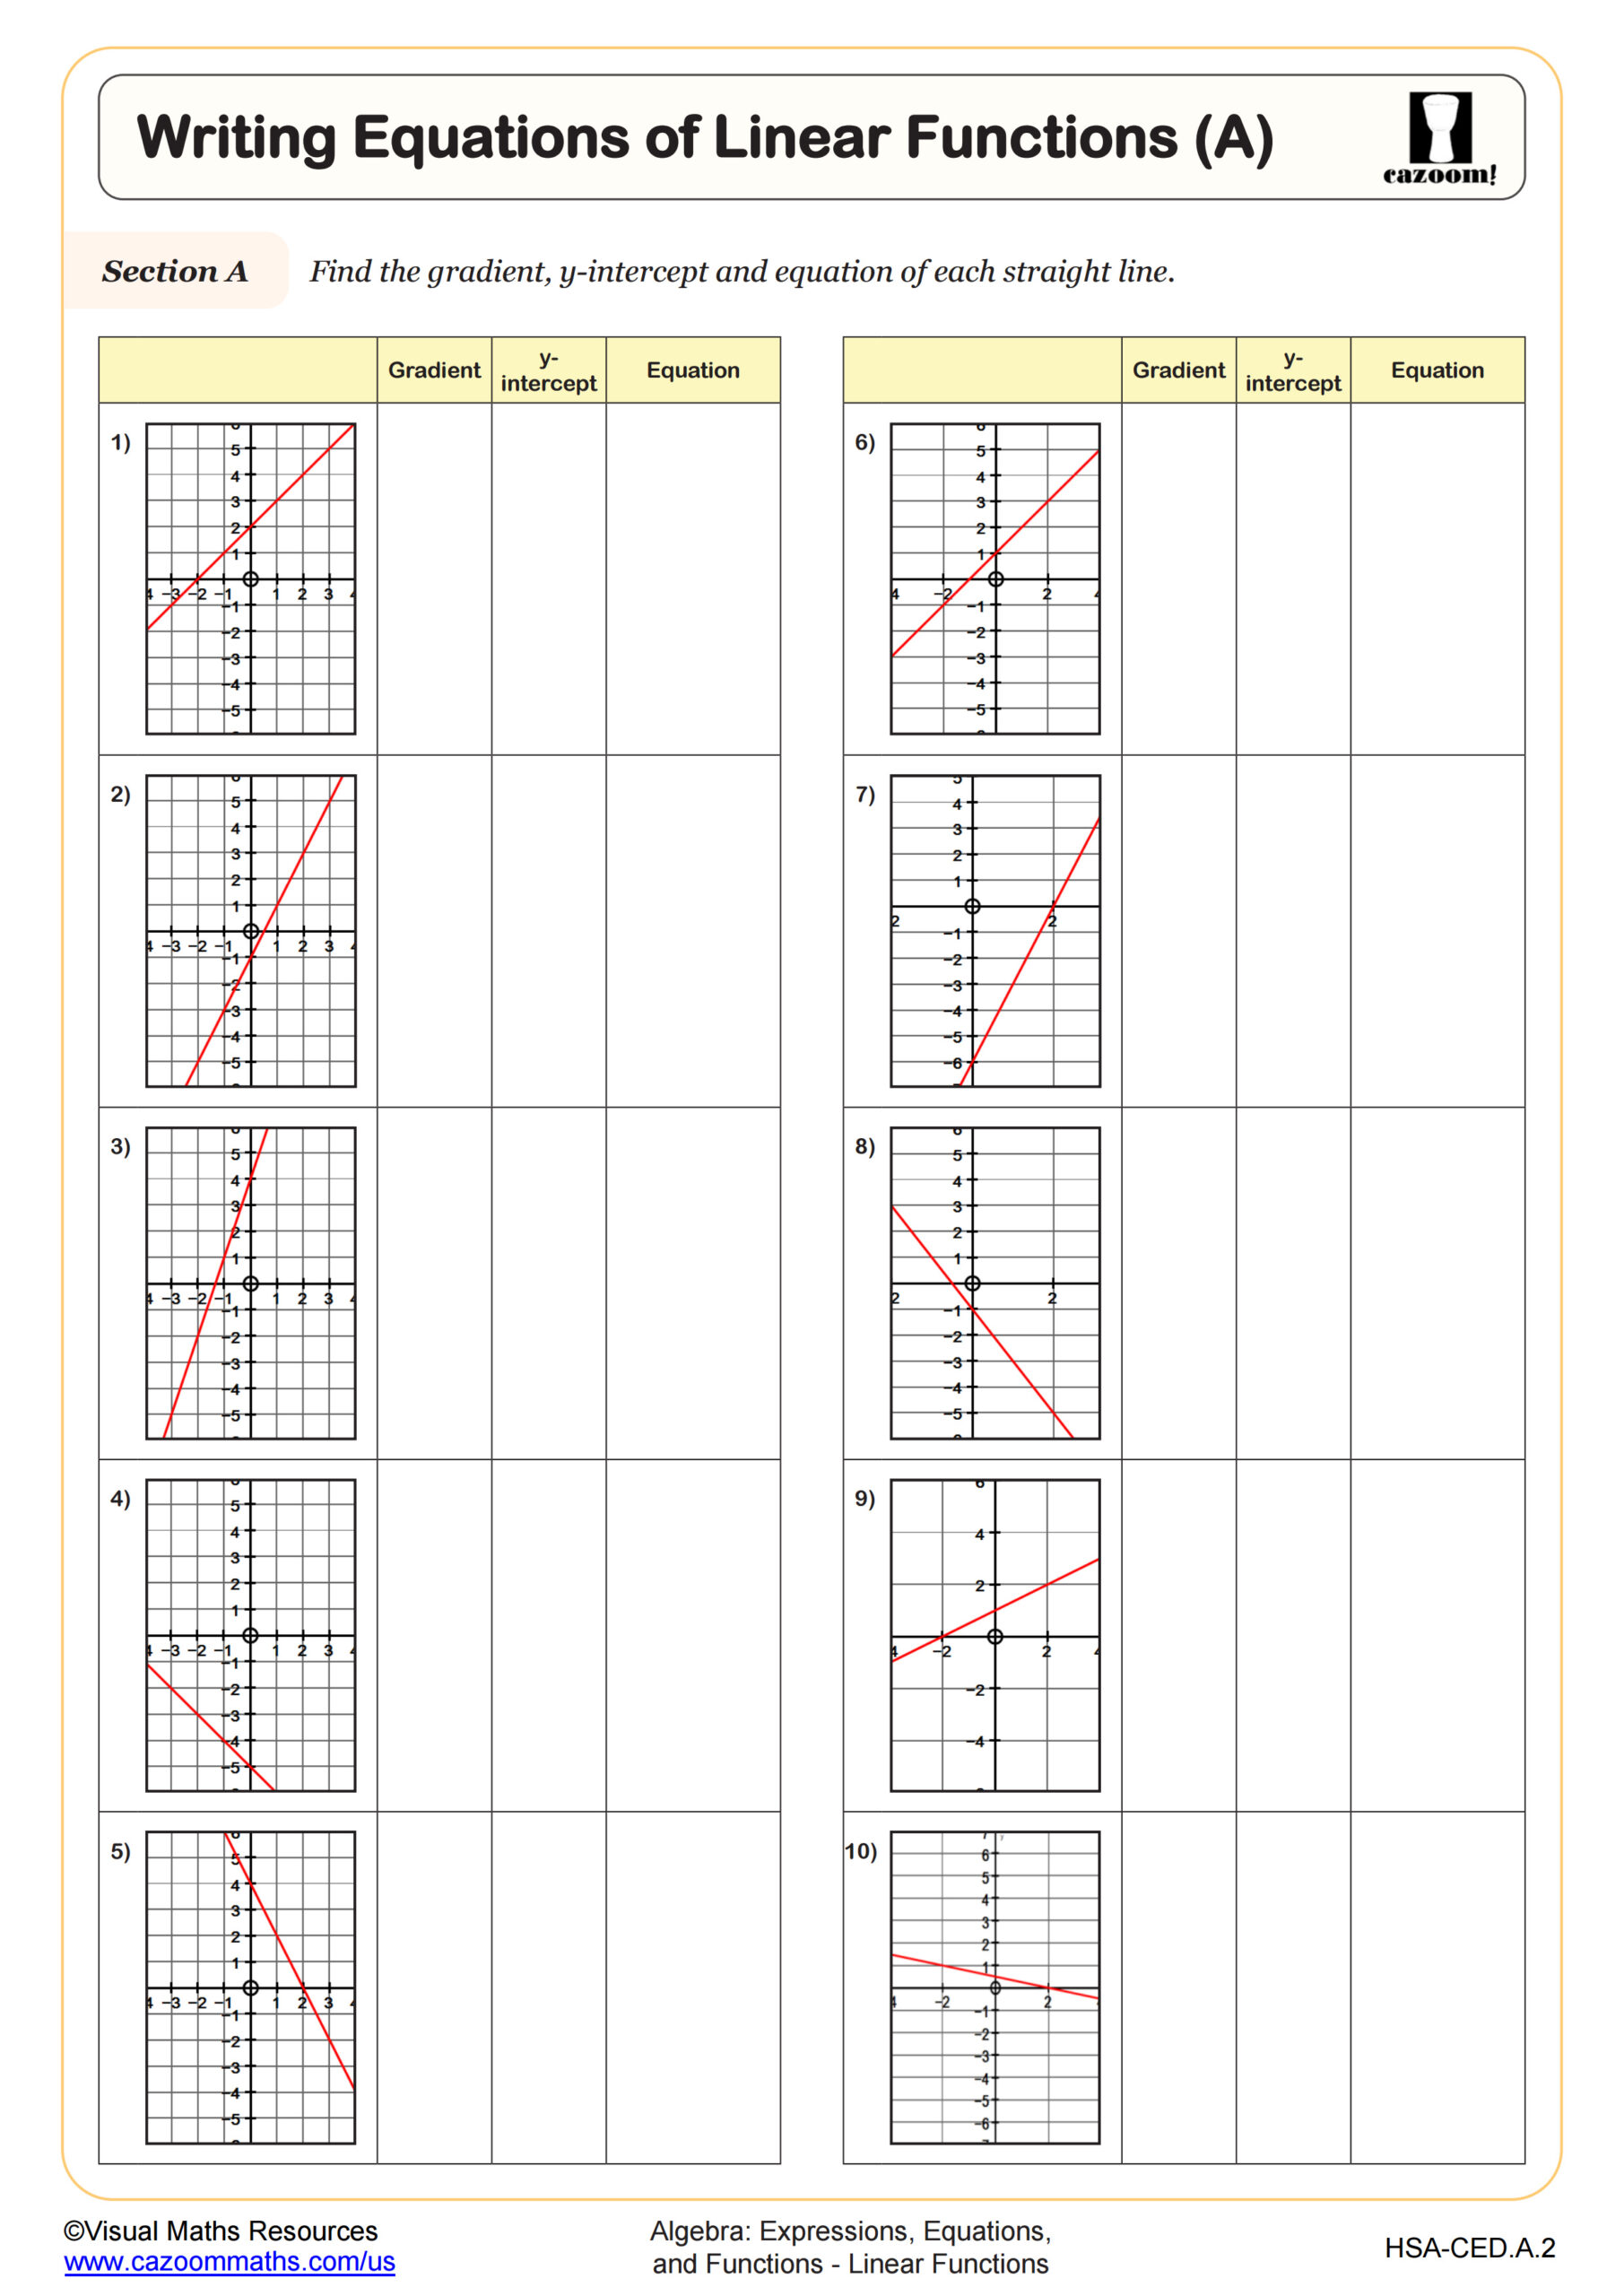
Writing Equations of Linear Functions (A)
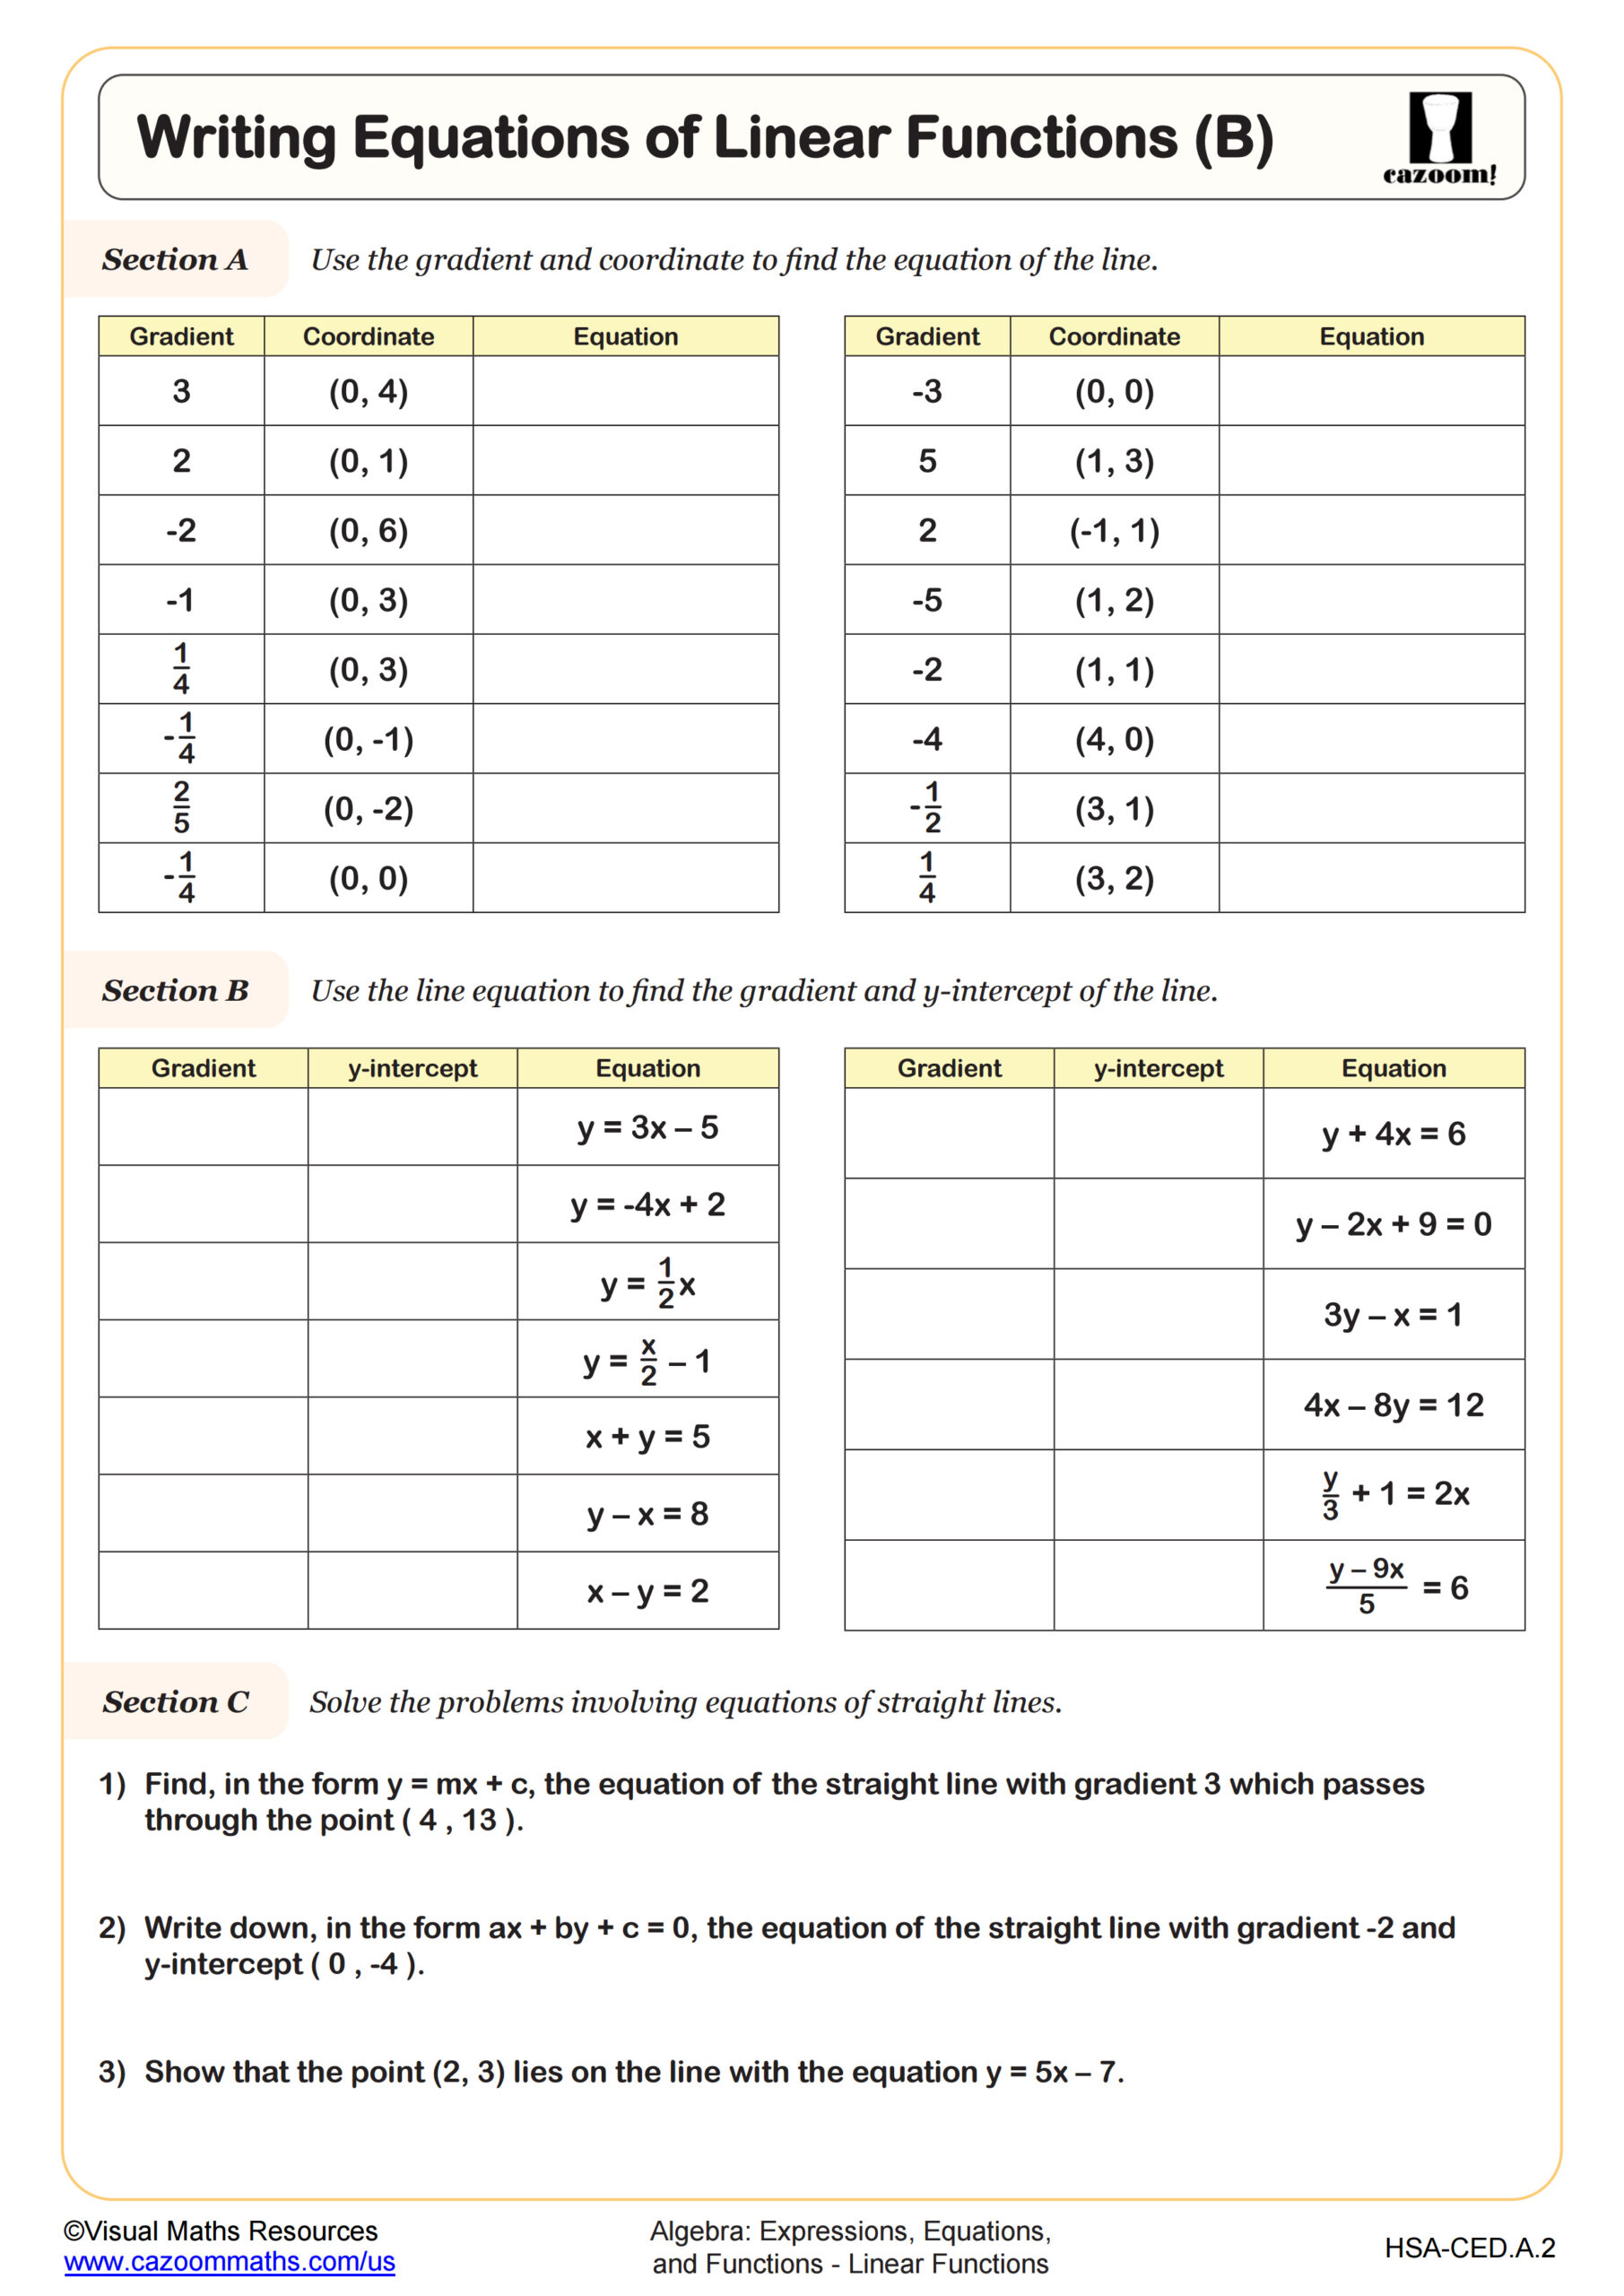
Writing Equations of Linear Functions (B)
All worksheets are created by the team of experienced teachers at Cazoom Math.
What Are Linear Functions and Why Do Students Study Them?
Linear functions represent relationships where the rate of change remains constant, expressed in the form y = mx + b or f(x) = mx + b. Students study these functions throughout high school because they model countless real-world situations, from calculating distance over time to understanding pricing structures. Linear functions also serve as the gateway to understanding all other function types, establishing vocabulary and graphing skills that transfer to quadratic, exponential, and trigonometric functions.
A common misconception occurs when students confuse the coefficient m with the y-intercept, particularly when working with equations in standard form (Ax + By = C). Students lose points on assessments when they graph a line correctly but mislabel which value represents slope versus intercept. Many teachers find that having students verbally state "the slope is..." and "the y-intercept is..." before graphing significantly reduces this error and builds procedural fluency.
Which Grade Levels Use Linear Functions Worksheets?
These linear functions worksheets support high school mathematics across Algebra I, Algebra II, Geometry, Precalculus, and the Integrated Math sequence (IM 1, IM 2, and IM 3). Students typically encounter linear functions formally in Algebra I or IM 1, where they learn fundamental graphing and equation-solving techniques. The topic reappears in Geometry when analyzing slopes of parallel and perpendicular lines, and in Precalculus when studying piecewise and transformational functions.
The progression across grade levels shifts from procedural fluency to conceptual depth. Algebra I students focus on graphing techniques and identifying slope and intercept, while Algebra II students work with systems of linear equations and applications. By Precalculus, students analyze linear functions within families of functions, examining transformations and domain restrictions. This spiraling approach ensures students see linear relationships as both a standalone topic and a tool for understanding more complex mathematical concepts throughout their high school career.
How Do Coordinate Grids Support Function Understanding?
Coordinate grids with all four quadrants allow students to visualize how linear functions behave across positive and negative values, making abstract algebraic concepts concrete. Worksheets that provide blank axes give students practice setting up their own scales and choosing appropriate intervals, a skill standardized tests frequently assess. Students develop spatial reasoning by recognizing that lines with positive slopes rise from left to right, while negative slopes fall, and they connect algebraic signs (positive or negative m and b values) directly to graph position.
In engineering and physics, coordinate systems map everything from projectile motion to electrical circuits. Architects use coordinate geometry when drafting building plans, translating measurements into precise visual representations. Students who master coordinate graphing of linear functions gain tools for data visualization careers, where plotting trends and interpreting graphs drives decision-making in fields from epidemiology to market analysis. The ability to move fluently between a table of values, an equation, and a graph becomes foundational for any STEM pathway requiring data interpretation.
How Can Teachers Use These Linear Functions Worksheets Effectively?
These worksheets scaffold learning by offering varied entry points, from blank tables that guide students through organized point-plotting to blank axes that challenge students to determine appropriate scales independently. The progression from structured to open-ended problems allows teachers to differentiate instruction based on student readiness. Answer keys enable students to self-check their work during independent practice, building metacognitive skills as they identify and correct their own errors before misconceptions solidify.
Teachers use these worksheets for targeted intervention when students struggle with specific skills like plotting negative coordinates or calculating slope from two points. They work well as warm-up activities to maintain graphing fluency or as homework that reinforces classroom lessons without requiring extensive teacher prep time. Paired work proves particularly effective, with one student reading coordinates while their partner plots, then switching roles to build communication skills alongside mathematical understanding. The consistent format across worksheets helps students focus on mathematical thinking rather than decoding new instructions with each practice session.