High School Mean Median Mode Worksheets
All worksheets are created by the team of experienced teachers at Cazoom Math.
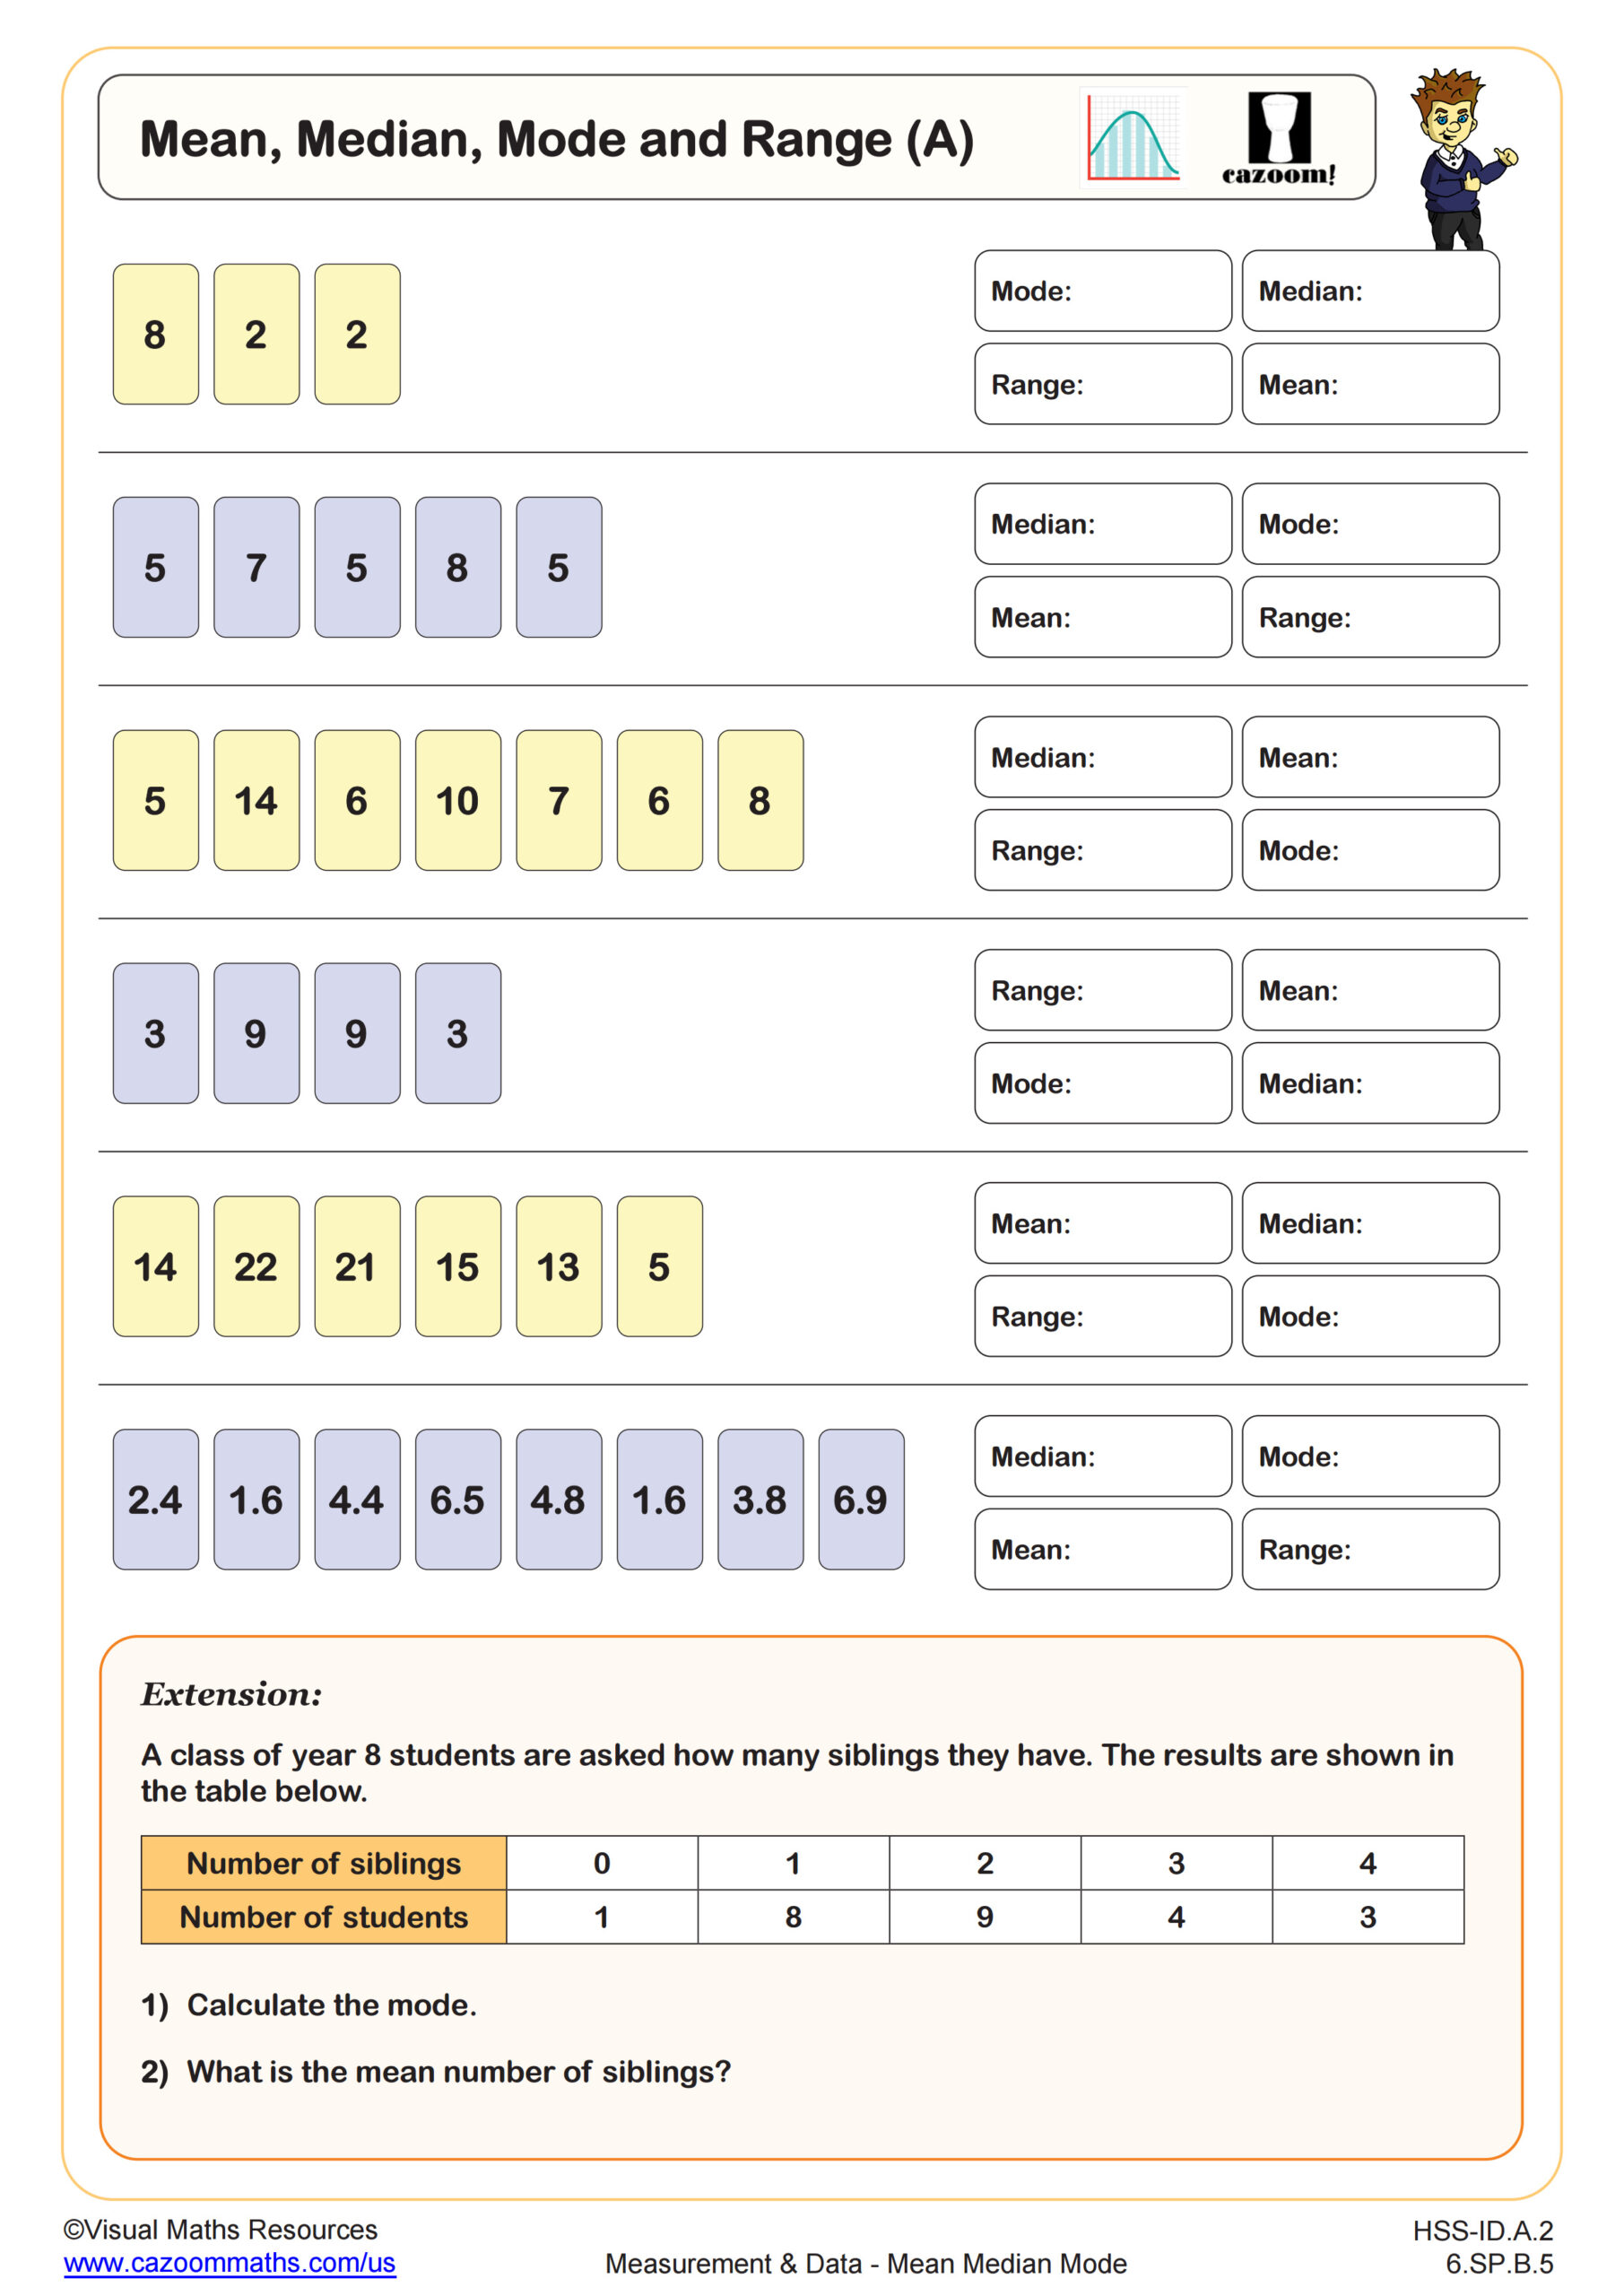
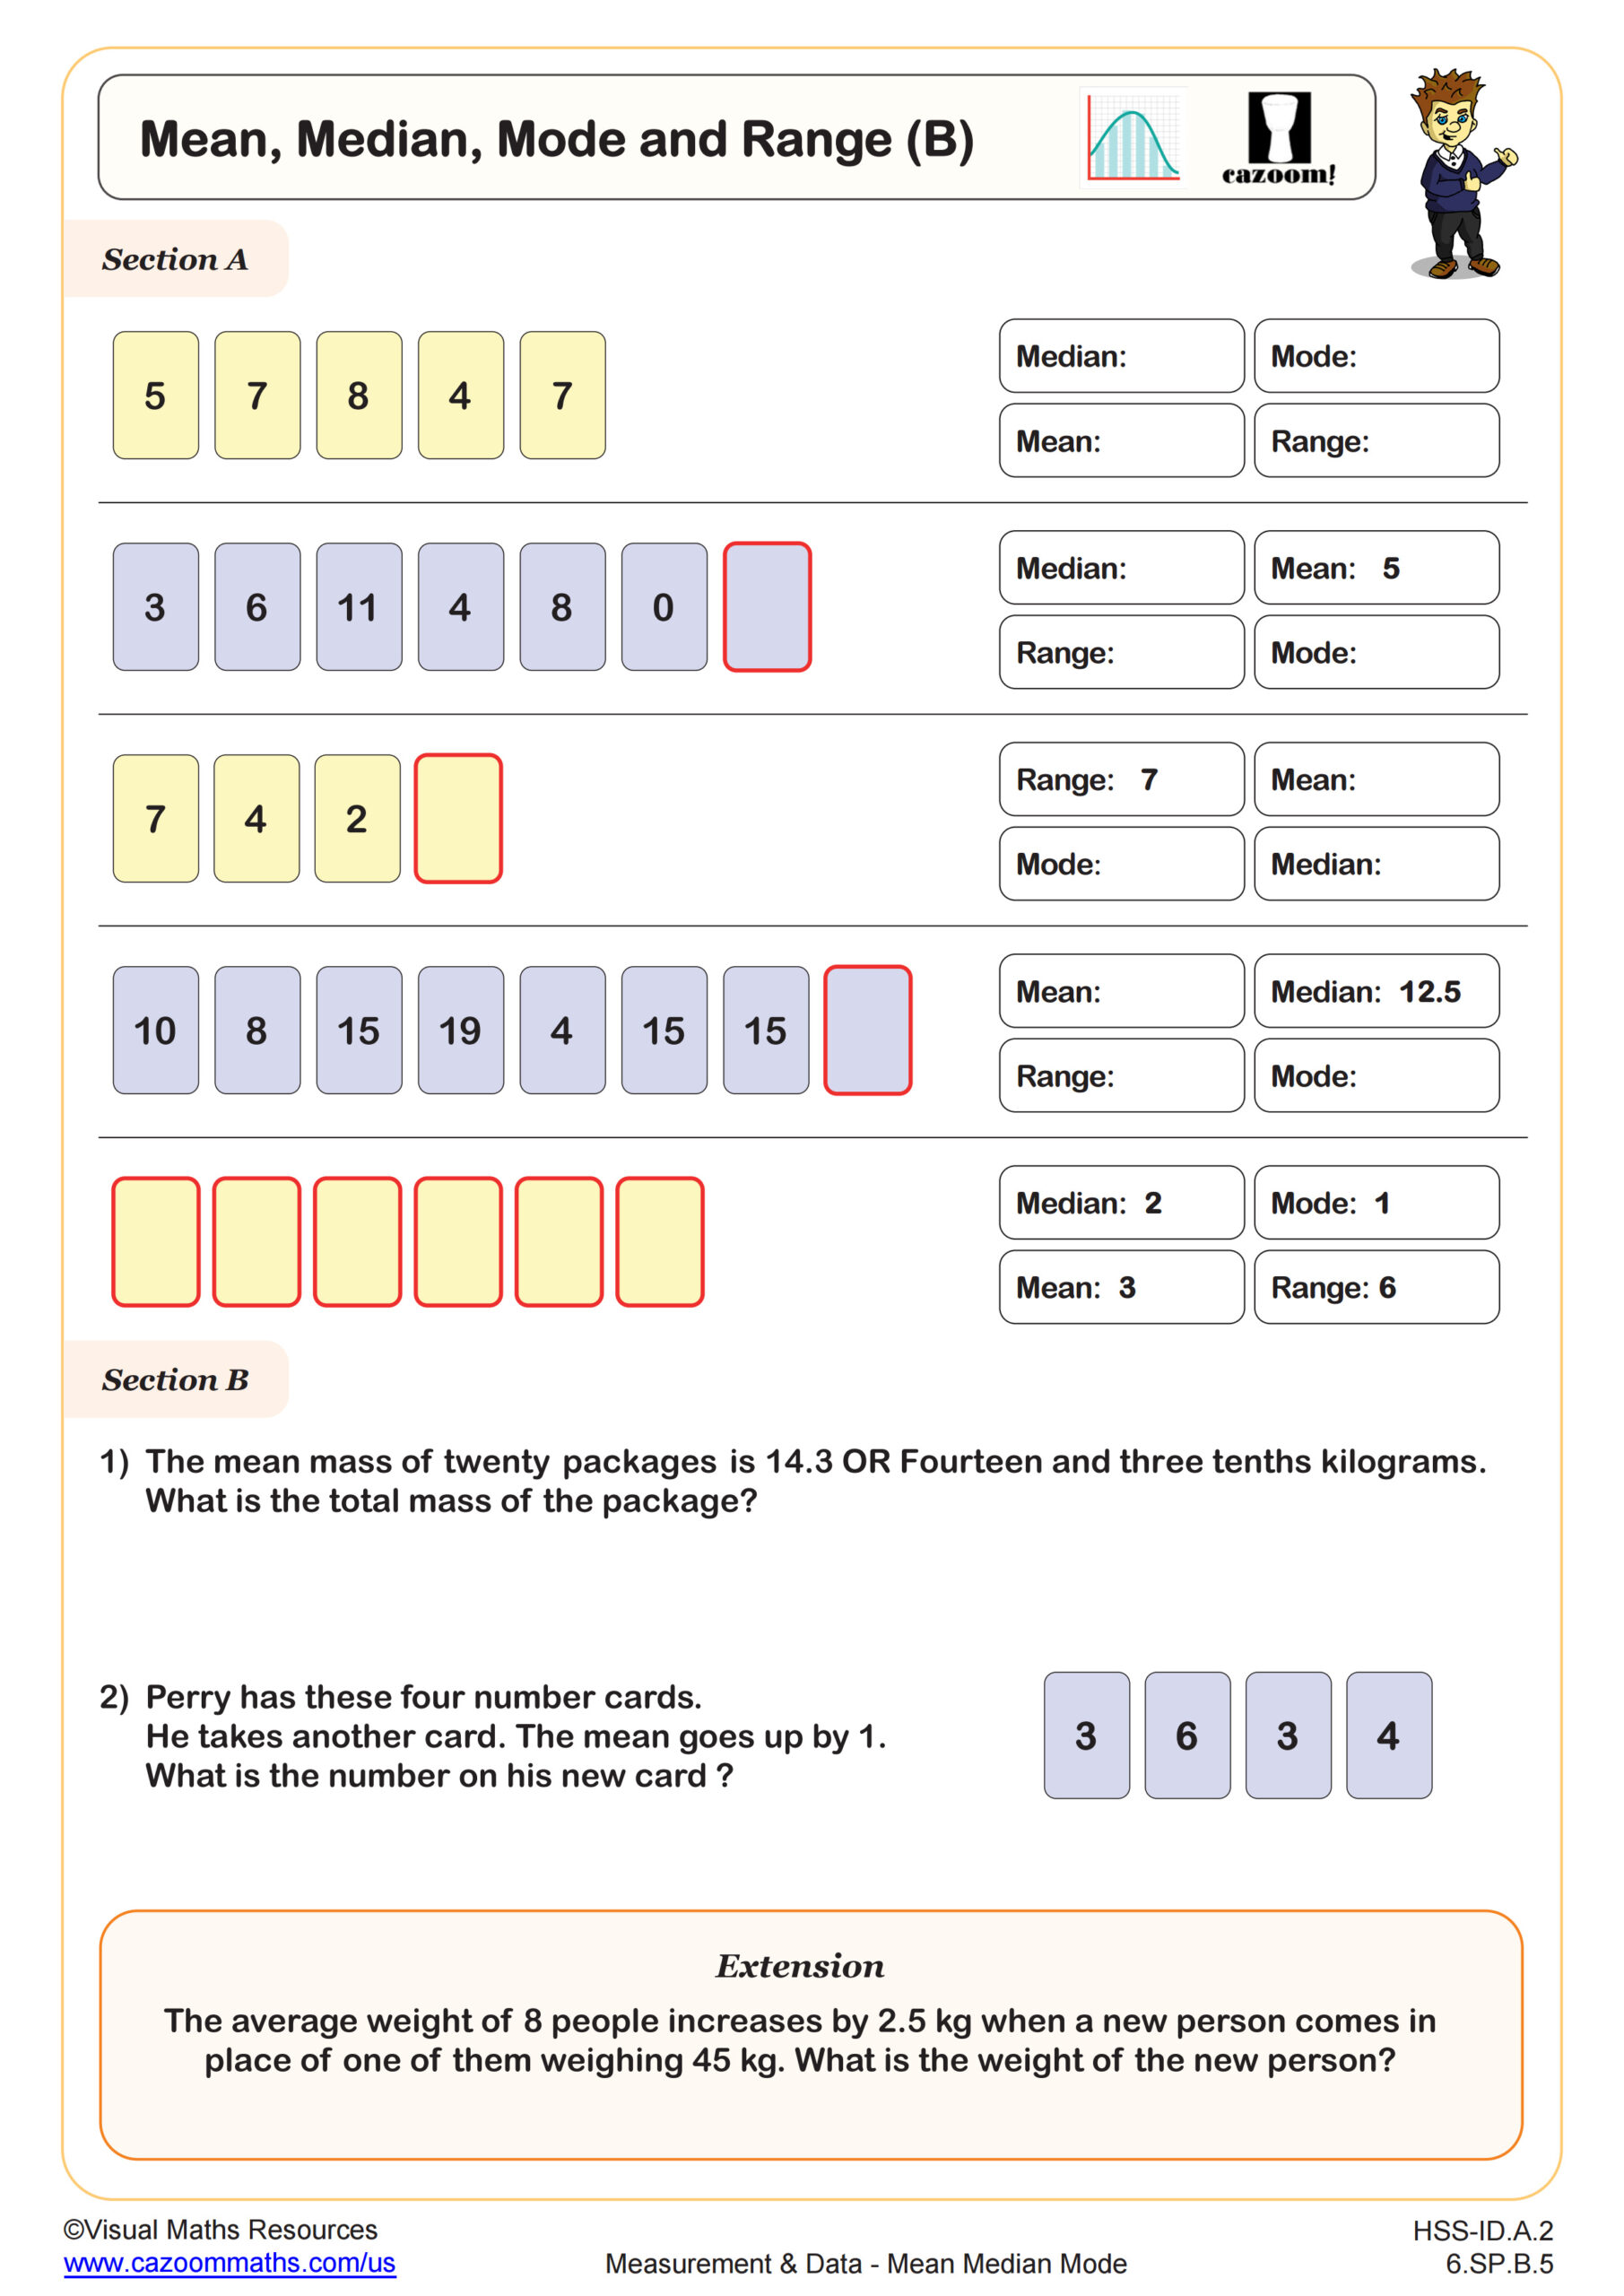
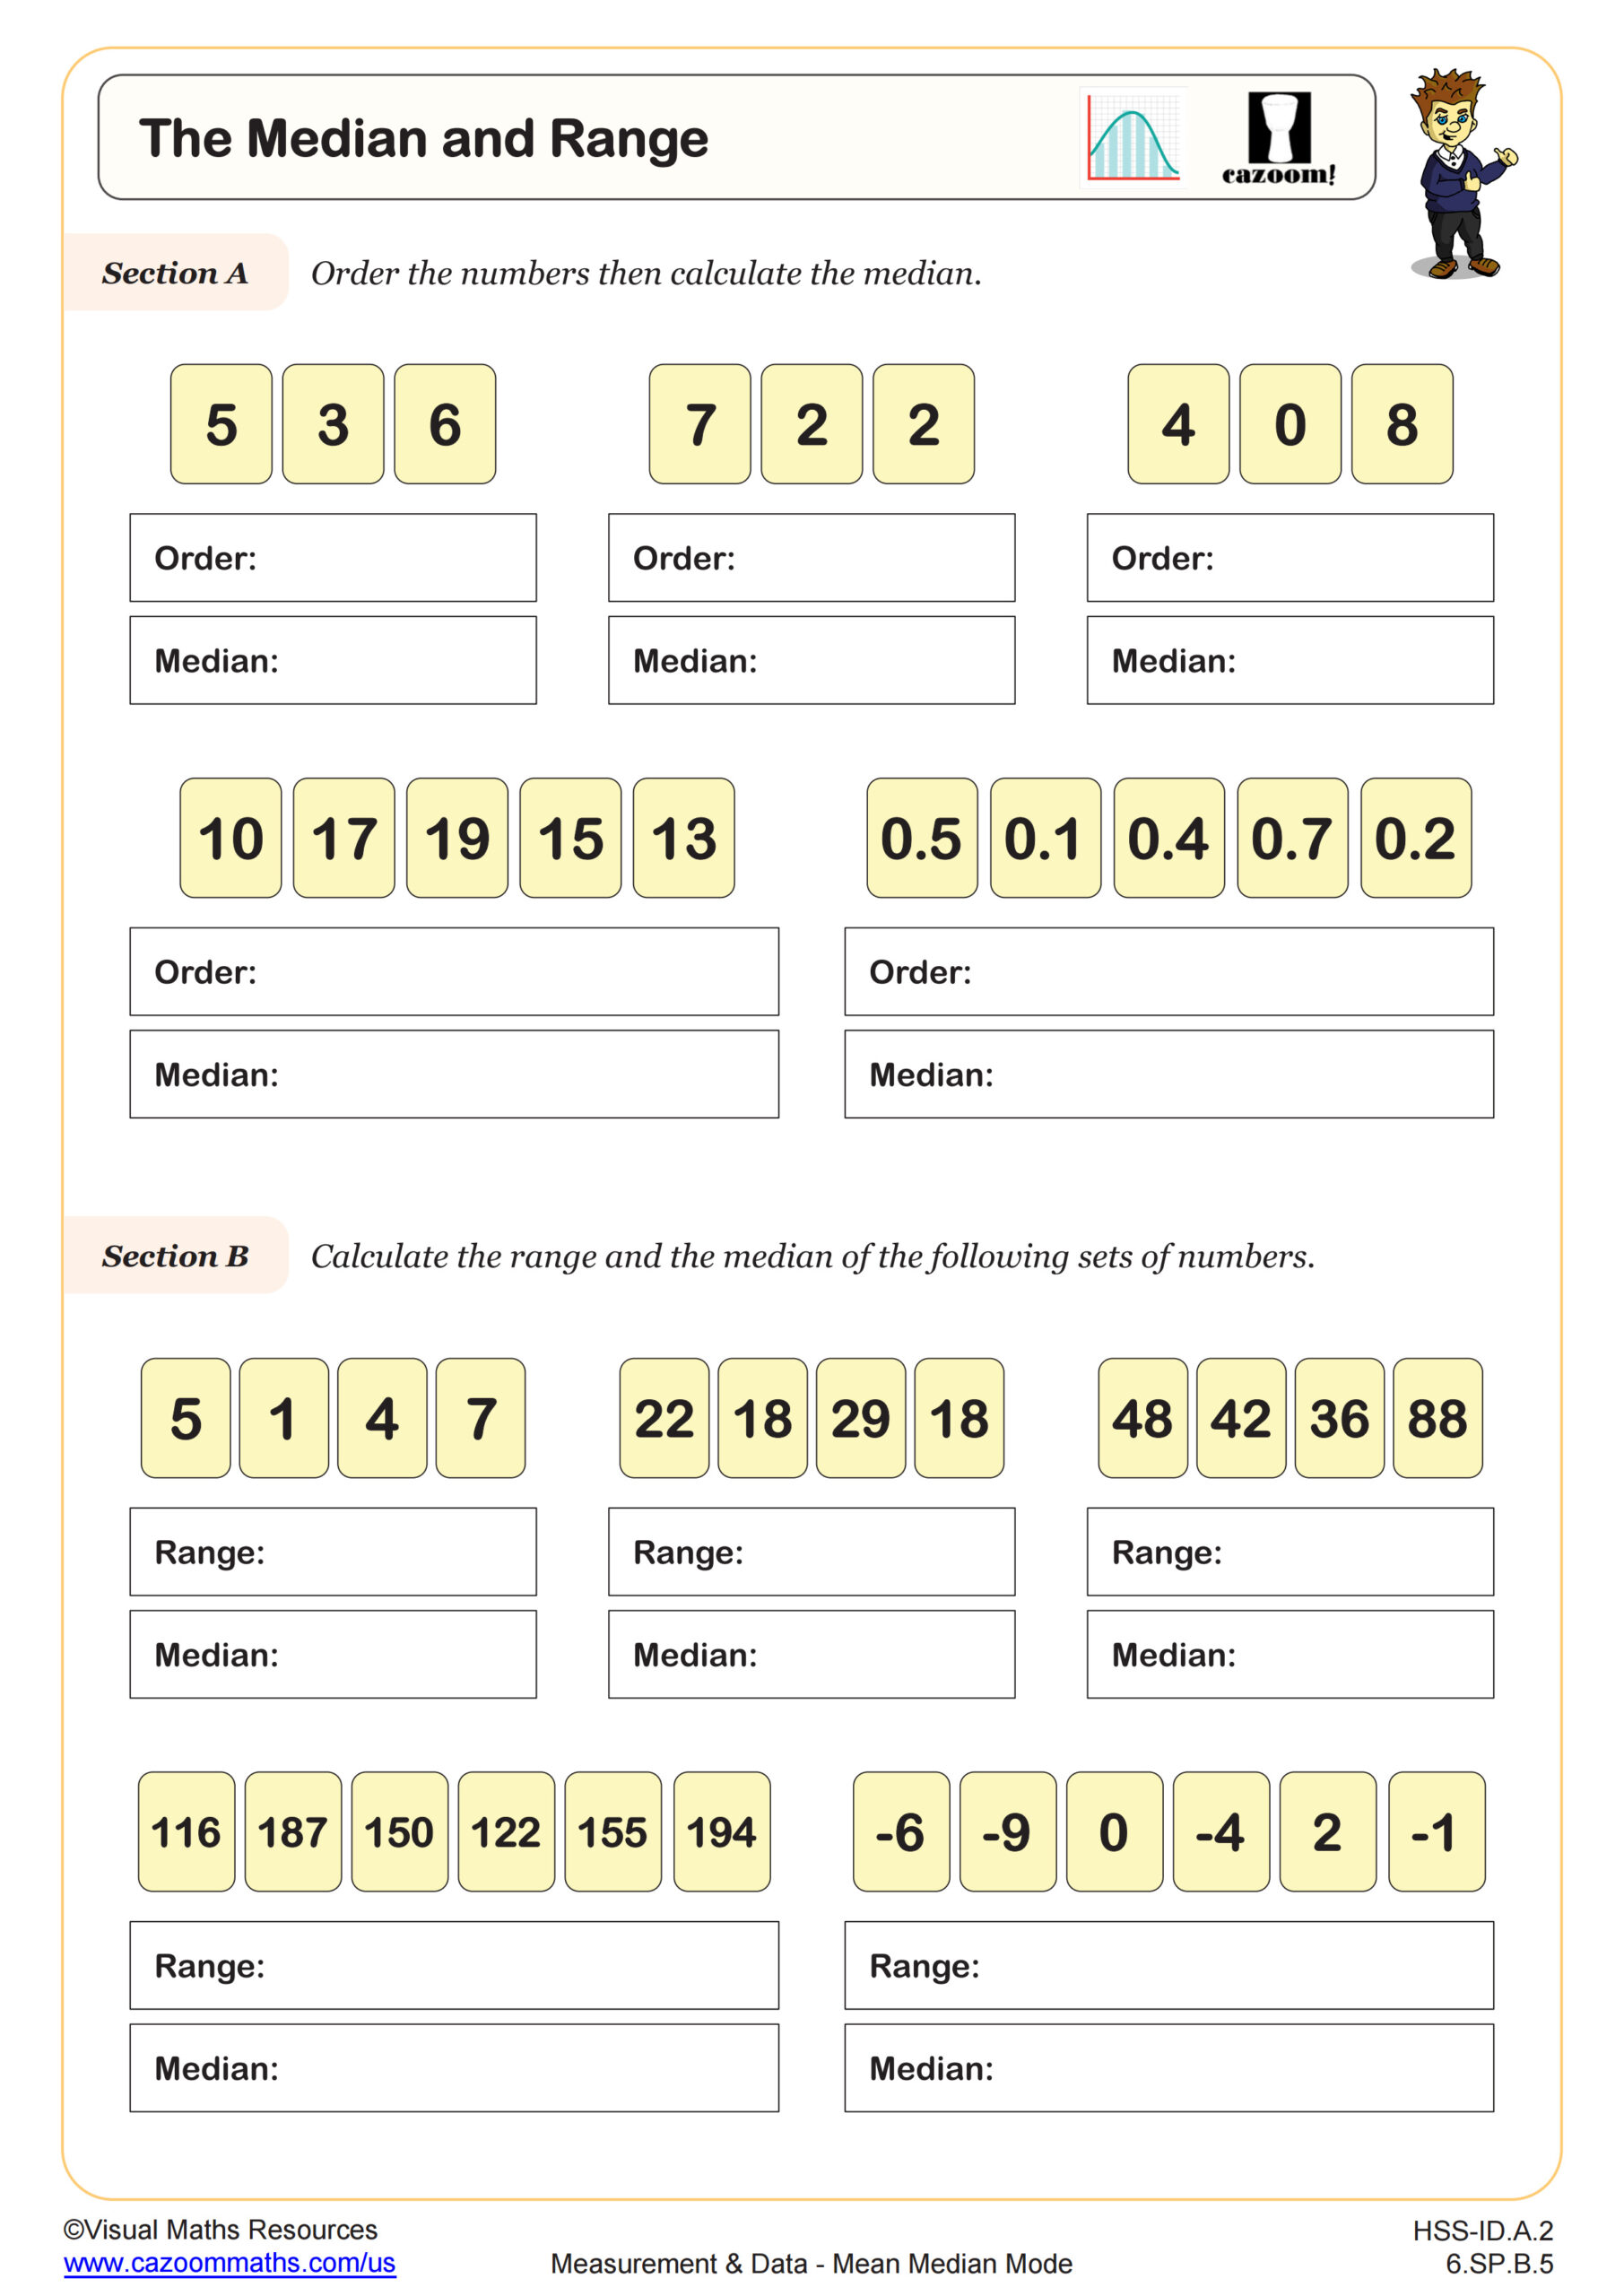
What's the difference between mean, median, and mode in statistics?
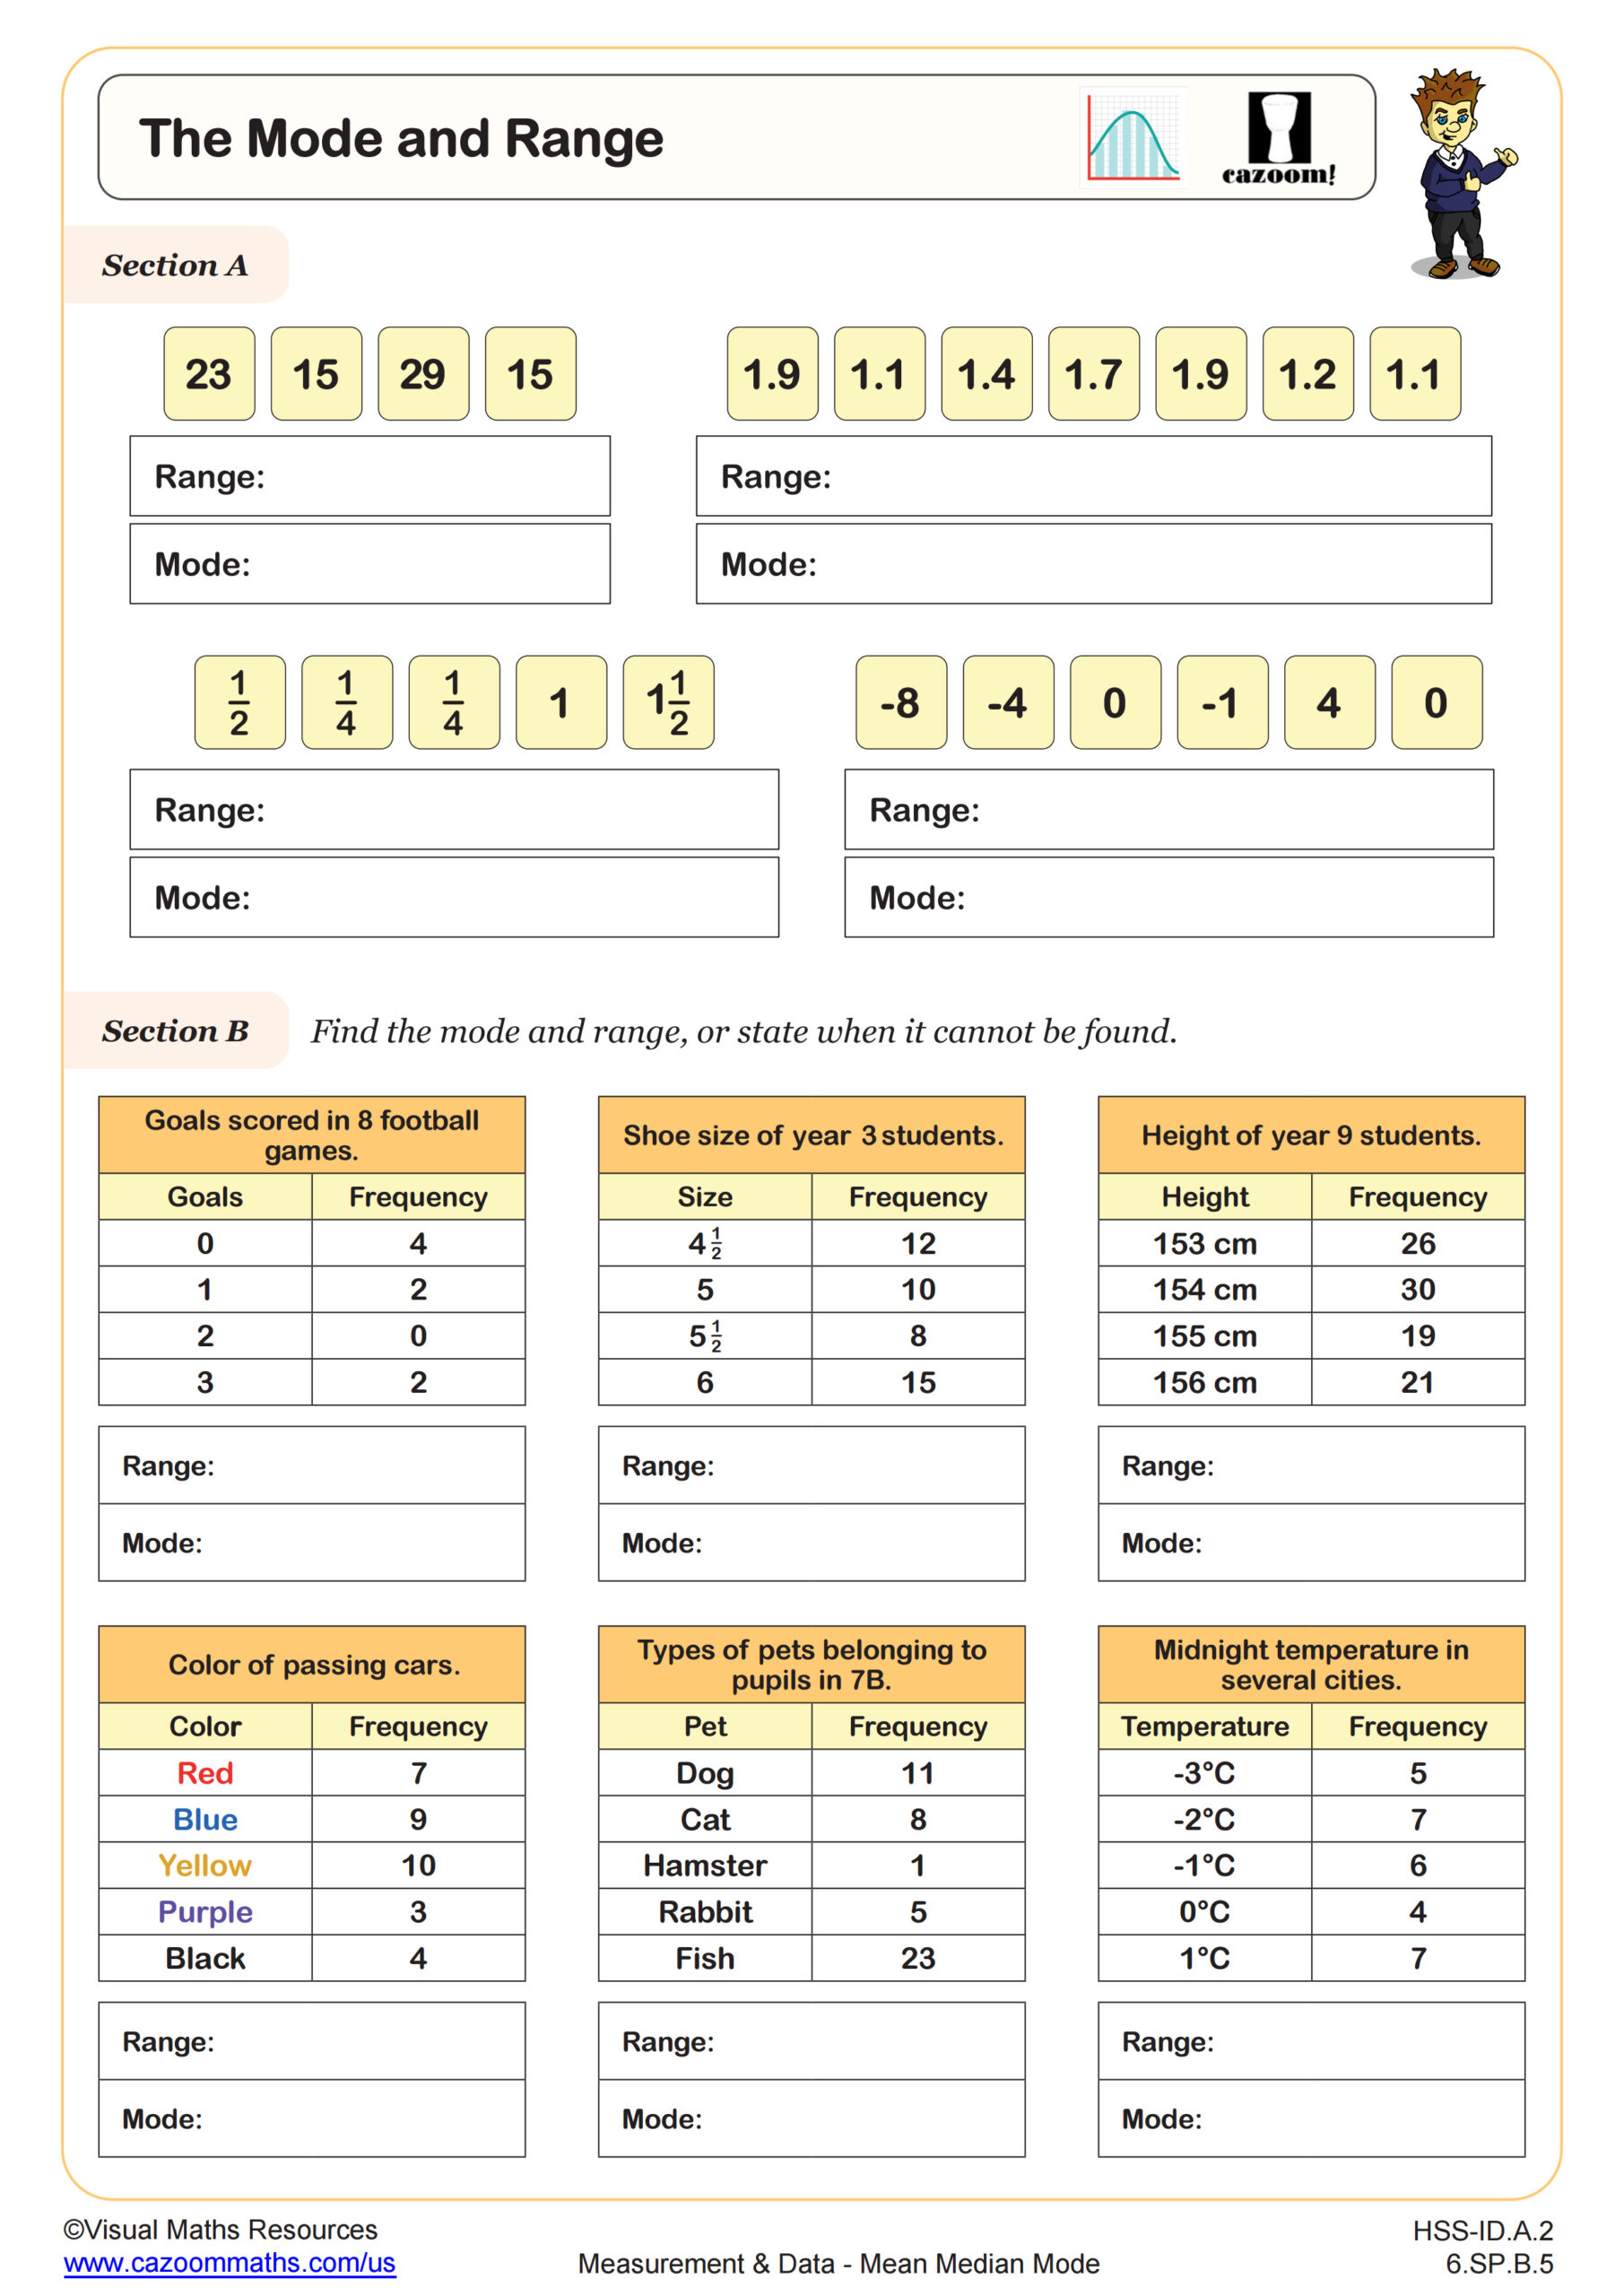
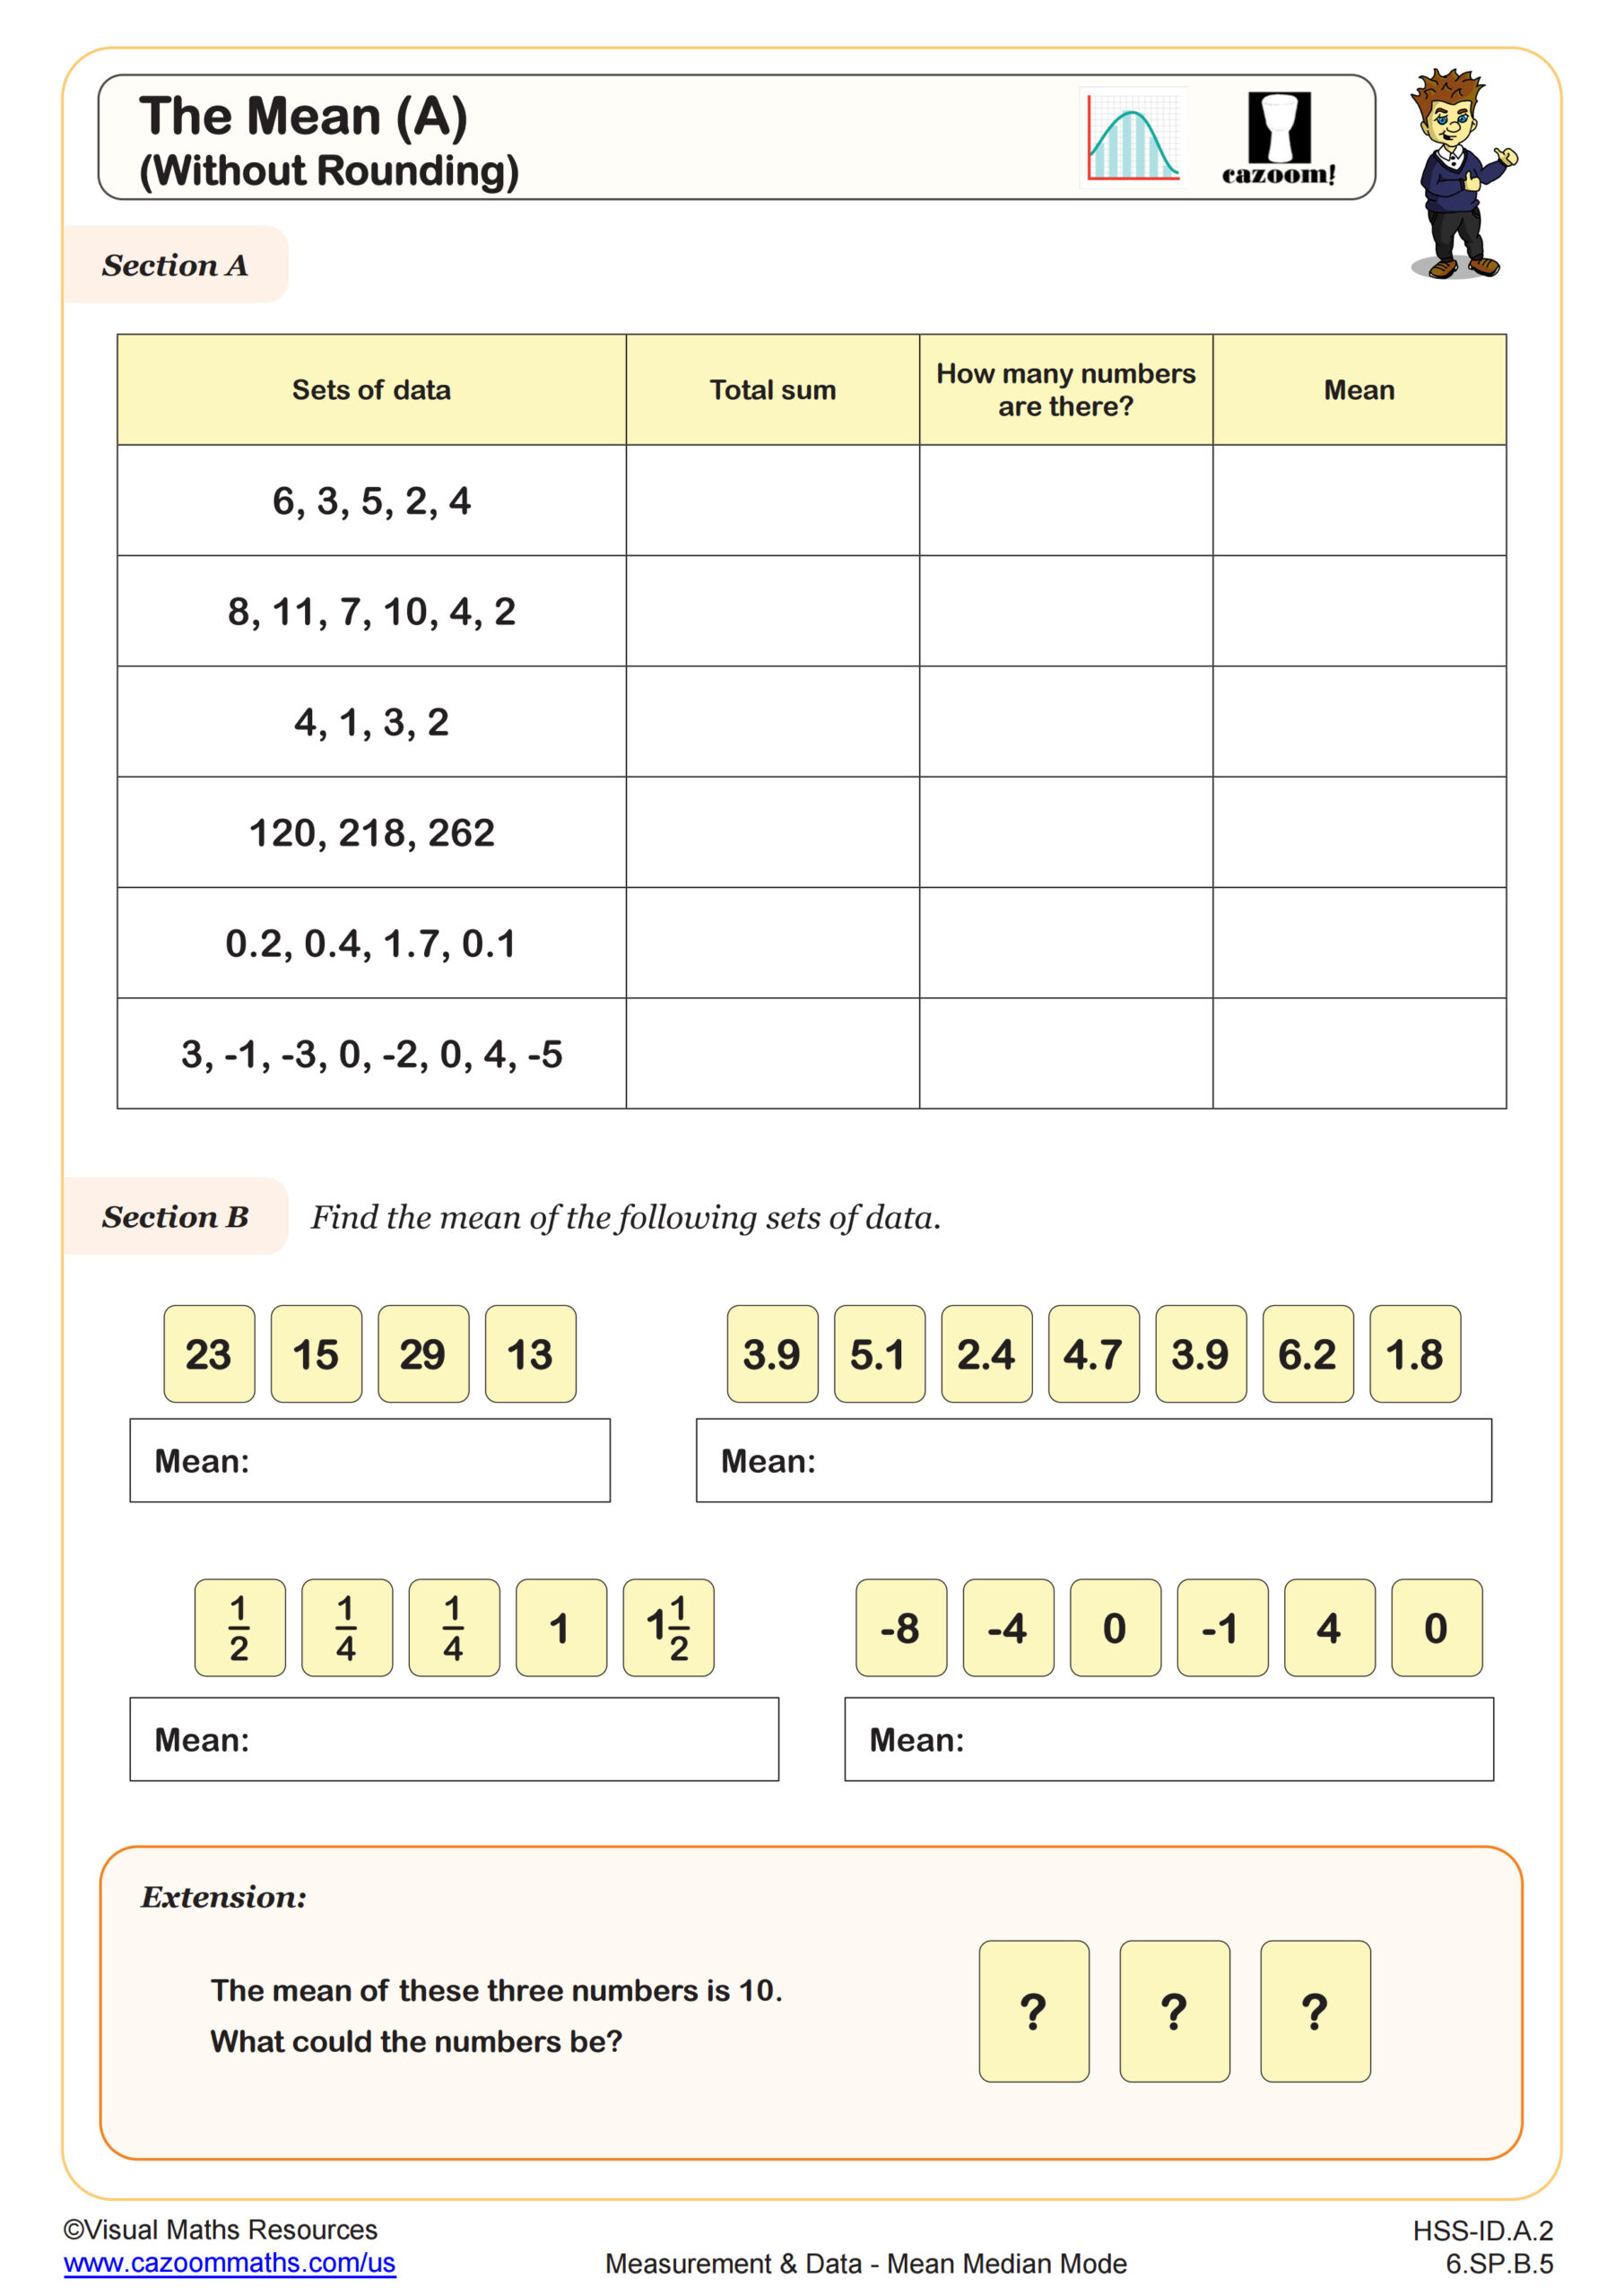
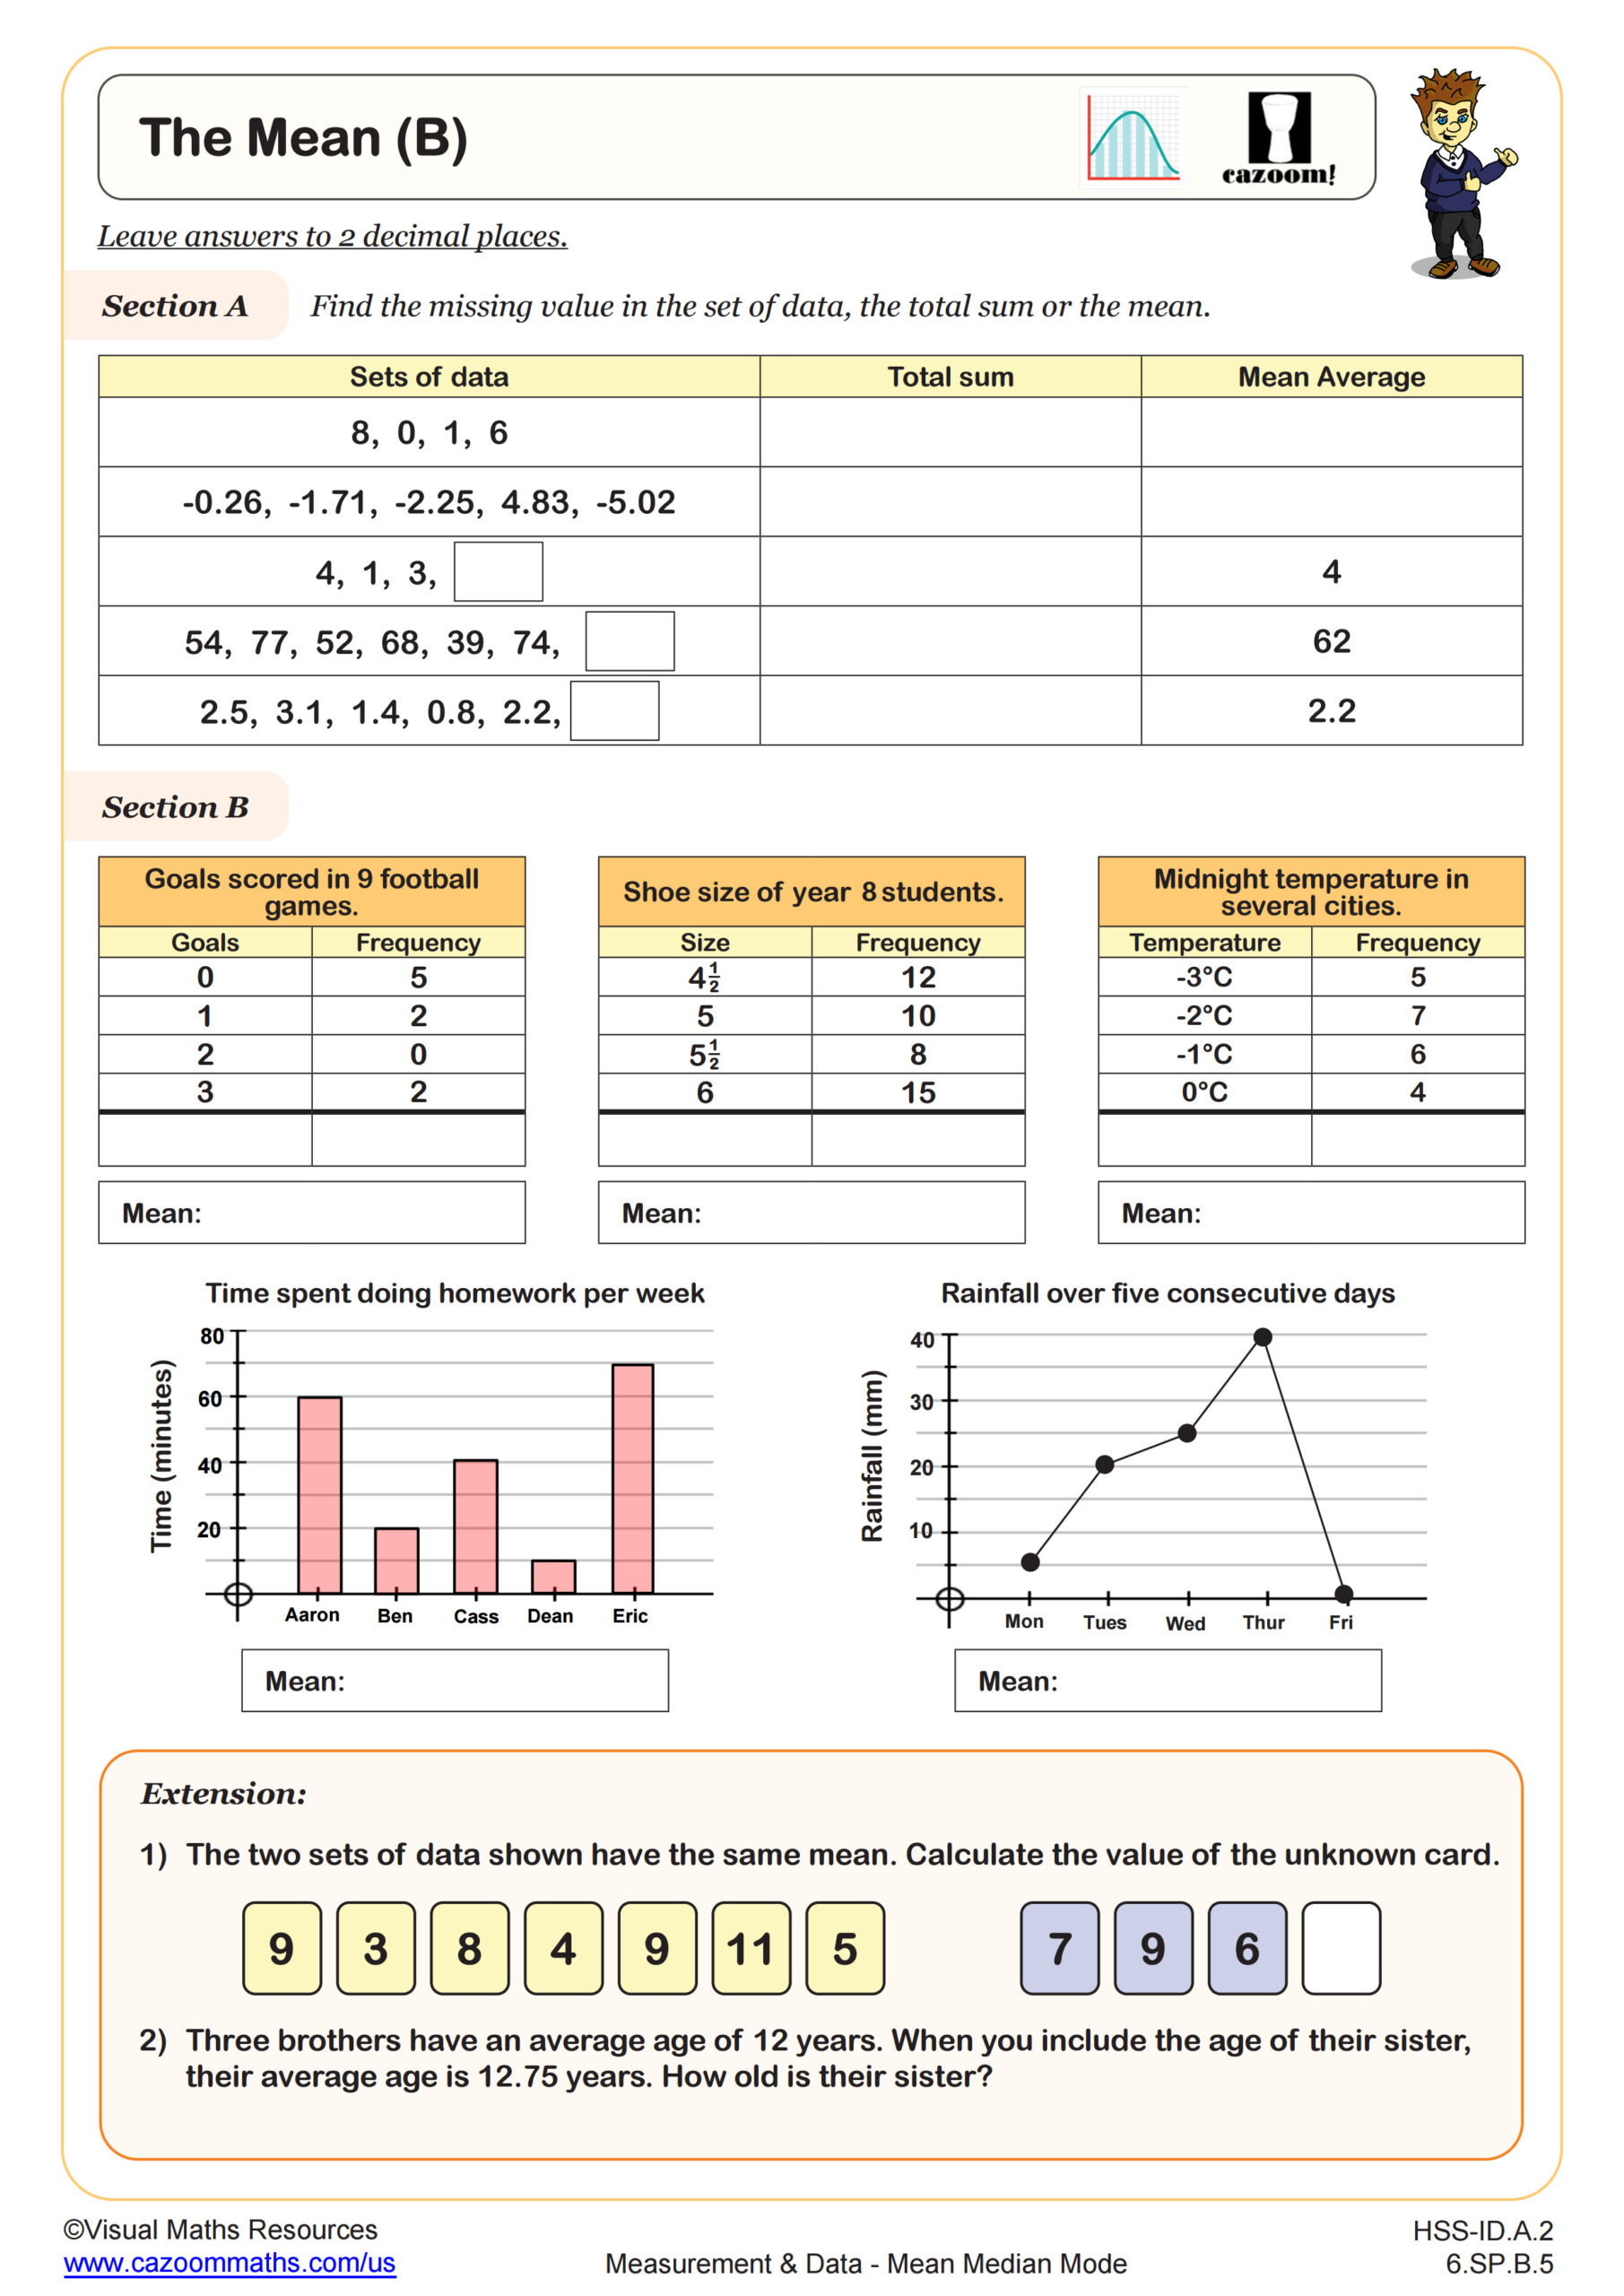
Mean represents the arithmetic average calculated by summing all values and dividing by the total count, median identifies the middle value when data is arranged in order, and mode represents the most frequently occurring value in a data set. Each measure of central tendency reveals different information about how data clusters, which helps students analyze real-world information from scientific experiments to economic trends.
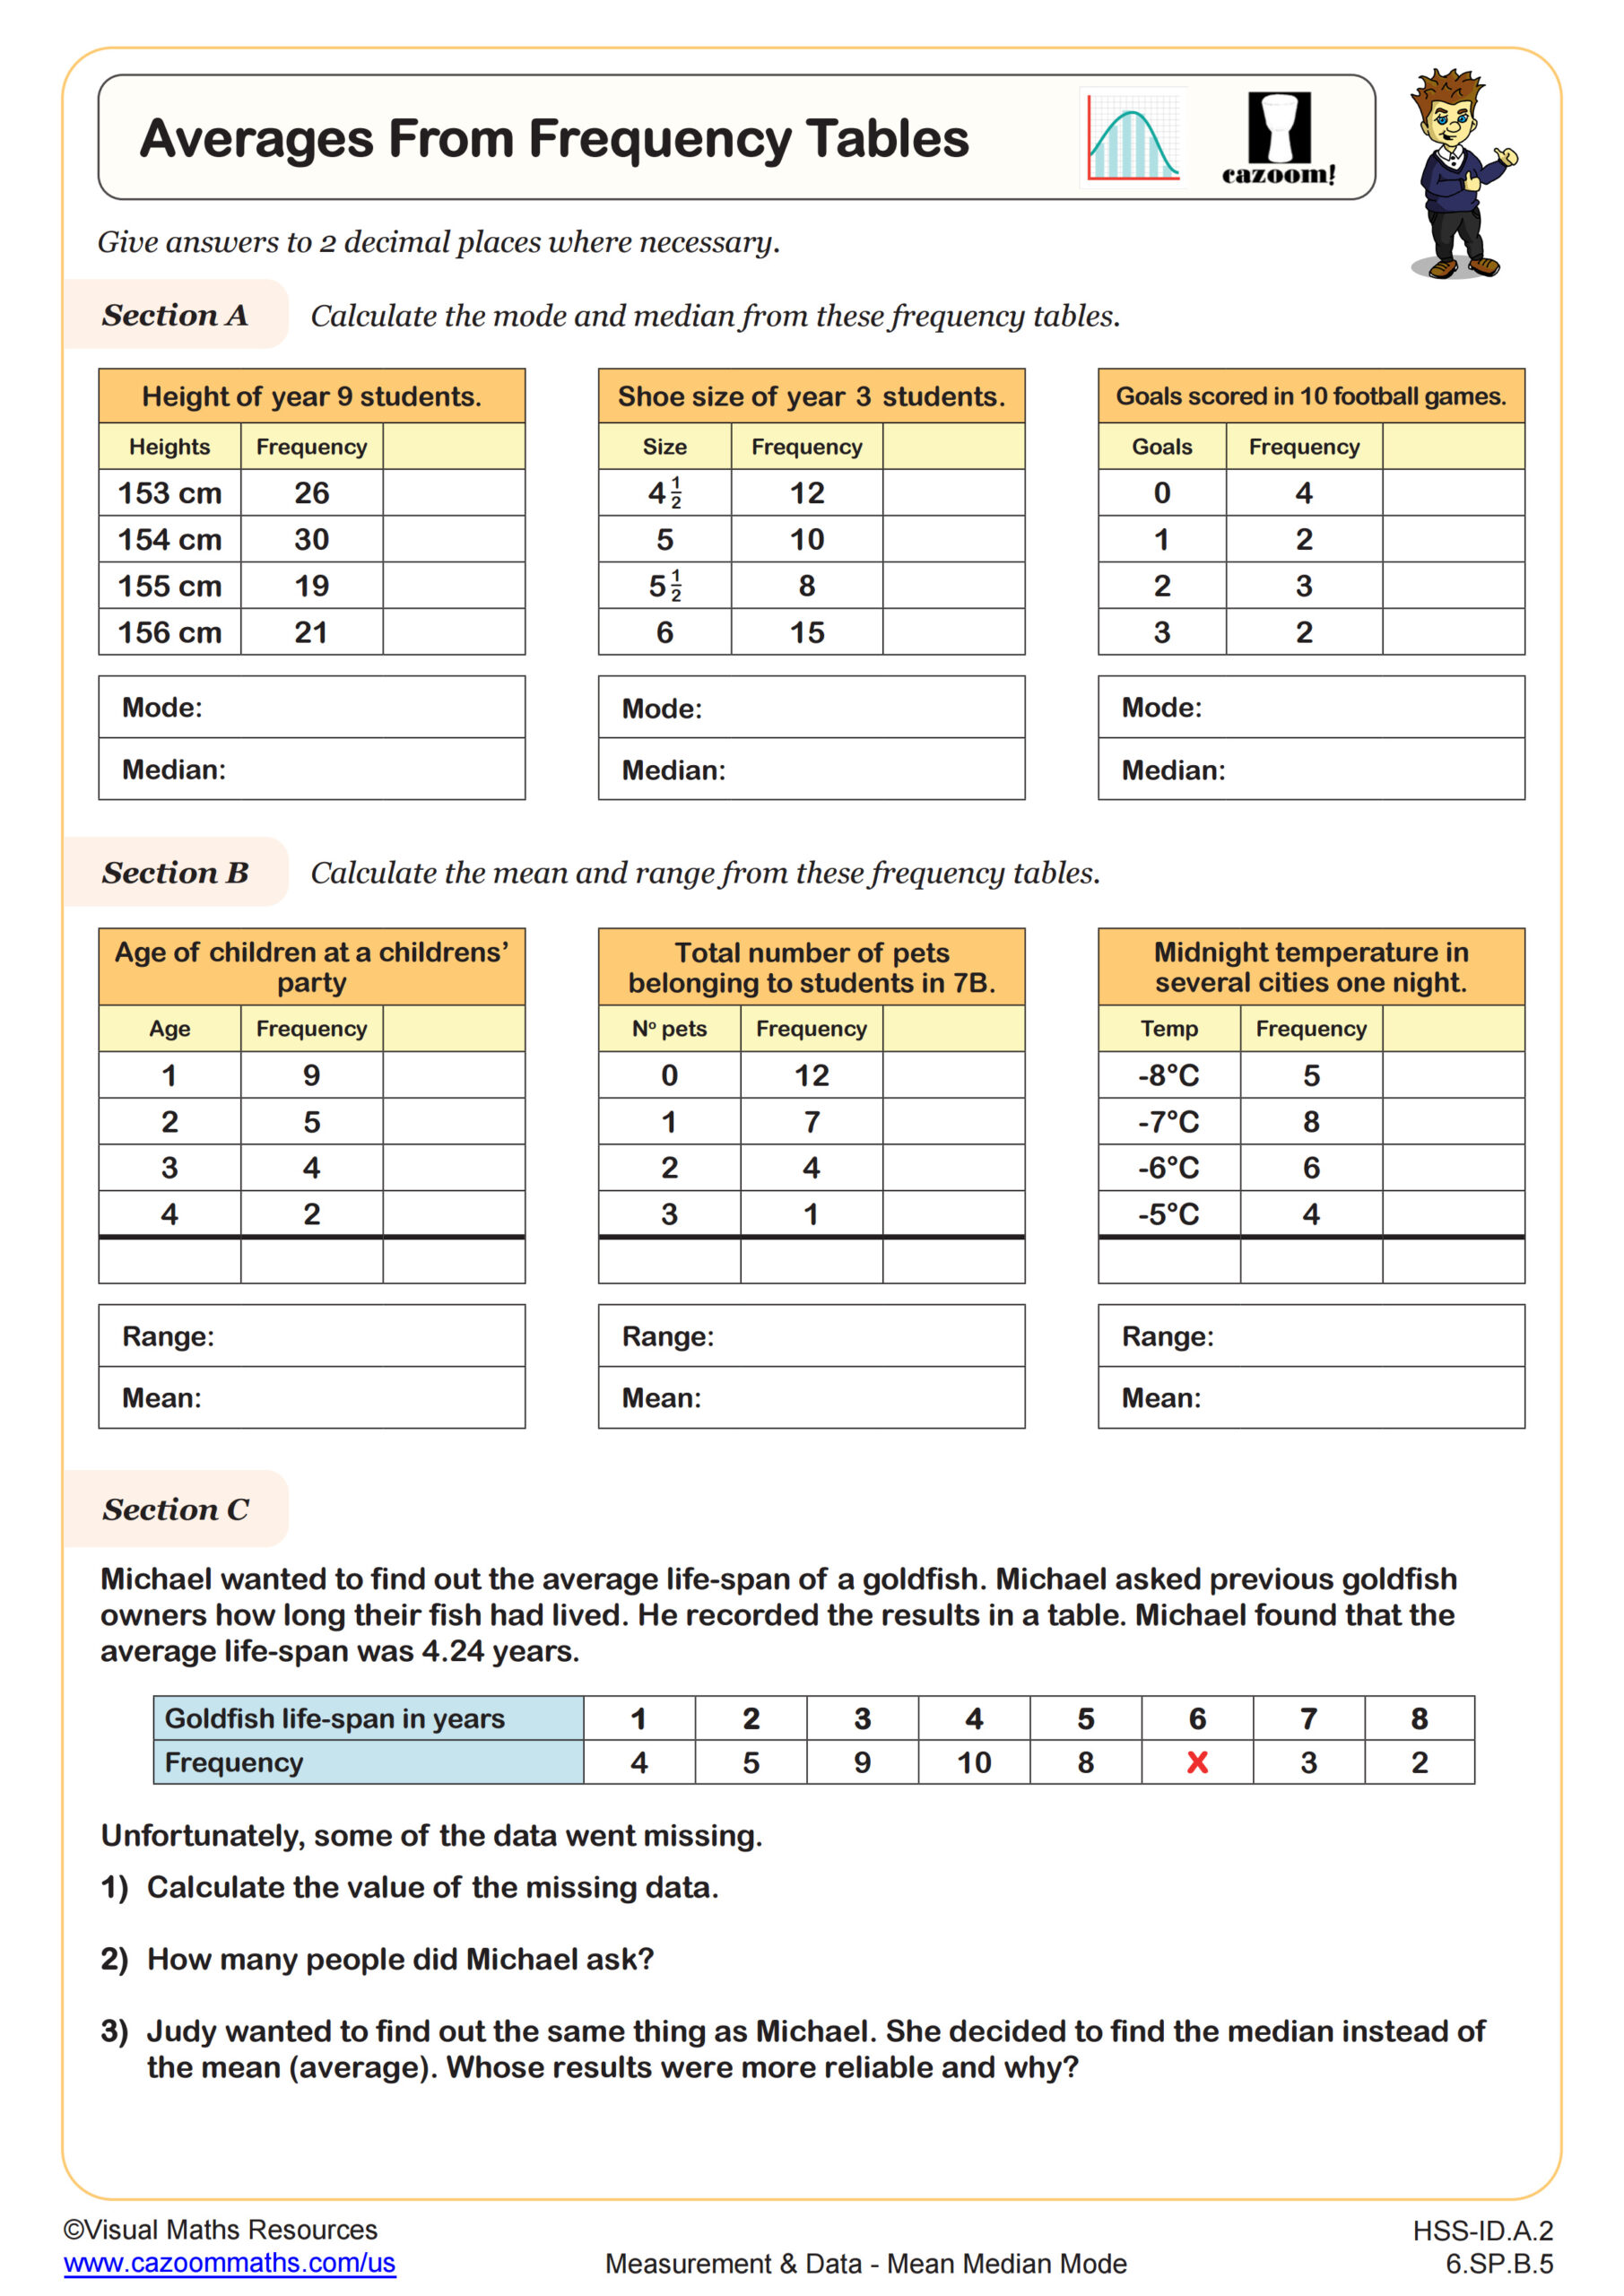
Students often struggle with frequency tables because they mistakenly add the frequencies instead of the actual data values when calculating the mean. Teachers notice this error disappears once students recognize that frequency indicates how many times each value appears, requiring multiplication of each data value by its frequency before summing. Standardized tests routinely expect students to select the most appropriate measure for skewed data, where median often provides a better representation than mean.
Which high school grades cover mean, median, and mode?
These worksheets align with Algebra I, Algebra II, Geometry, Precalculus, and Integrated Math courses (IM 1, IM 2, IM 3) throughout high school. While students encounter basic central tendency in middle school, high school courses expect deeper analysis with grouped frequency tables, larger data sets, and connections to probability distributions and statistical inference.
The complexity increases as students progress from simple data sets in Algebra I to grouped frequency tables in Algebra II and Precalculus, where they must estimate means using midpoint values. Integrated Math courses revisit these concepts multiple times with increasing sophistication, connecting statistical measures to functions, modeling, and real-world data analysis. Students confidently tackle quartiles and box plots once they recognize that median represents the second quartile in data distribution.
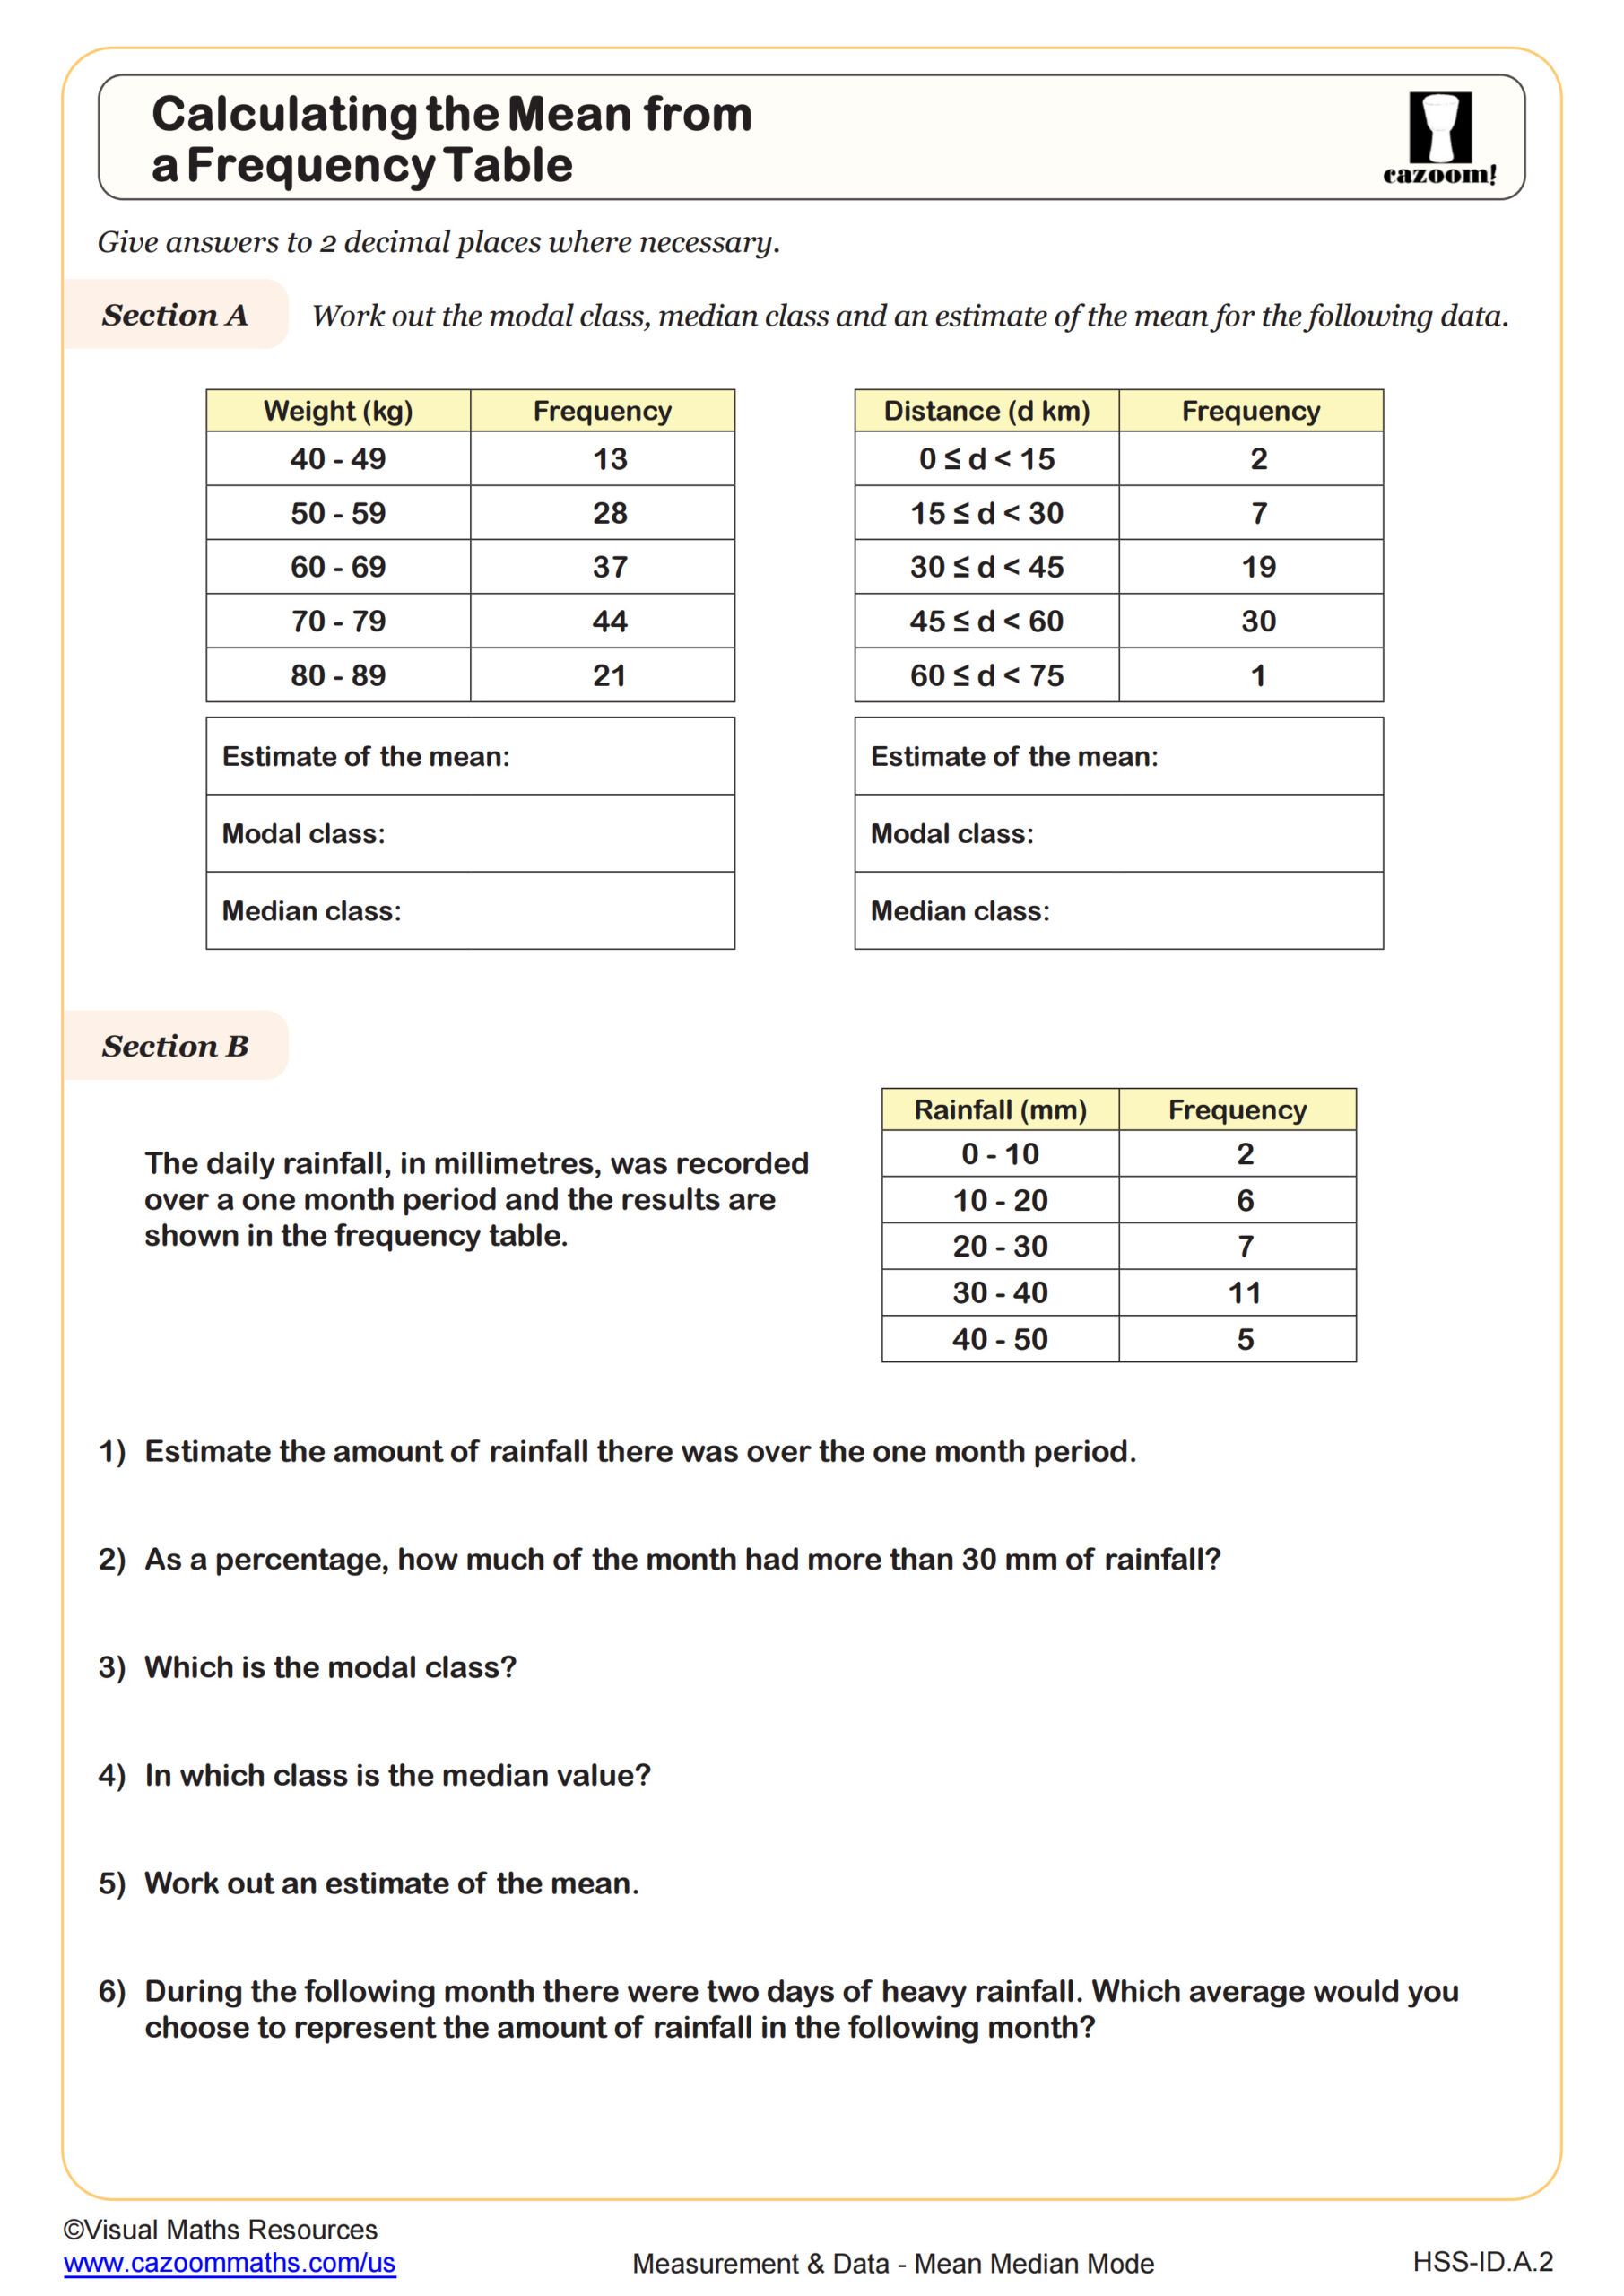
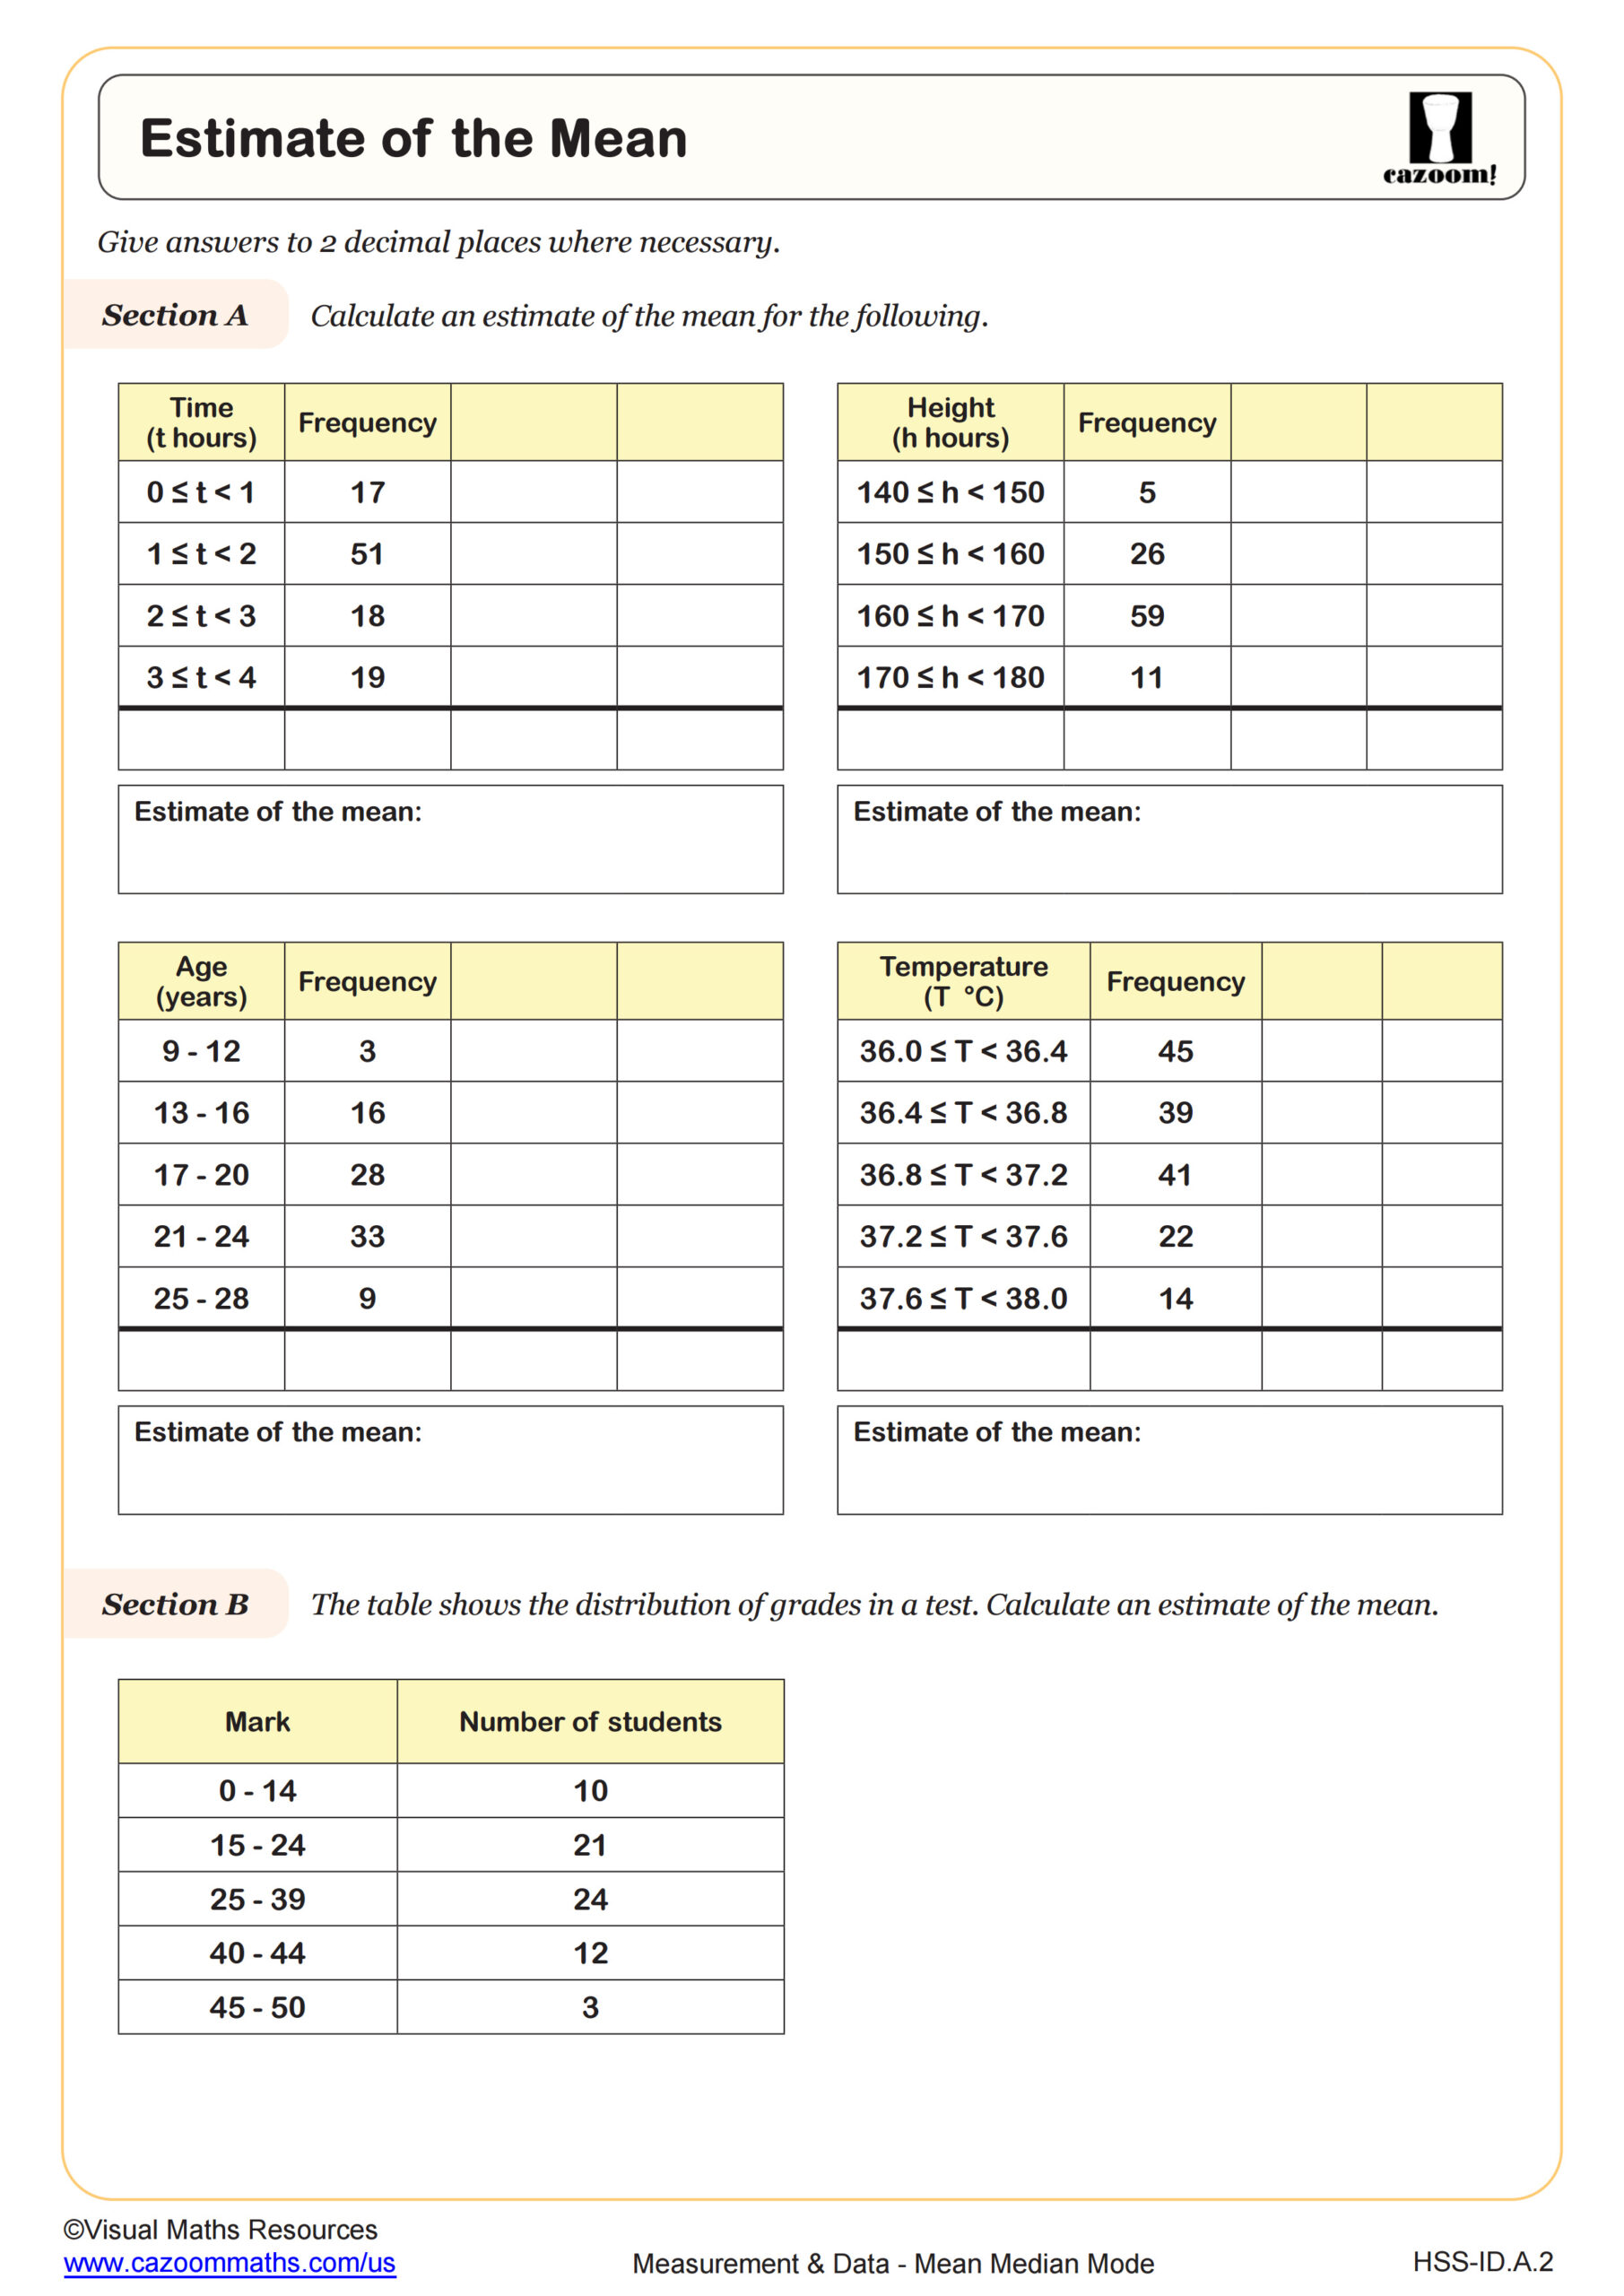
How do you calculate the mean from a grouped frequency table?
Calculating mean from a grouped frequency table requires finding the midpoint of each class interval, multiplying each midpoint by its frequency, summing these products, then dividing by the total frequency. This method provides an estimate since individual data values aren't known, only the intervals they fall within. Students must first identify class boundaries, calculate midpoints accurately, and organize their work systematically to avoid arithmetic errors.
This skill connects directly to data analysis in scientific research, where raw data is often grouped into ranges for large sample sizes. Medical studies might group patient ages into decades, environmental scientists bin temperature readings into intervals, and quality control engineers organize measurements into tolerance ranges. Understanding how grouped data affects accuracy helps students evaluate statistical claims they encounter in news reports, research studies, and data-driven arguments across STEM fields.
How can teachers use these mean, median, mode worksheets effectively?
The worksheets provide scaffolded practice that begins with straightforward calculations and progresses to more complex scenarios involving frequency tables and grouped data. Each worksheet includes worked examples that demonstrate the step-by-step process, helping students internalize the procedures before attempting independent problems. The answer keys allow students to check their understanding immediately and identify calculation errors before they become habits.
Many teachers use these worksheets for differentiated instruction, assigning simpler mean and median problems to students who need foundational review while challenging advanced learners with grouped frequency calculations. The worksheets work well for bell ringers to activate prior knowledge before introducing box plots or standard deviation, as homework to reinforce classroom learning, or as intervention materials when students struggle with data analysis on assessments. Paired practice allows students to compare their calculation methods and catch computational mistakes collaboratively.