High School Real Life Graphs Worksheets
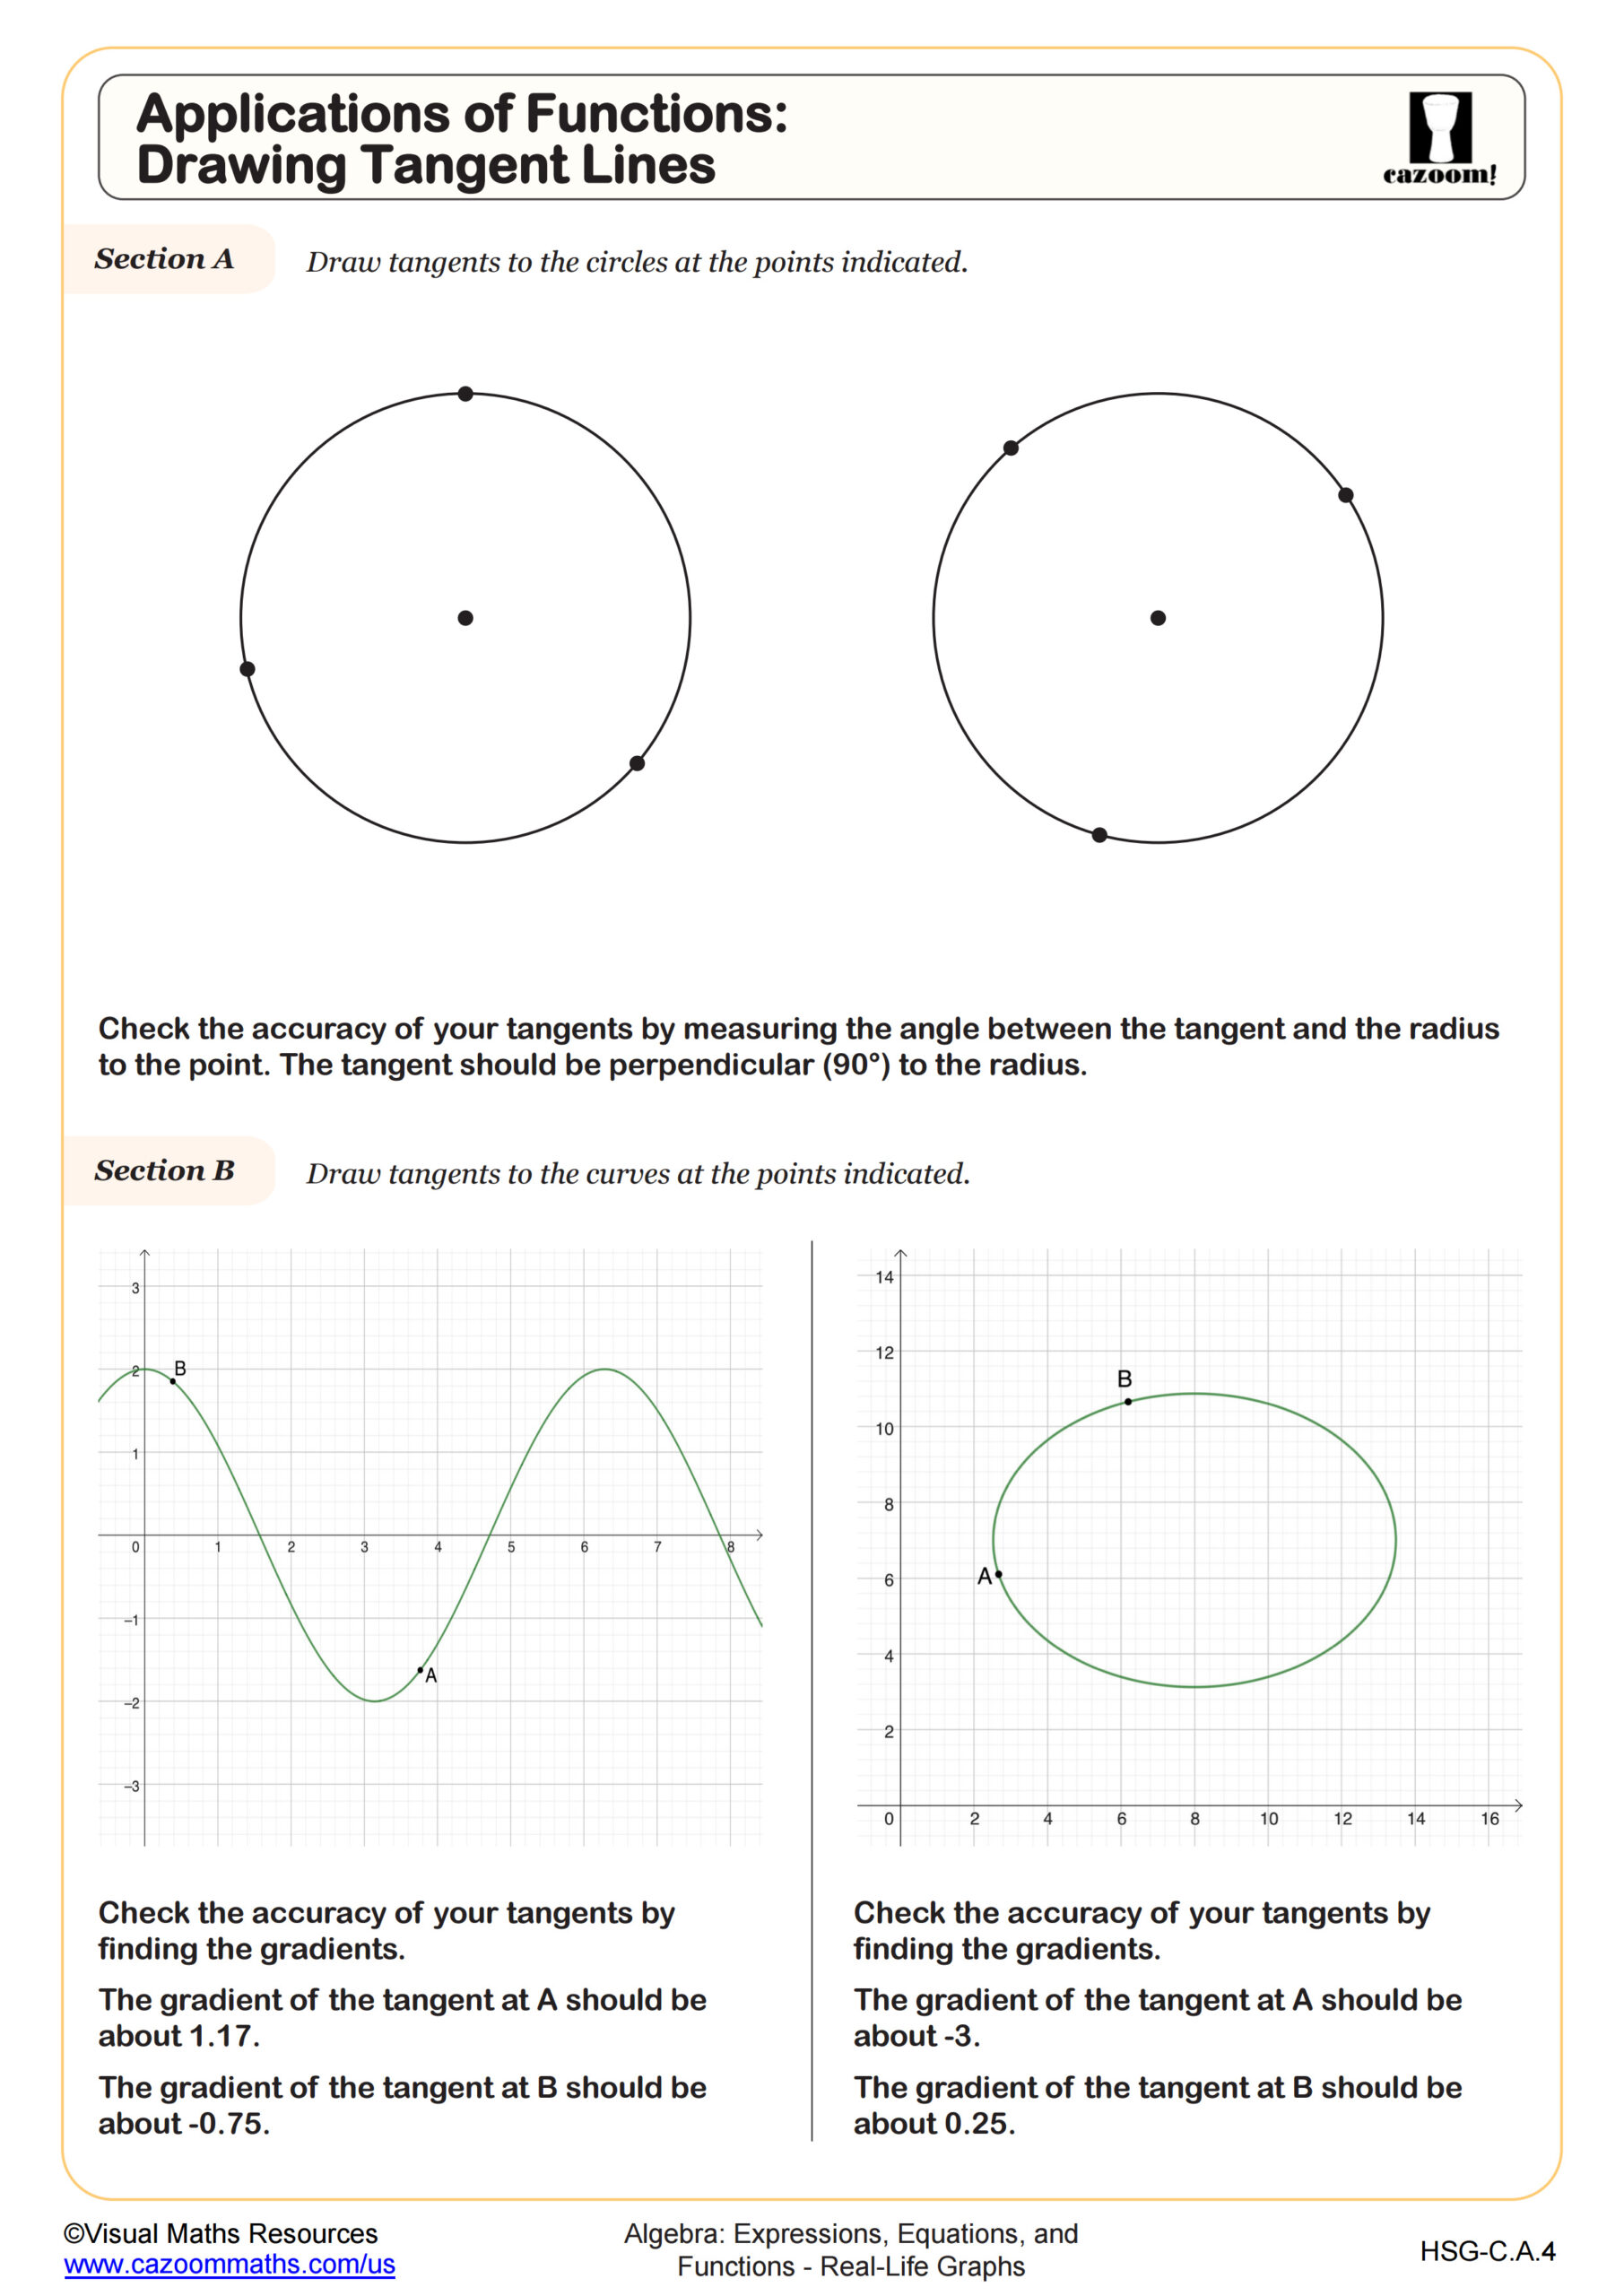
Applications of Functions: Drawing Tangent Lines
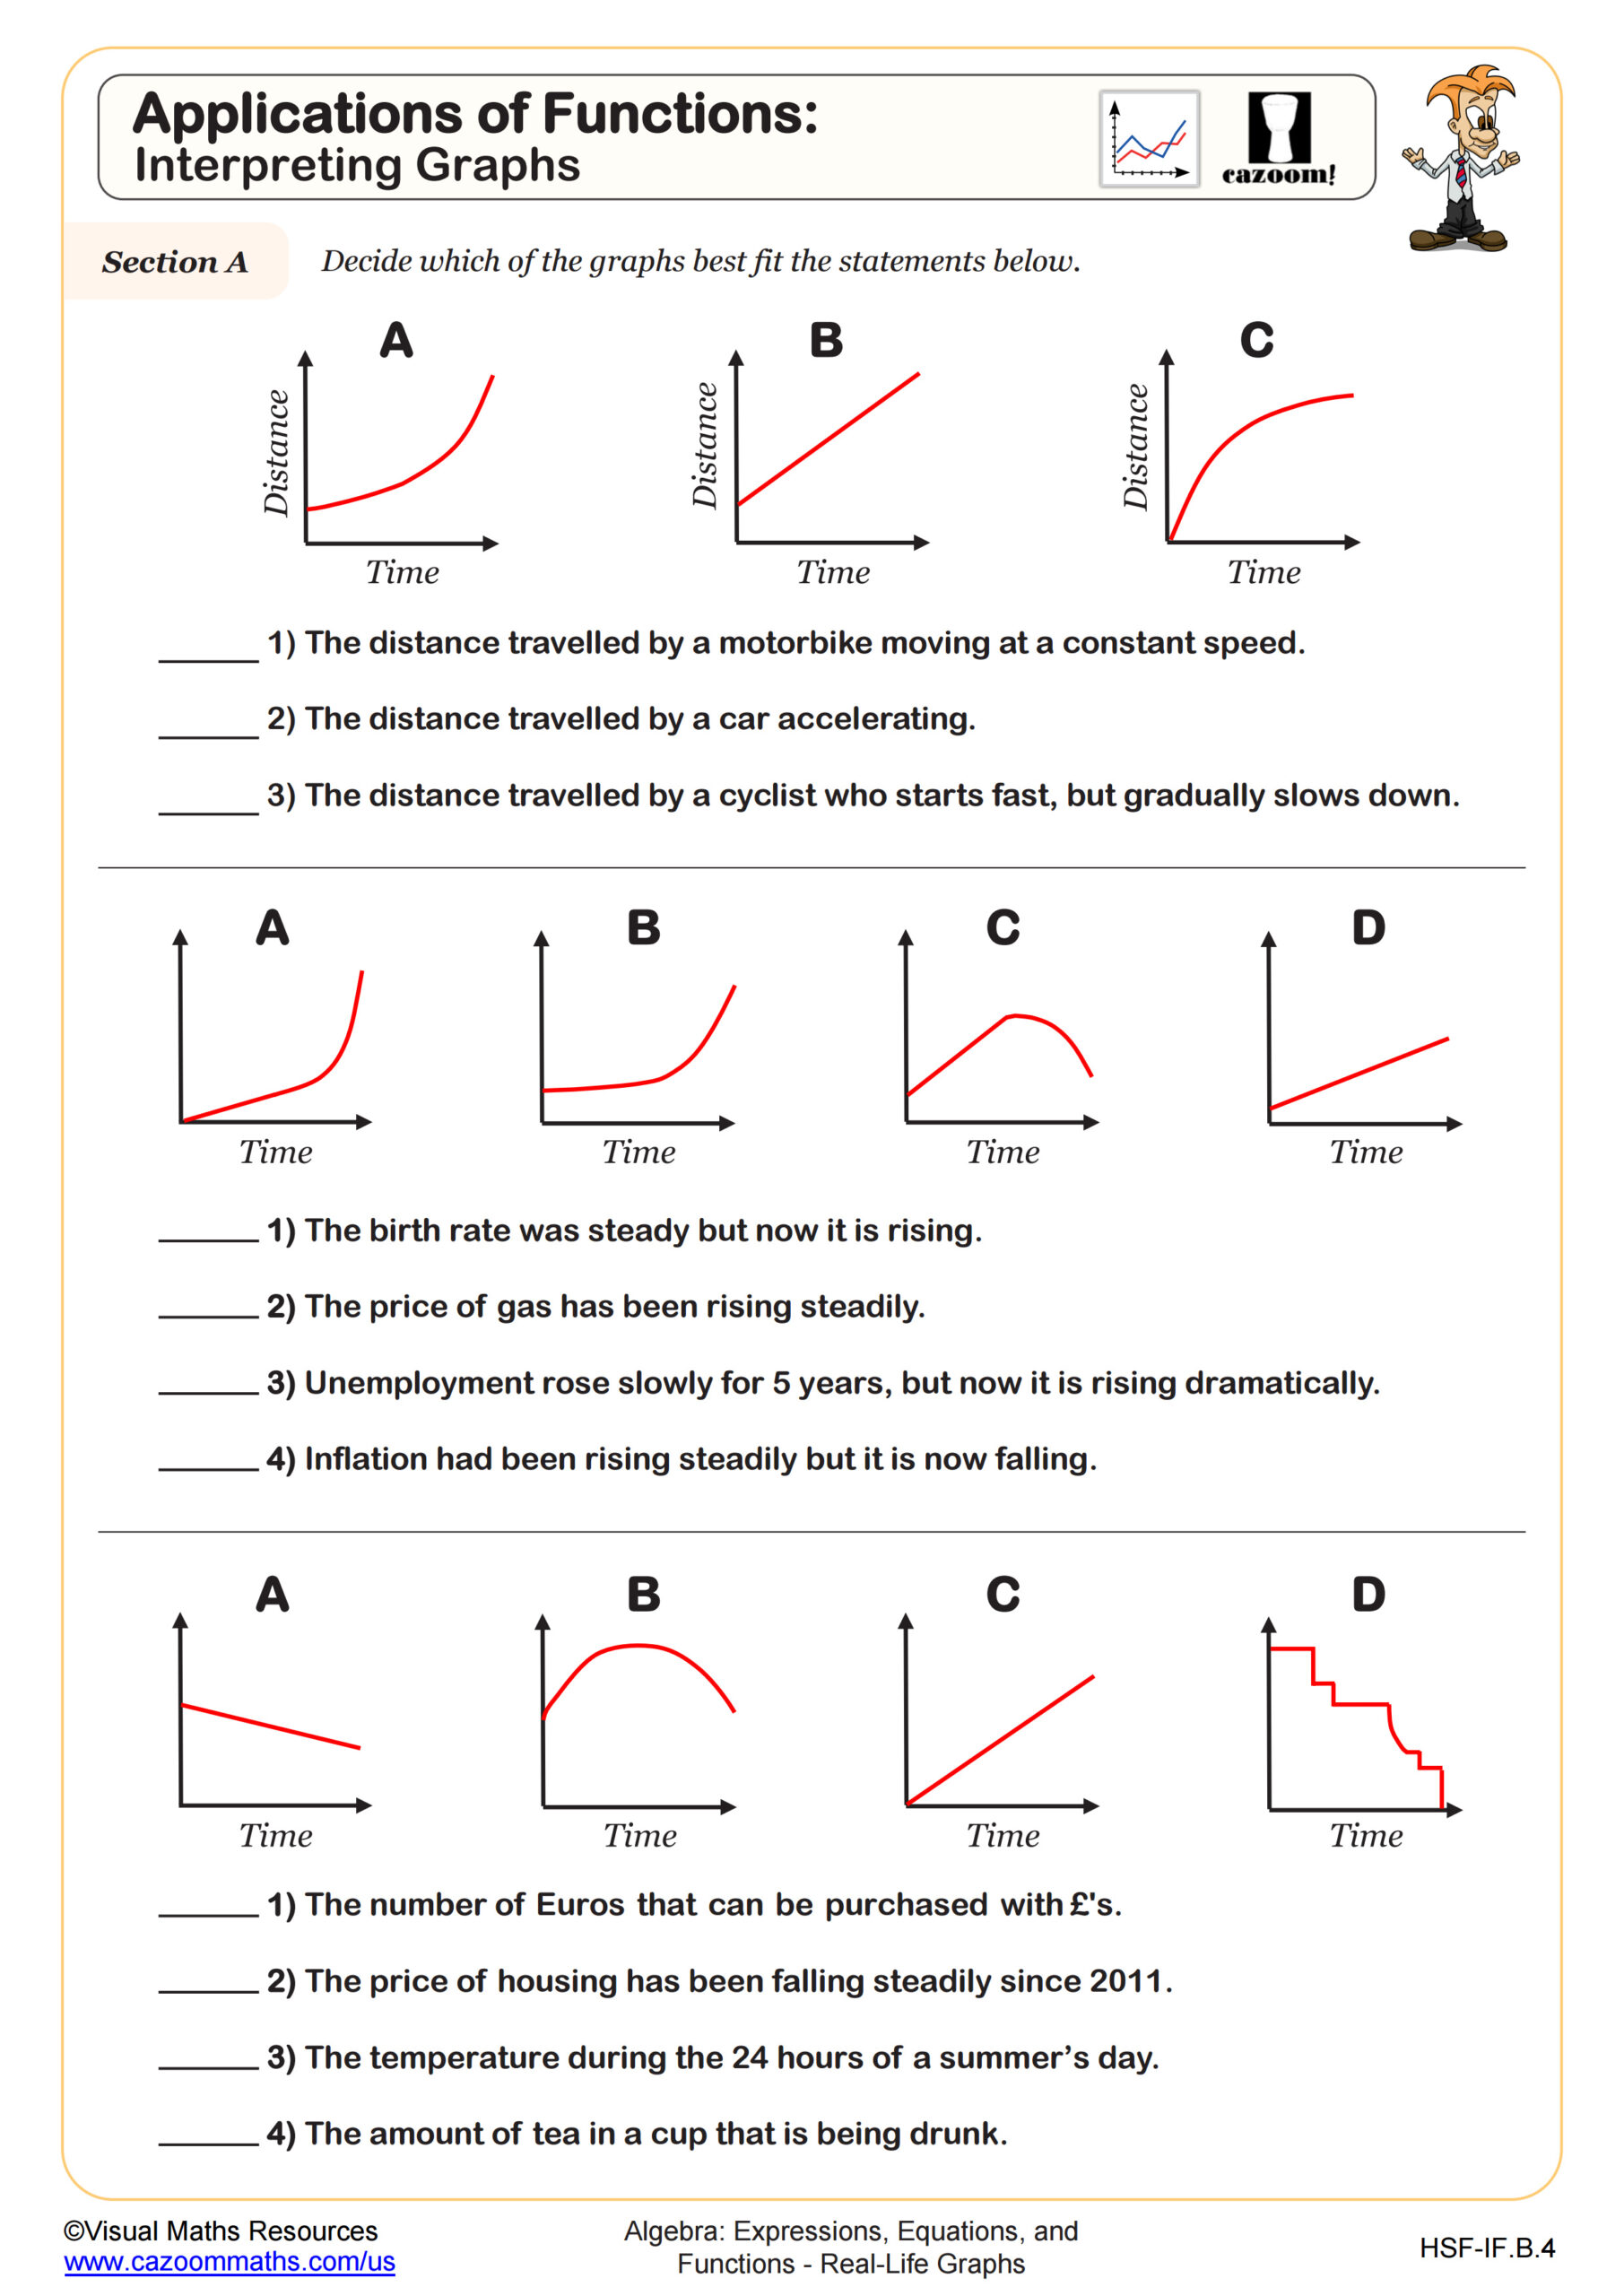
Applications of Functions: Interpreting Graphs
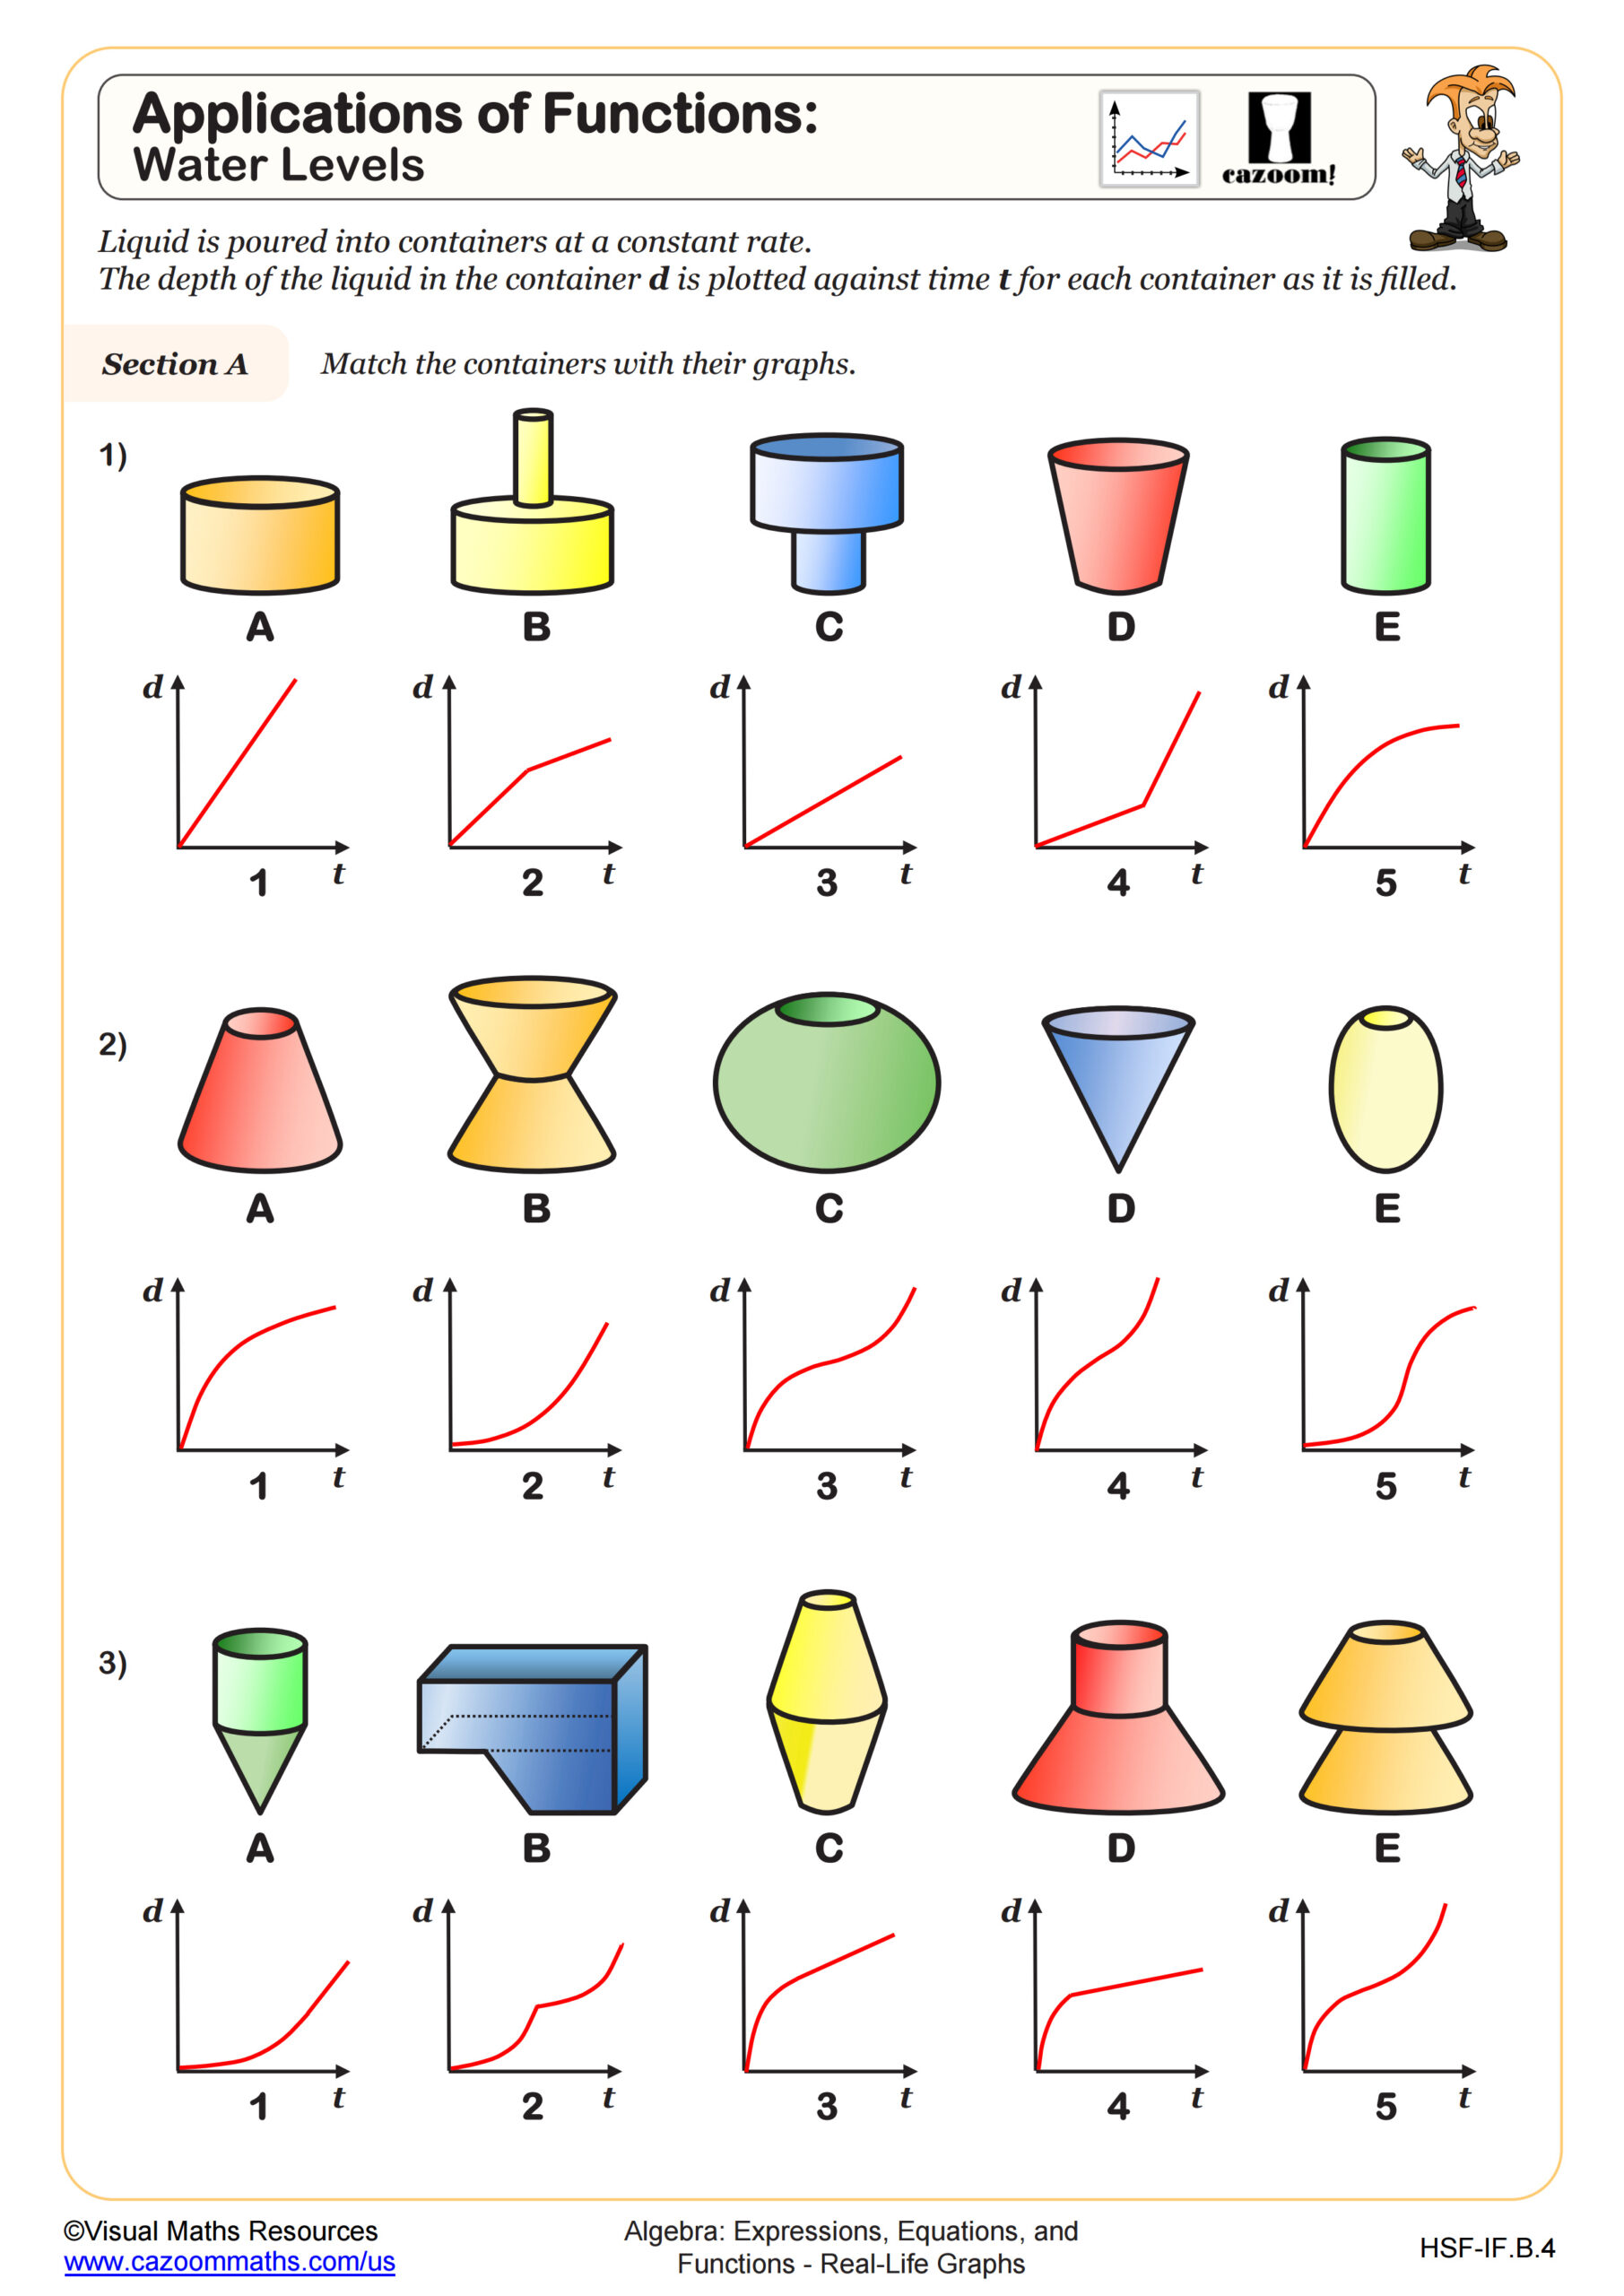
Applications of Functions: Water Levels
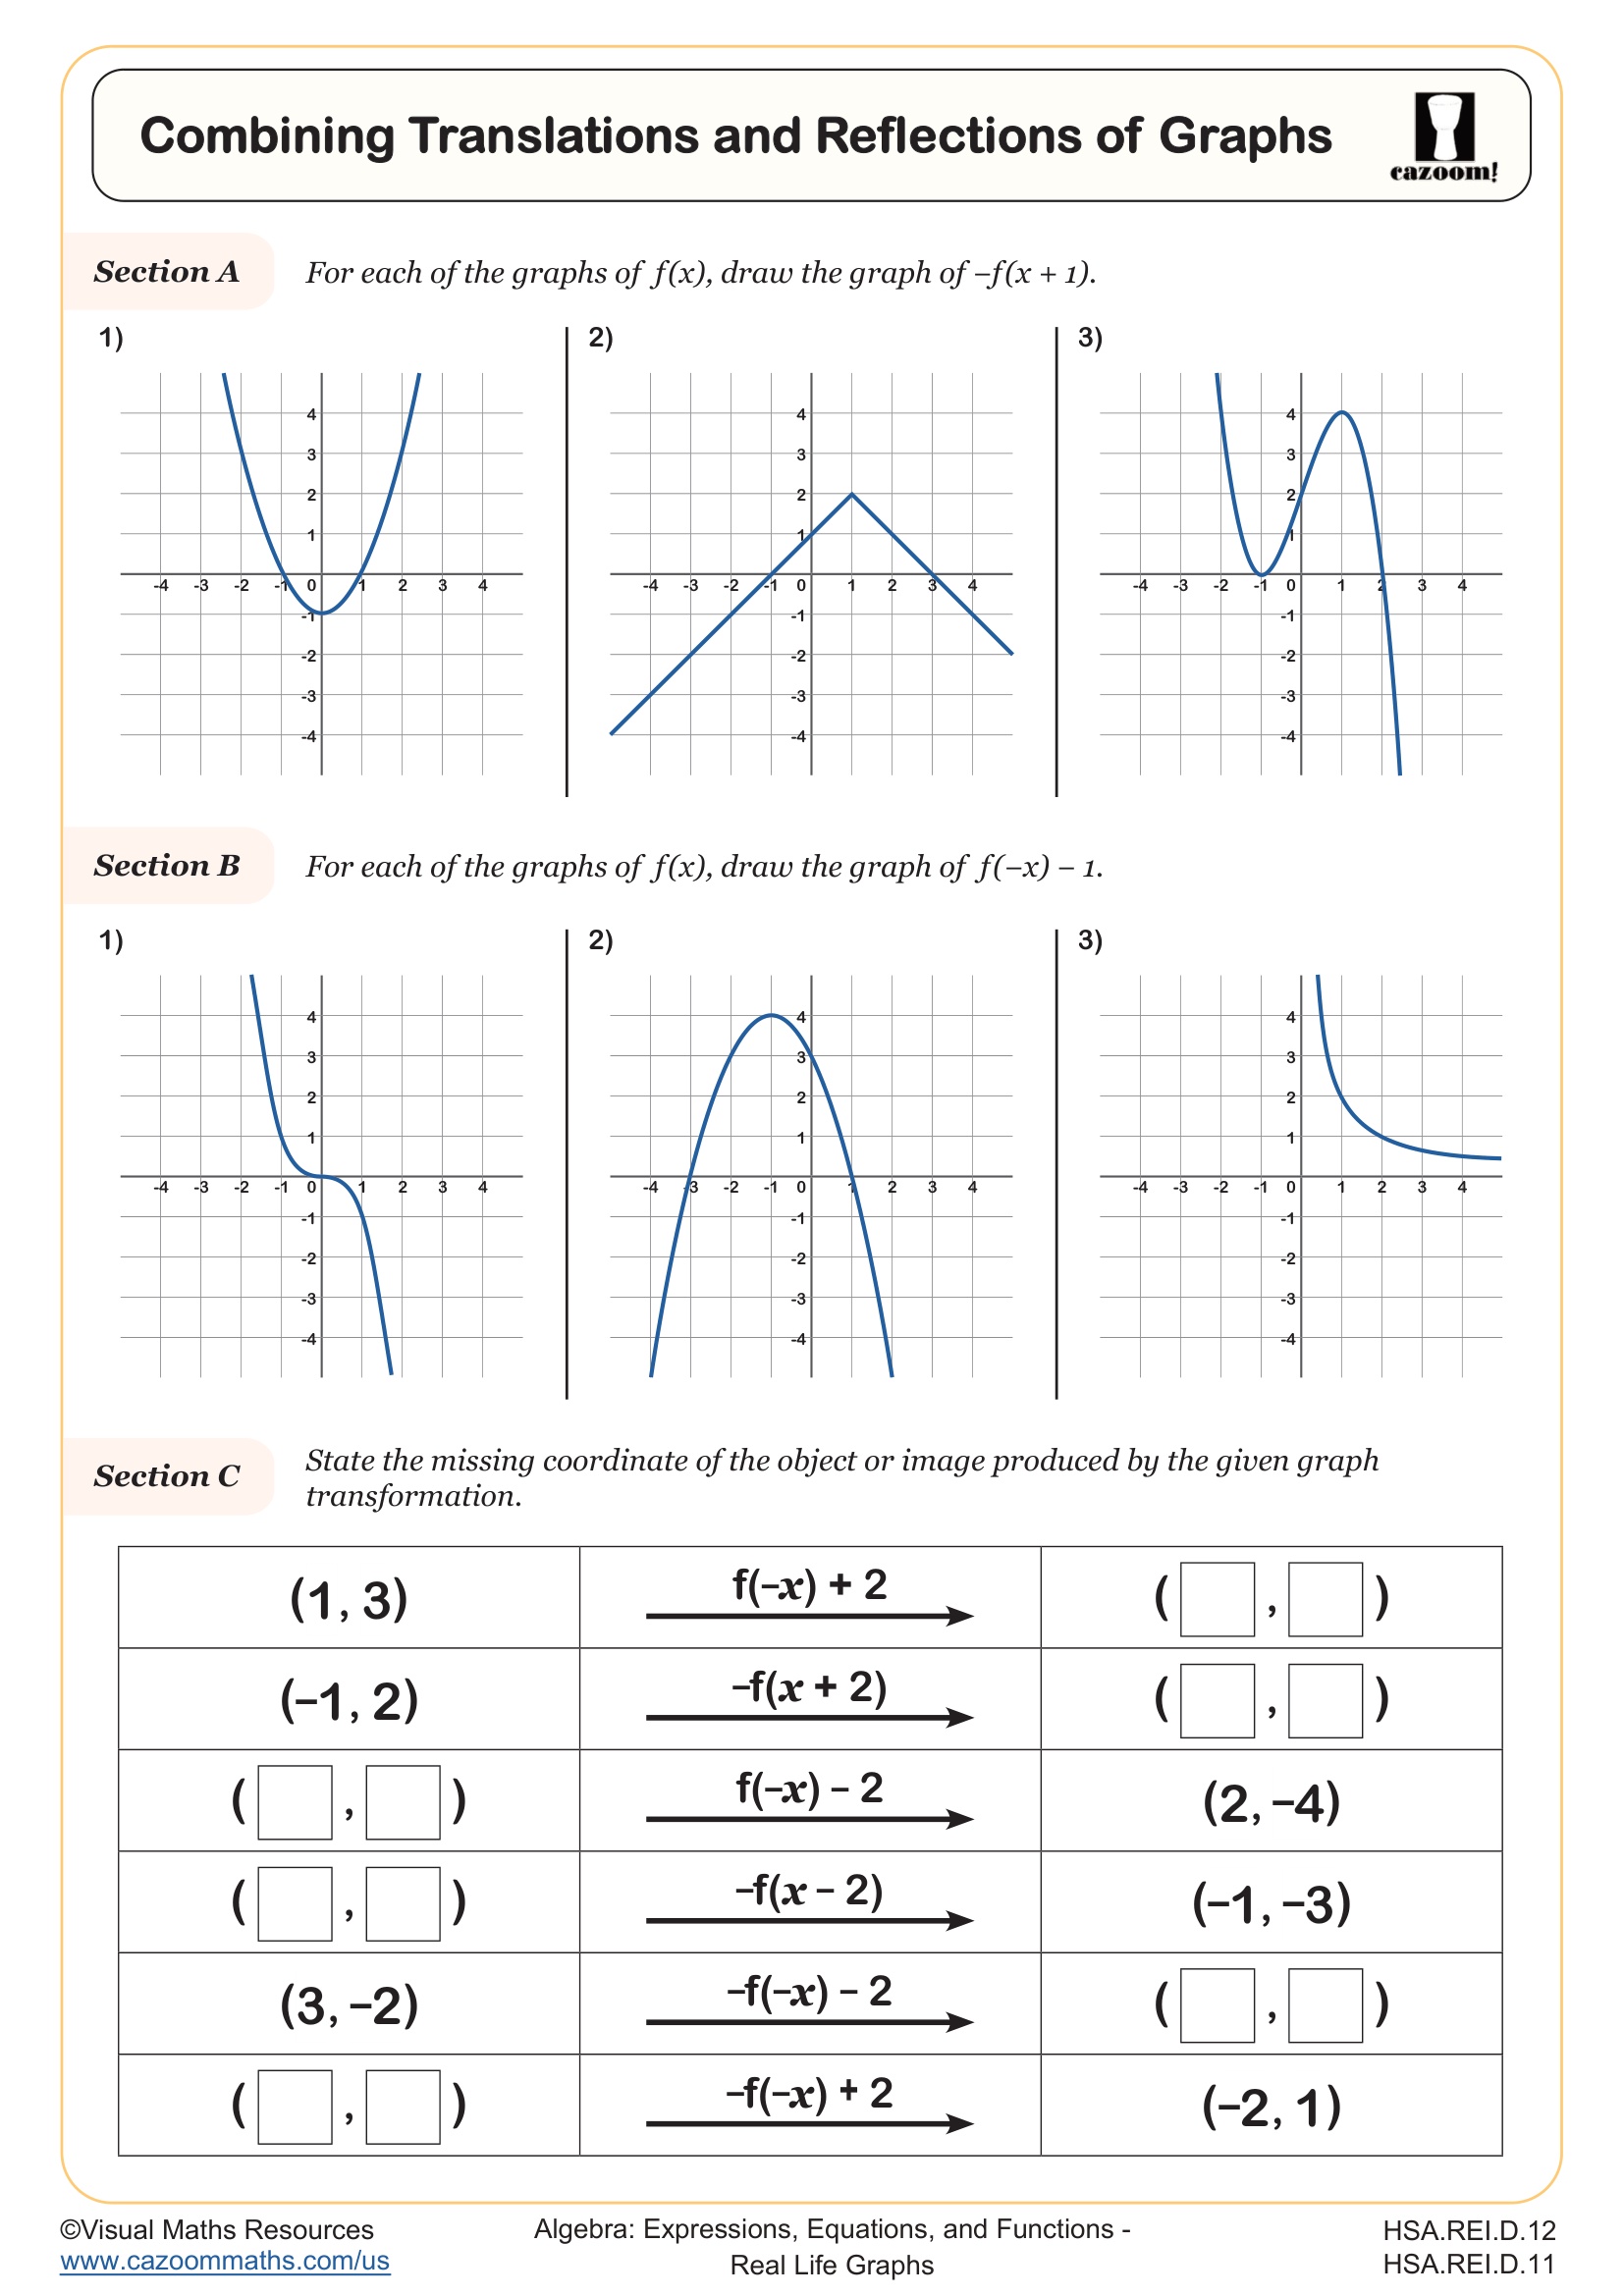
Combining Translations and Reflections of Graphs
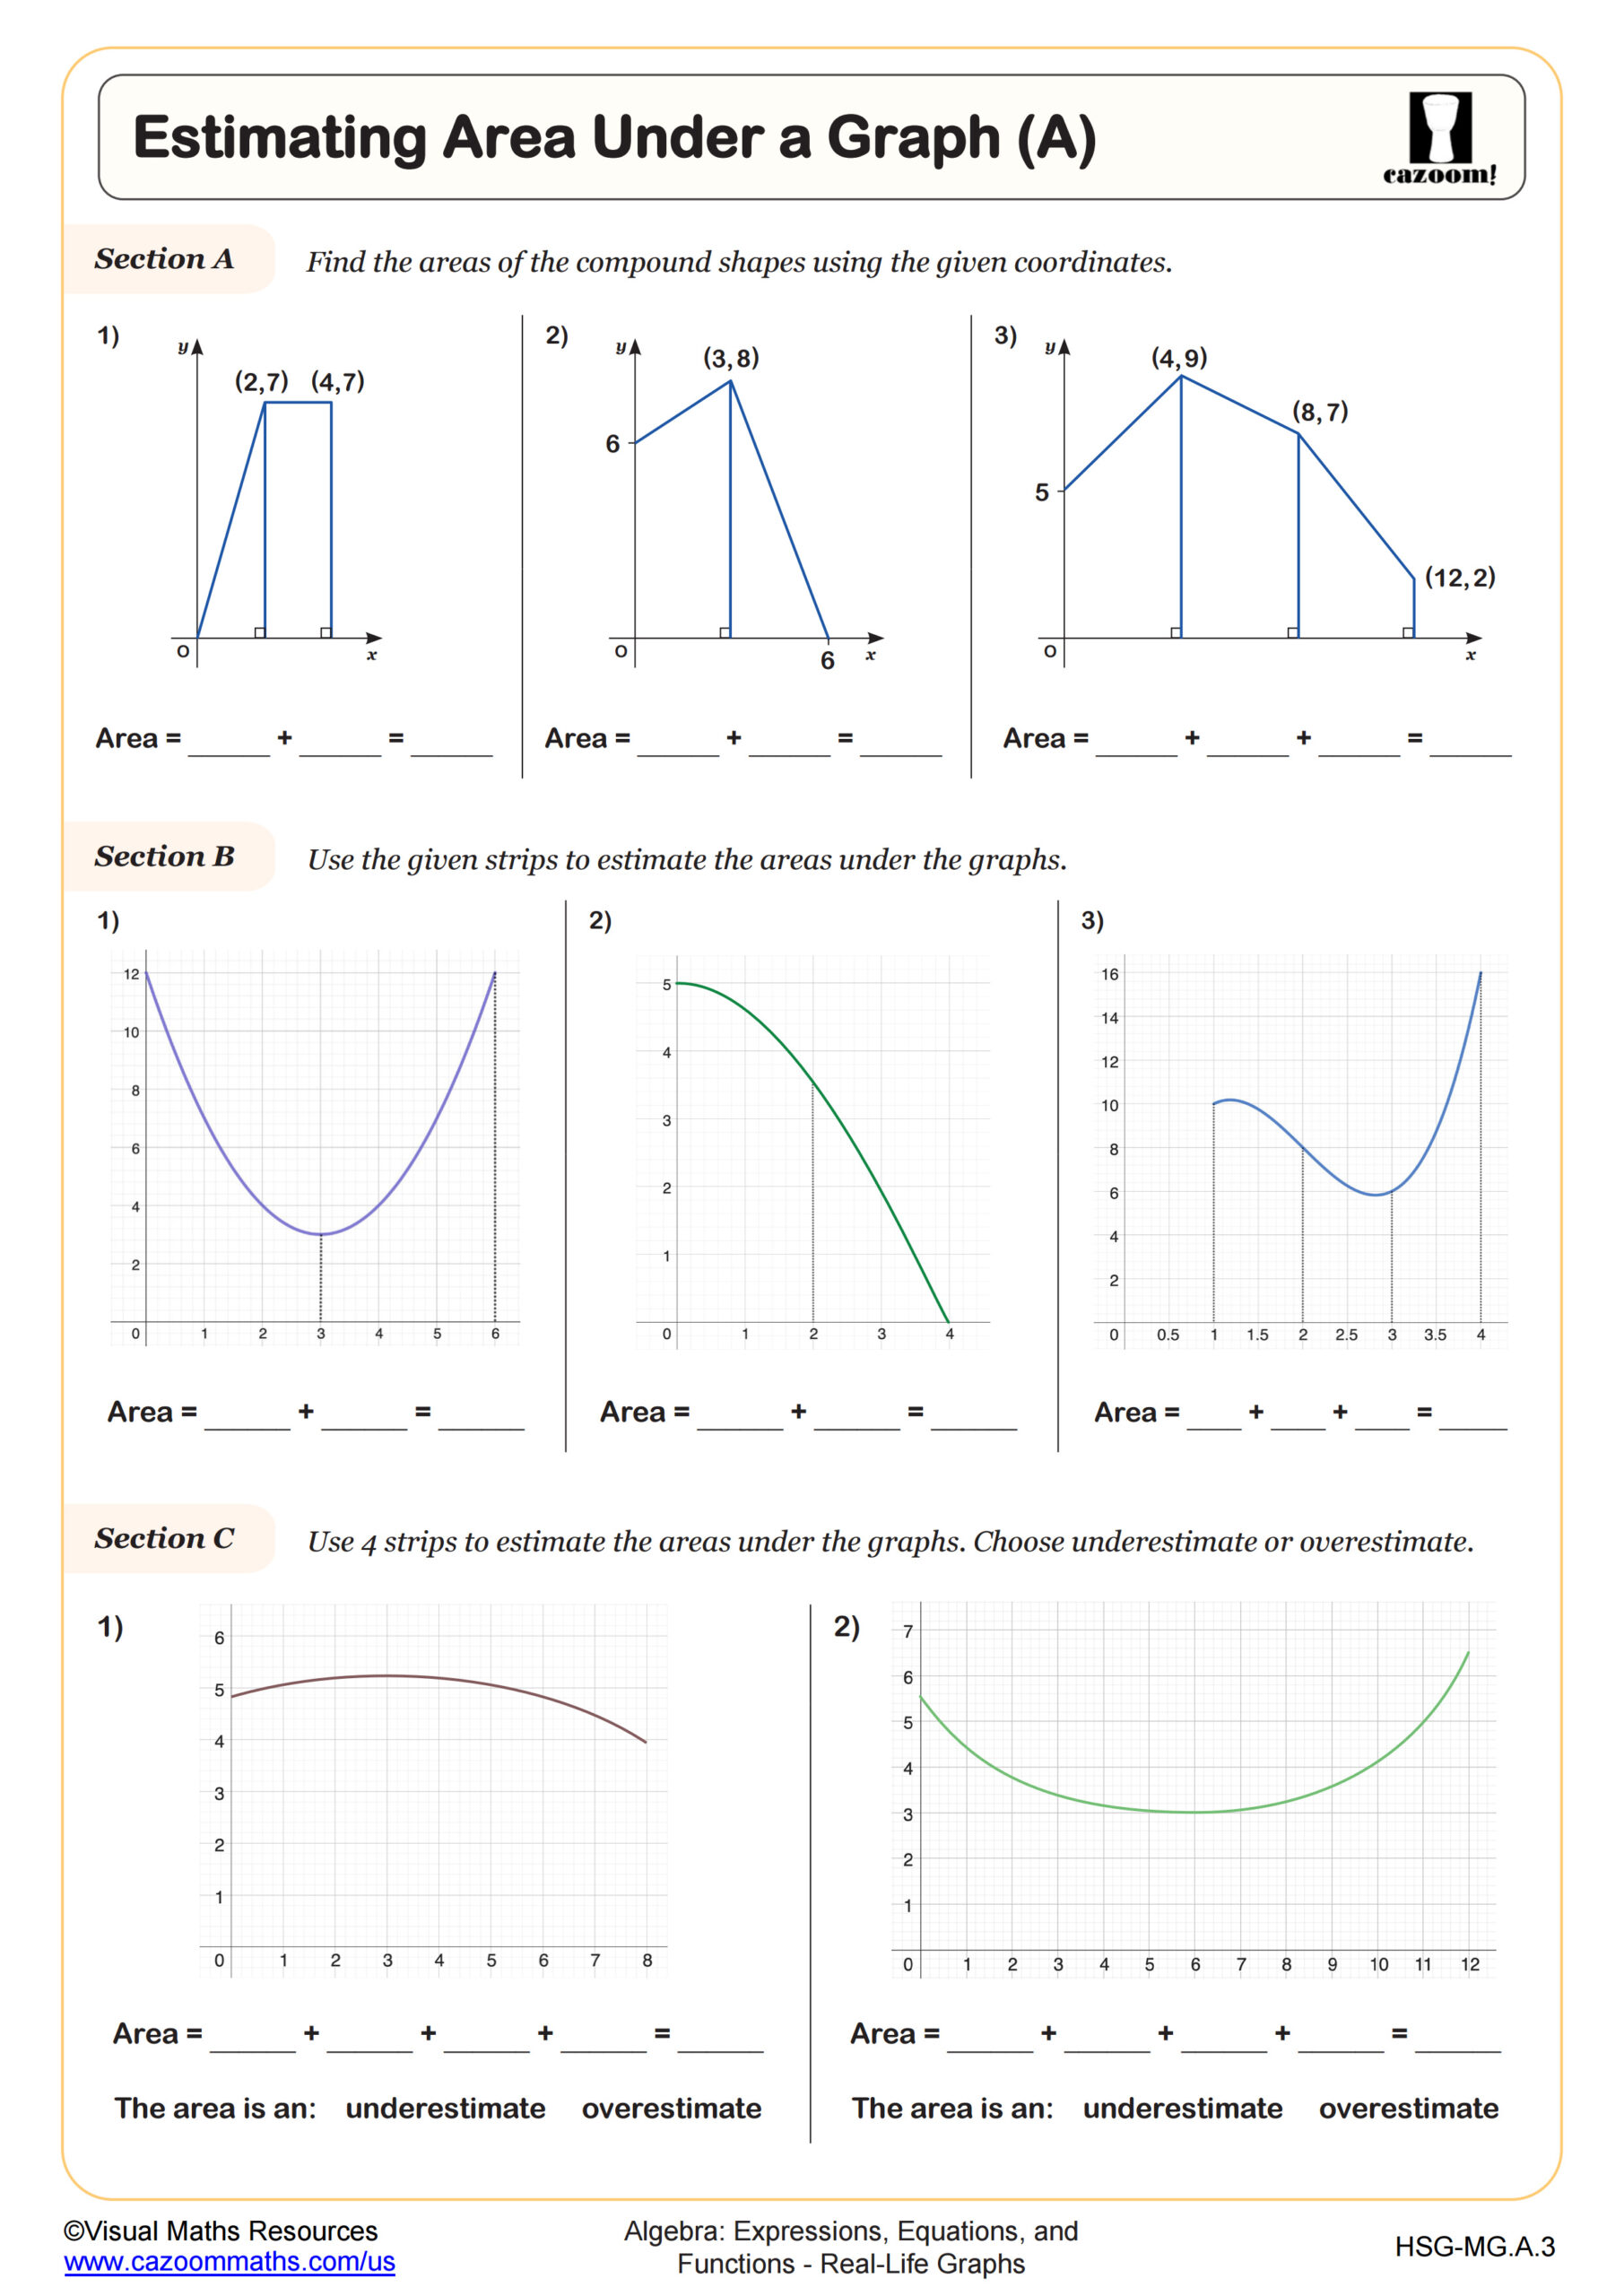
Estimating Area Under a Graph (A)
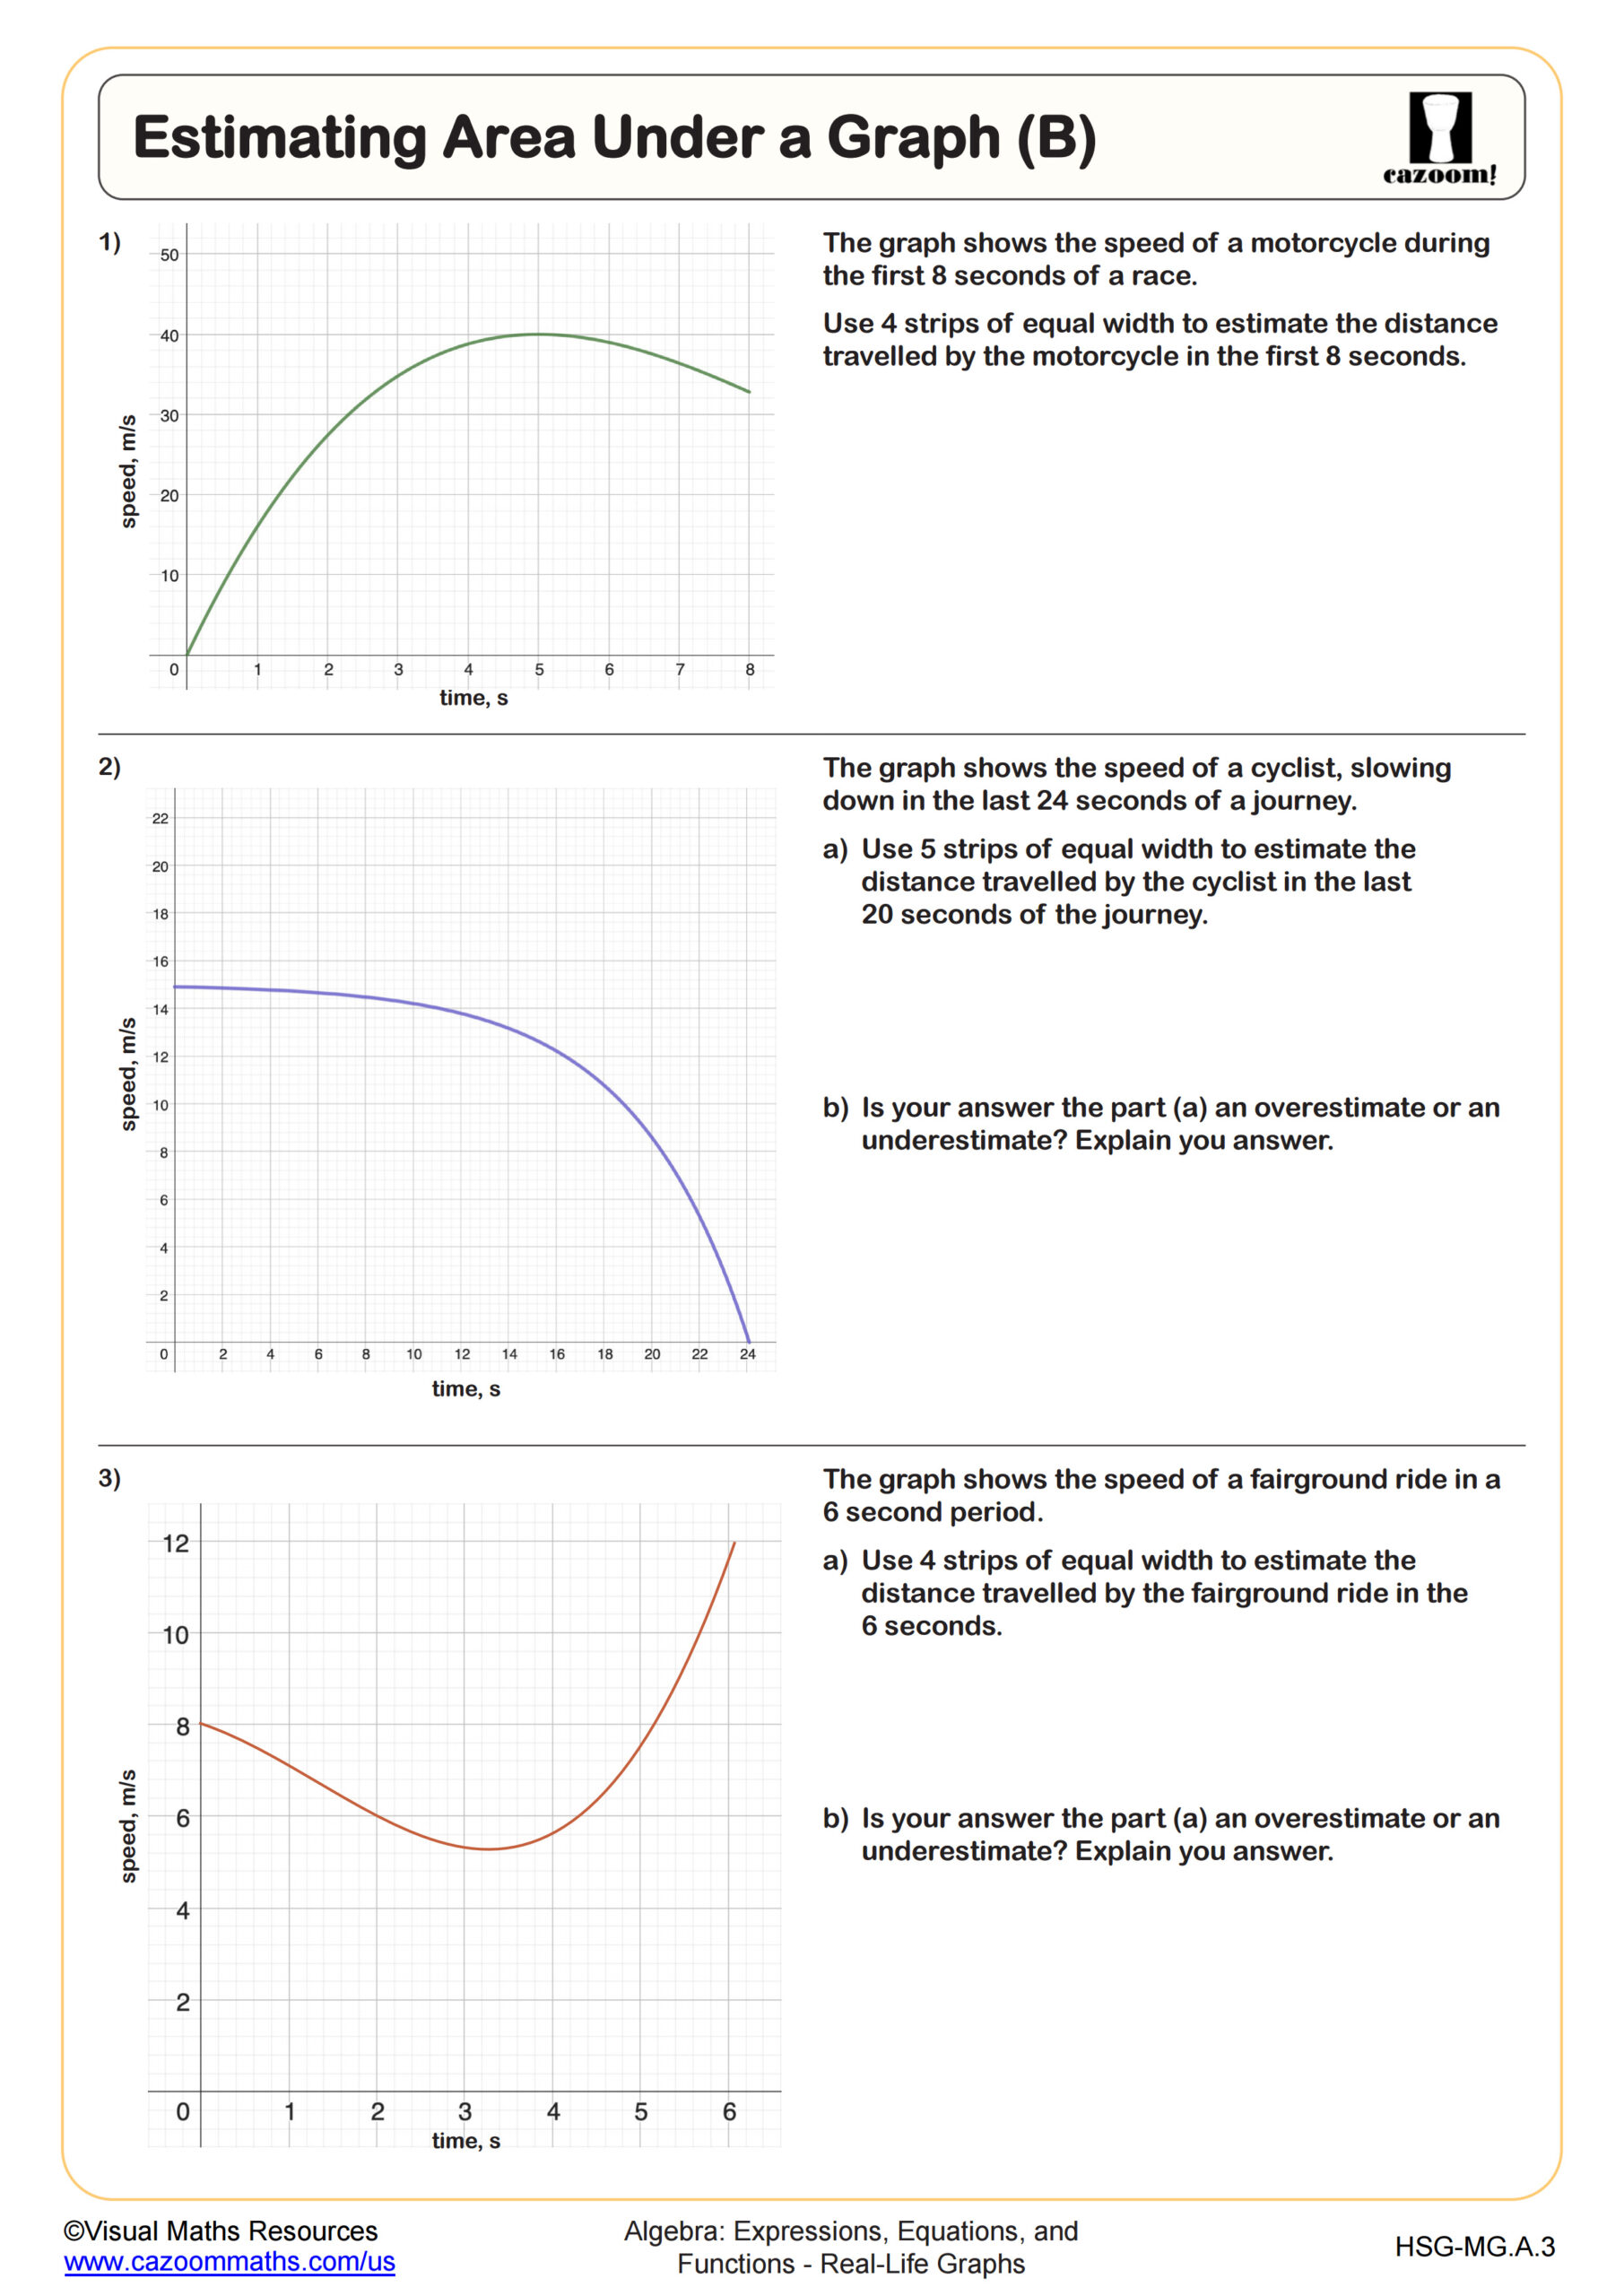
Estimating Area Under a Graph (B)
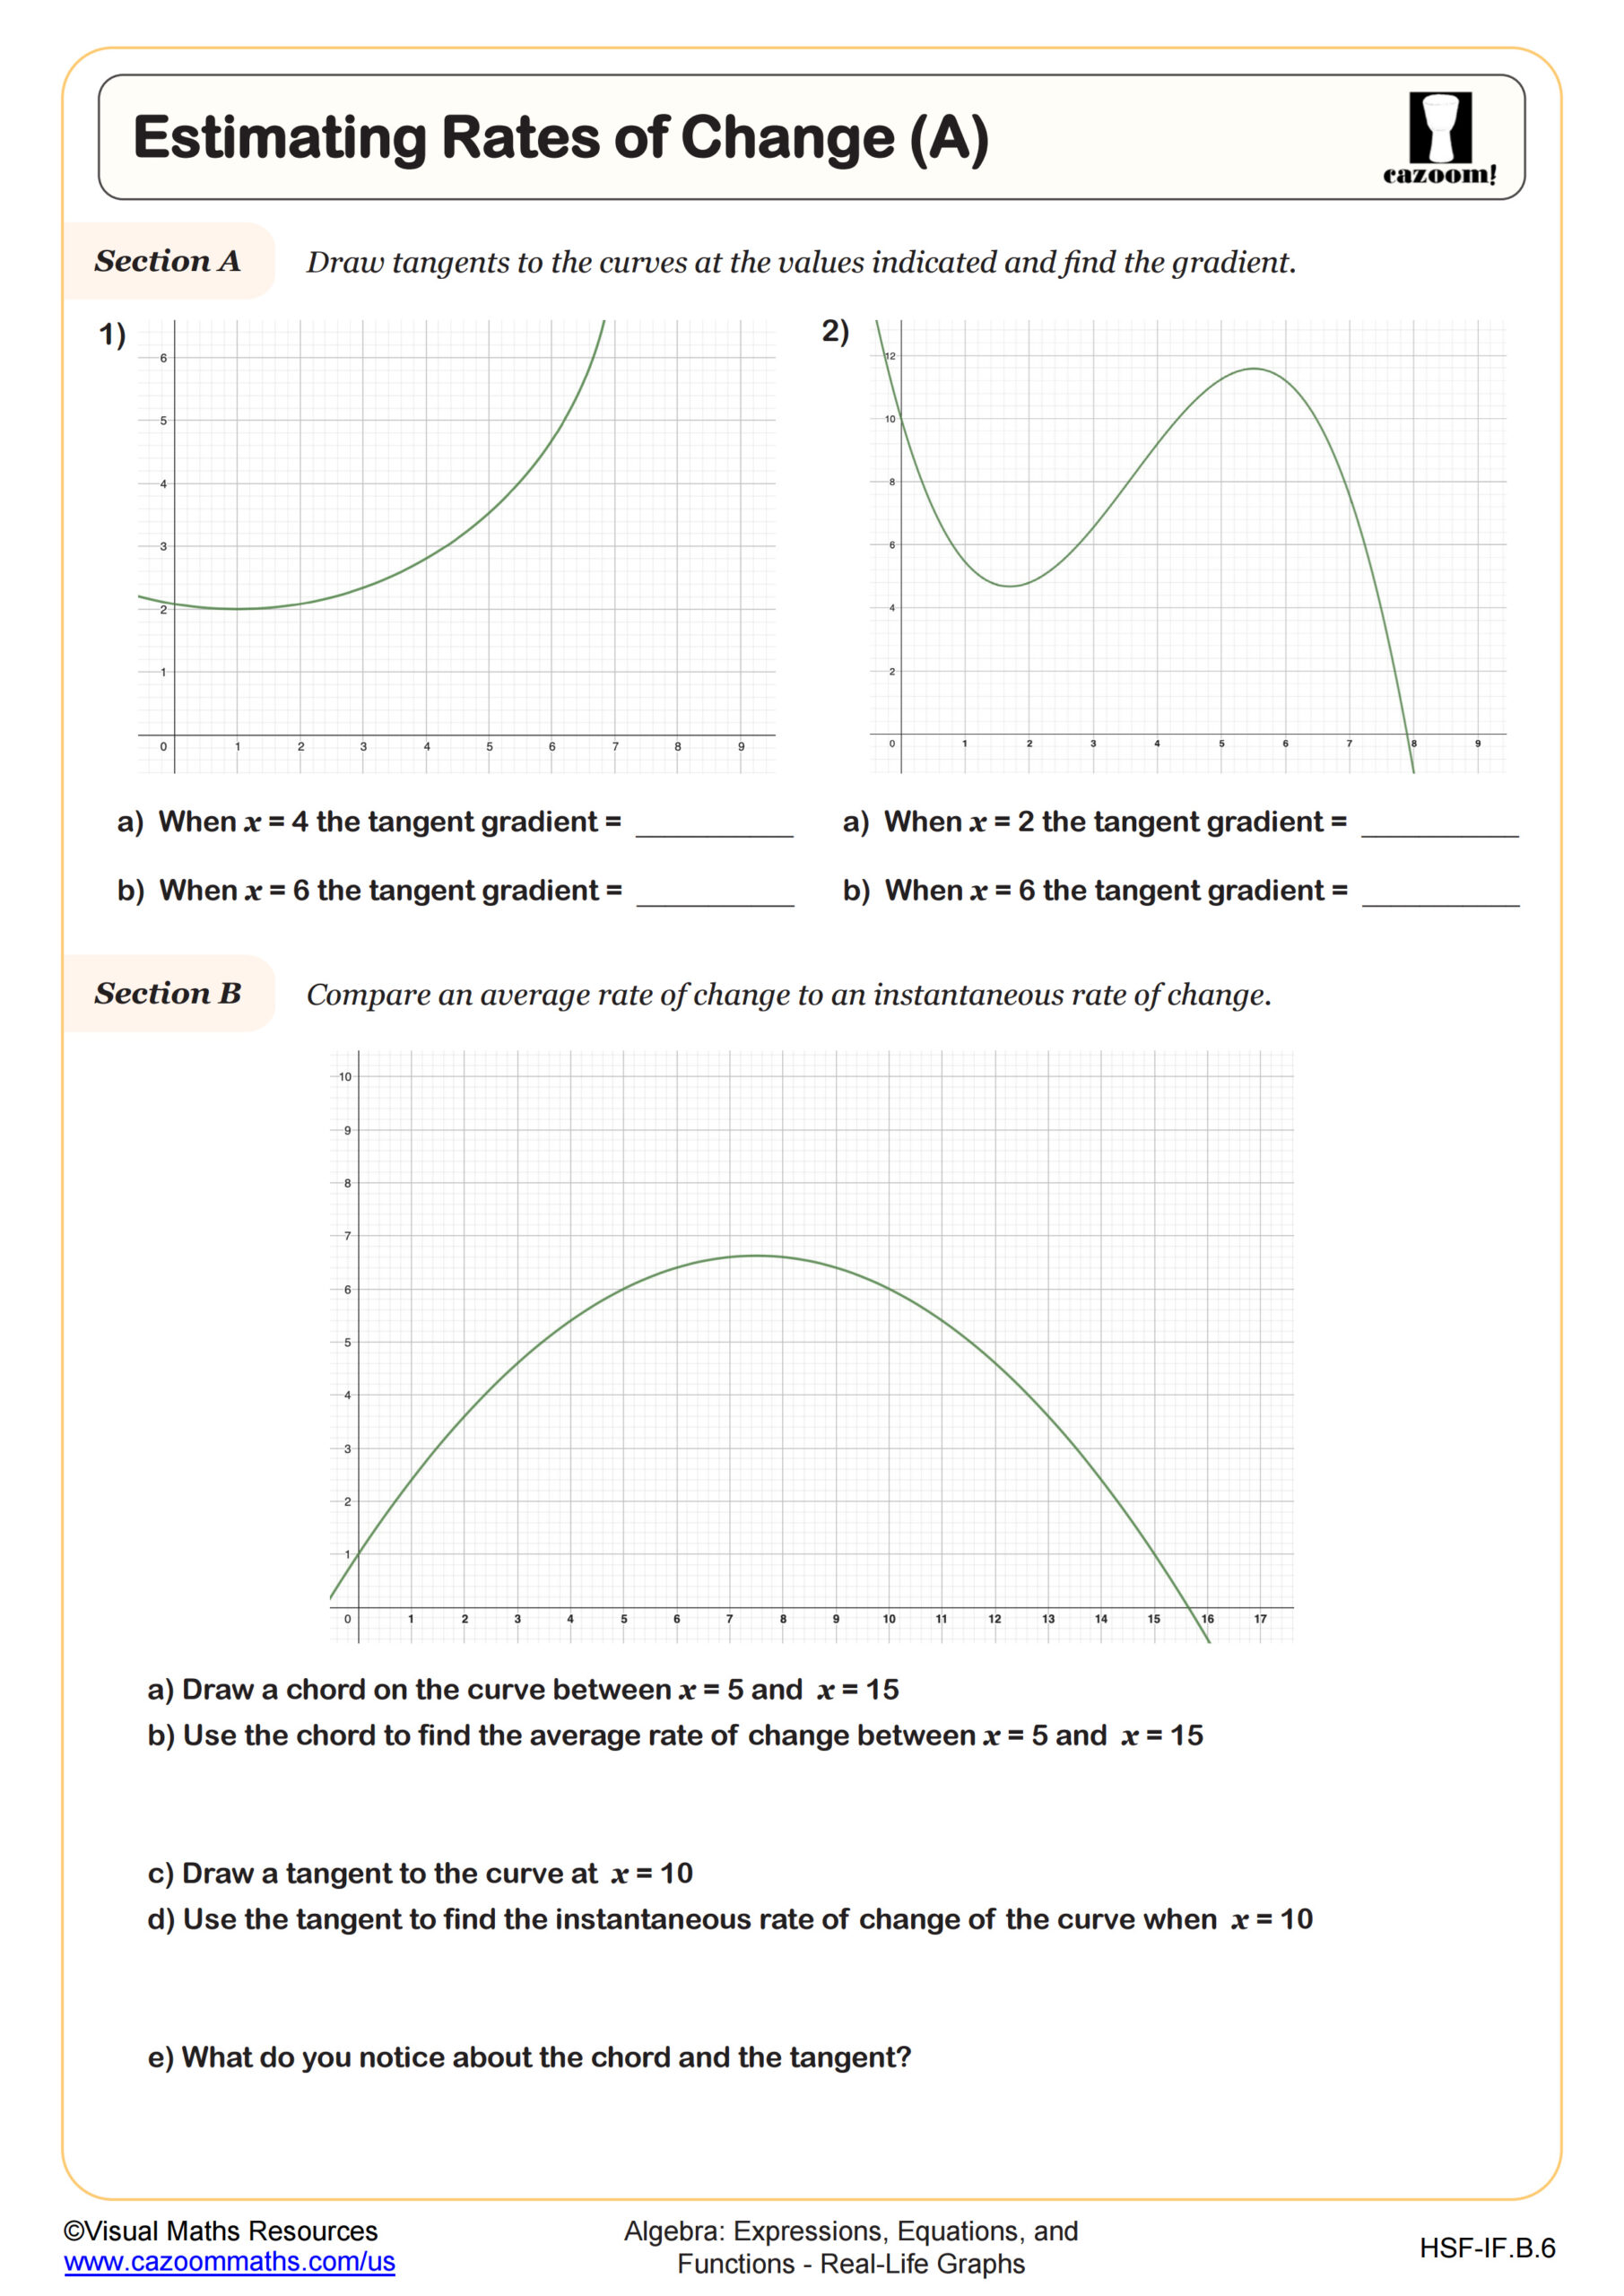
Estimating Rates of Change (A)
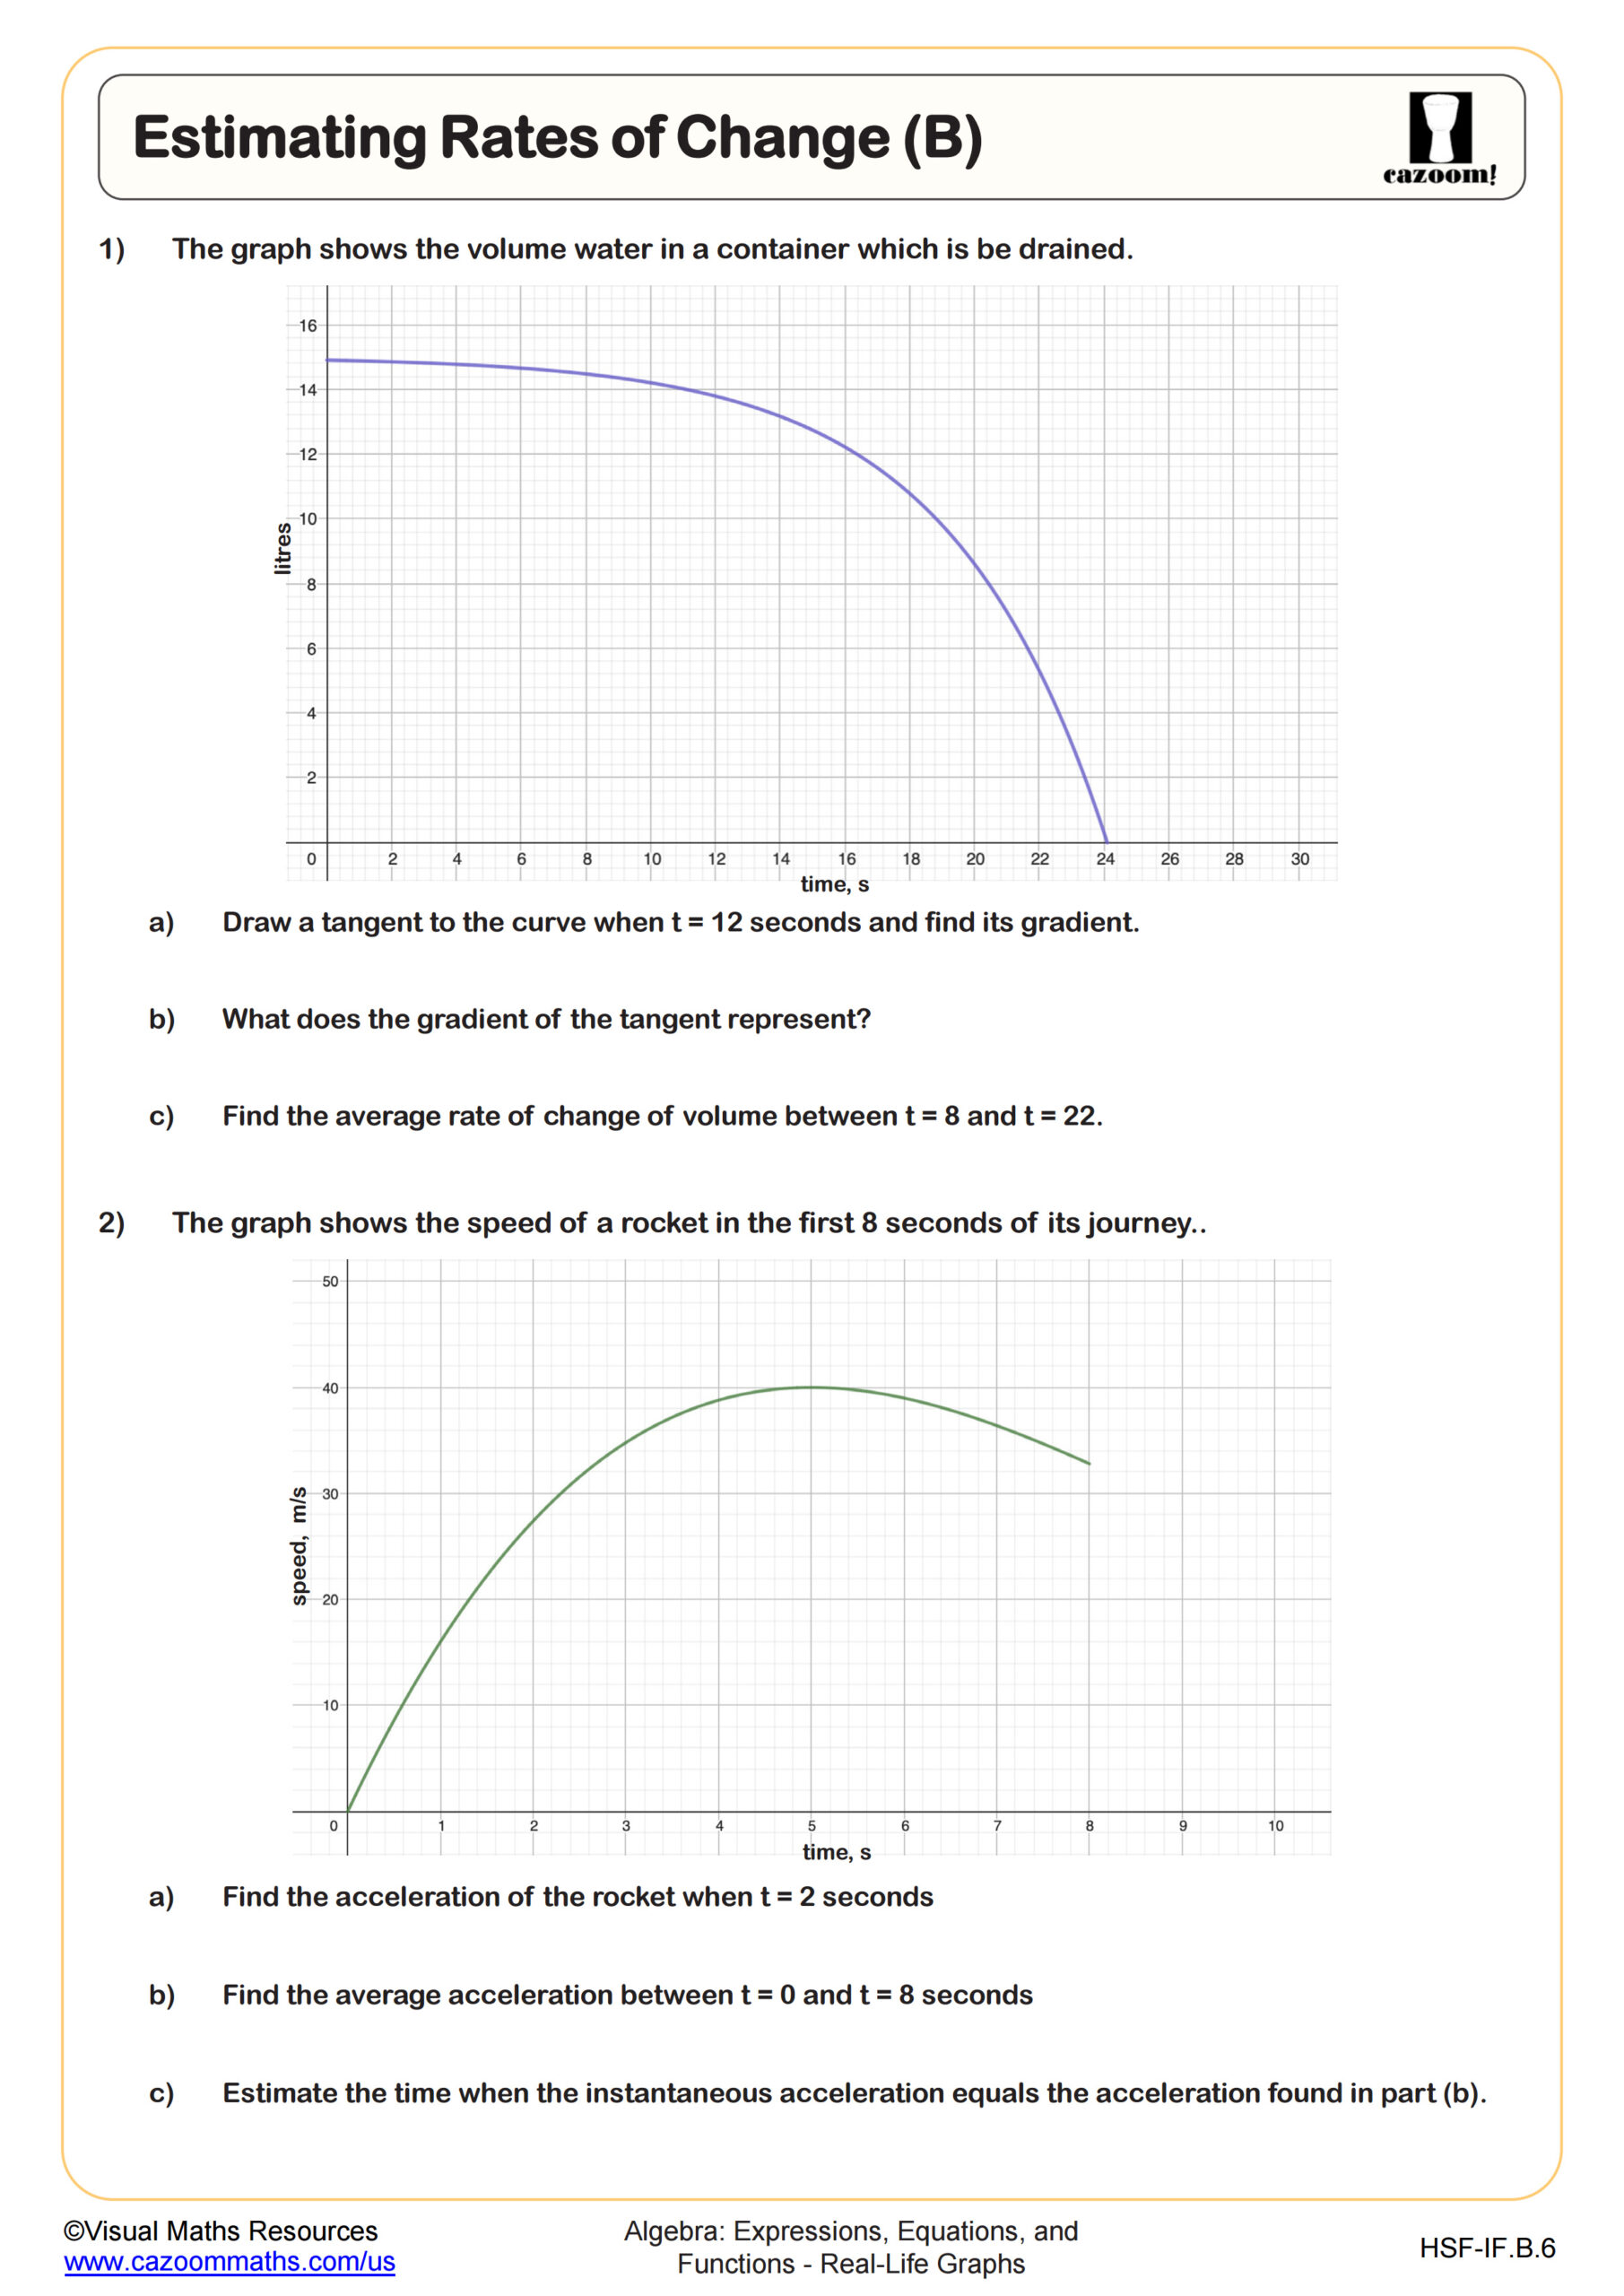
Estimating Rates of Change (B)
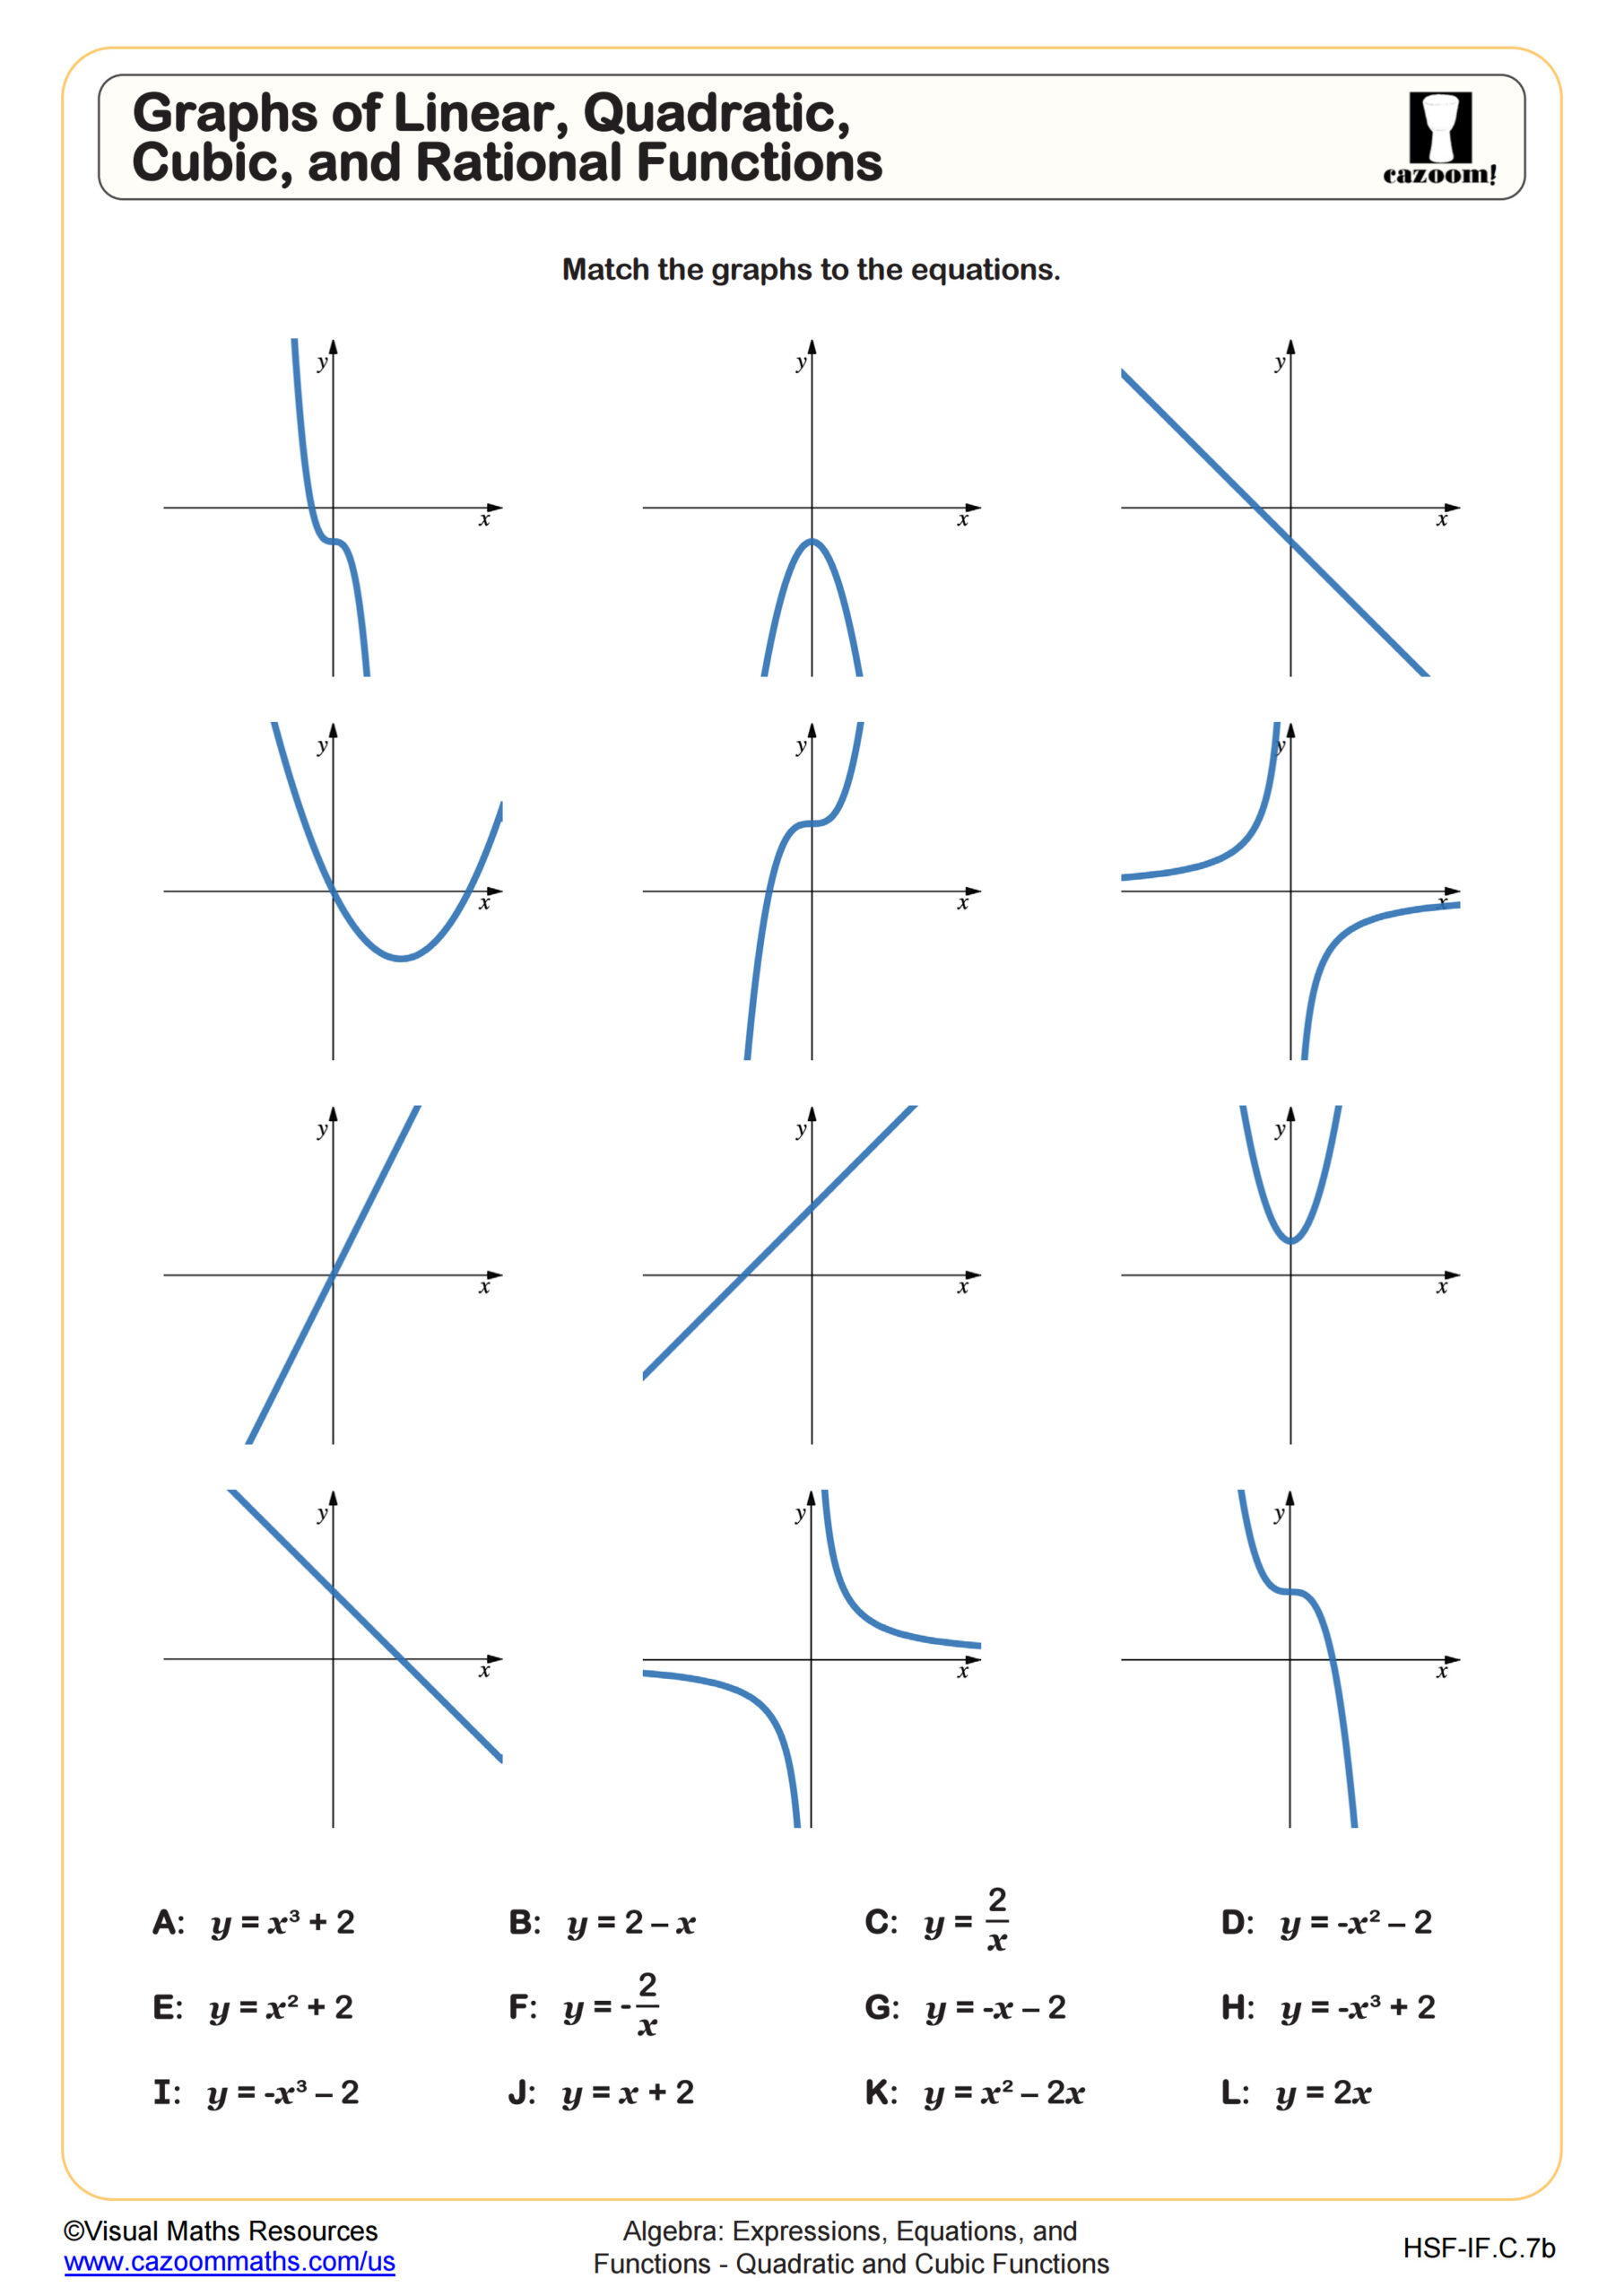
Graphs of Linear, Quadratic, Cubic, and Rational Functions
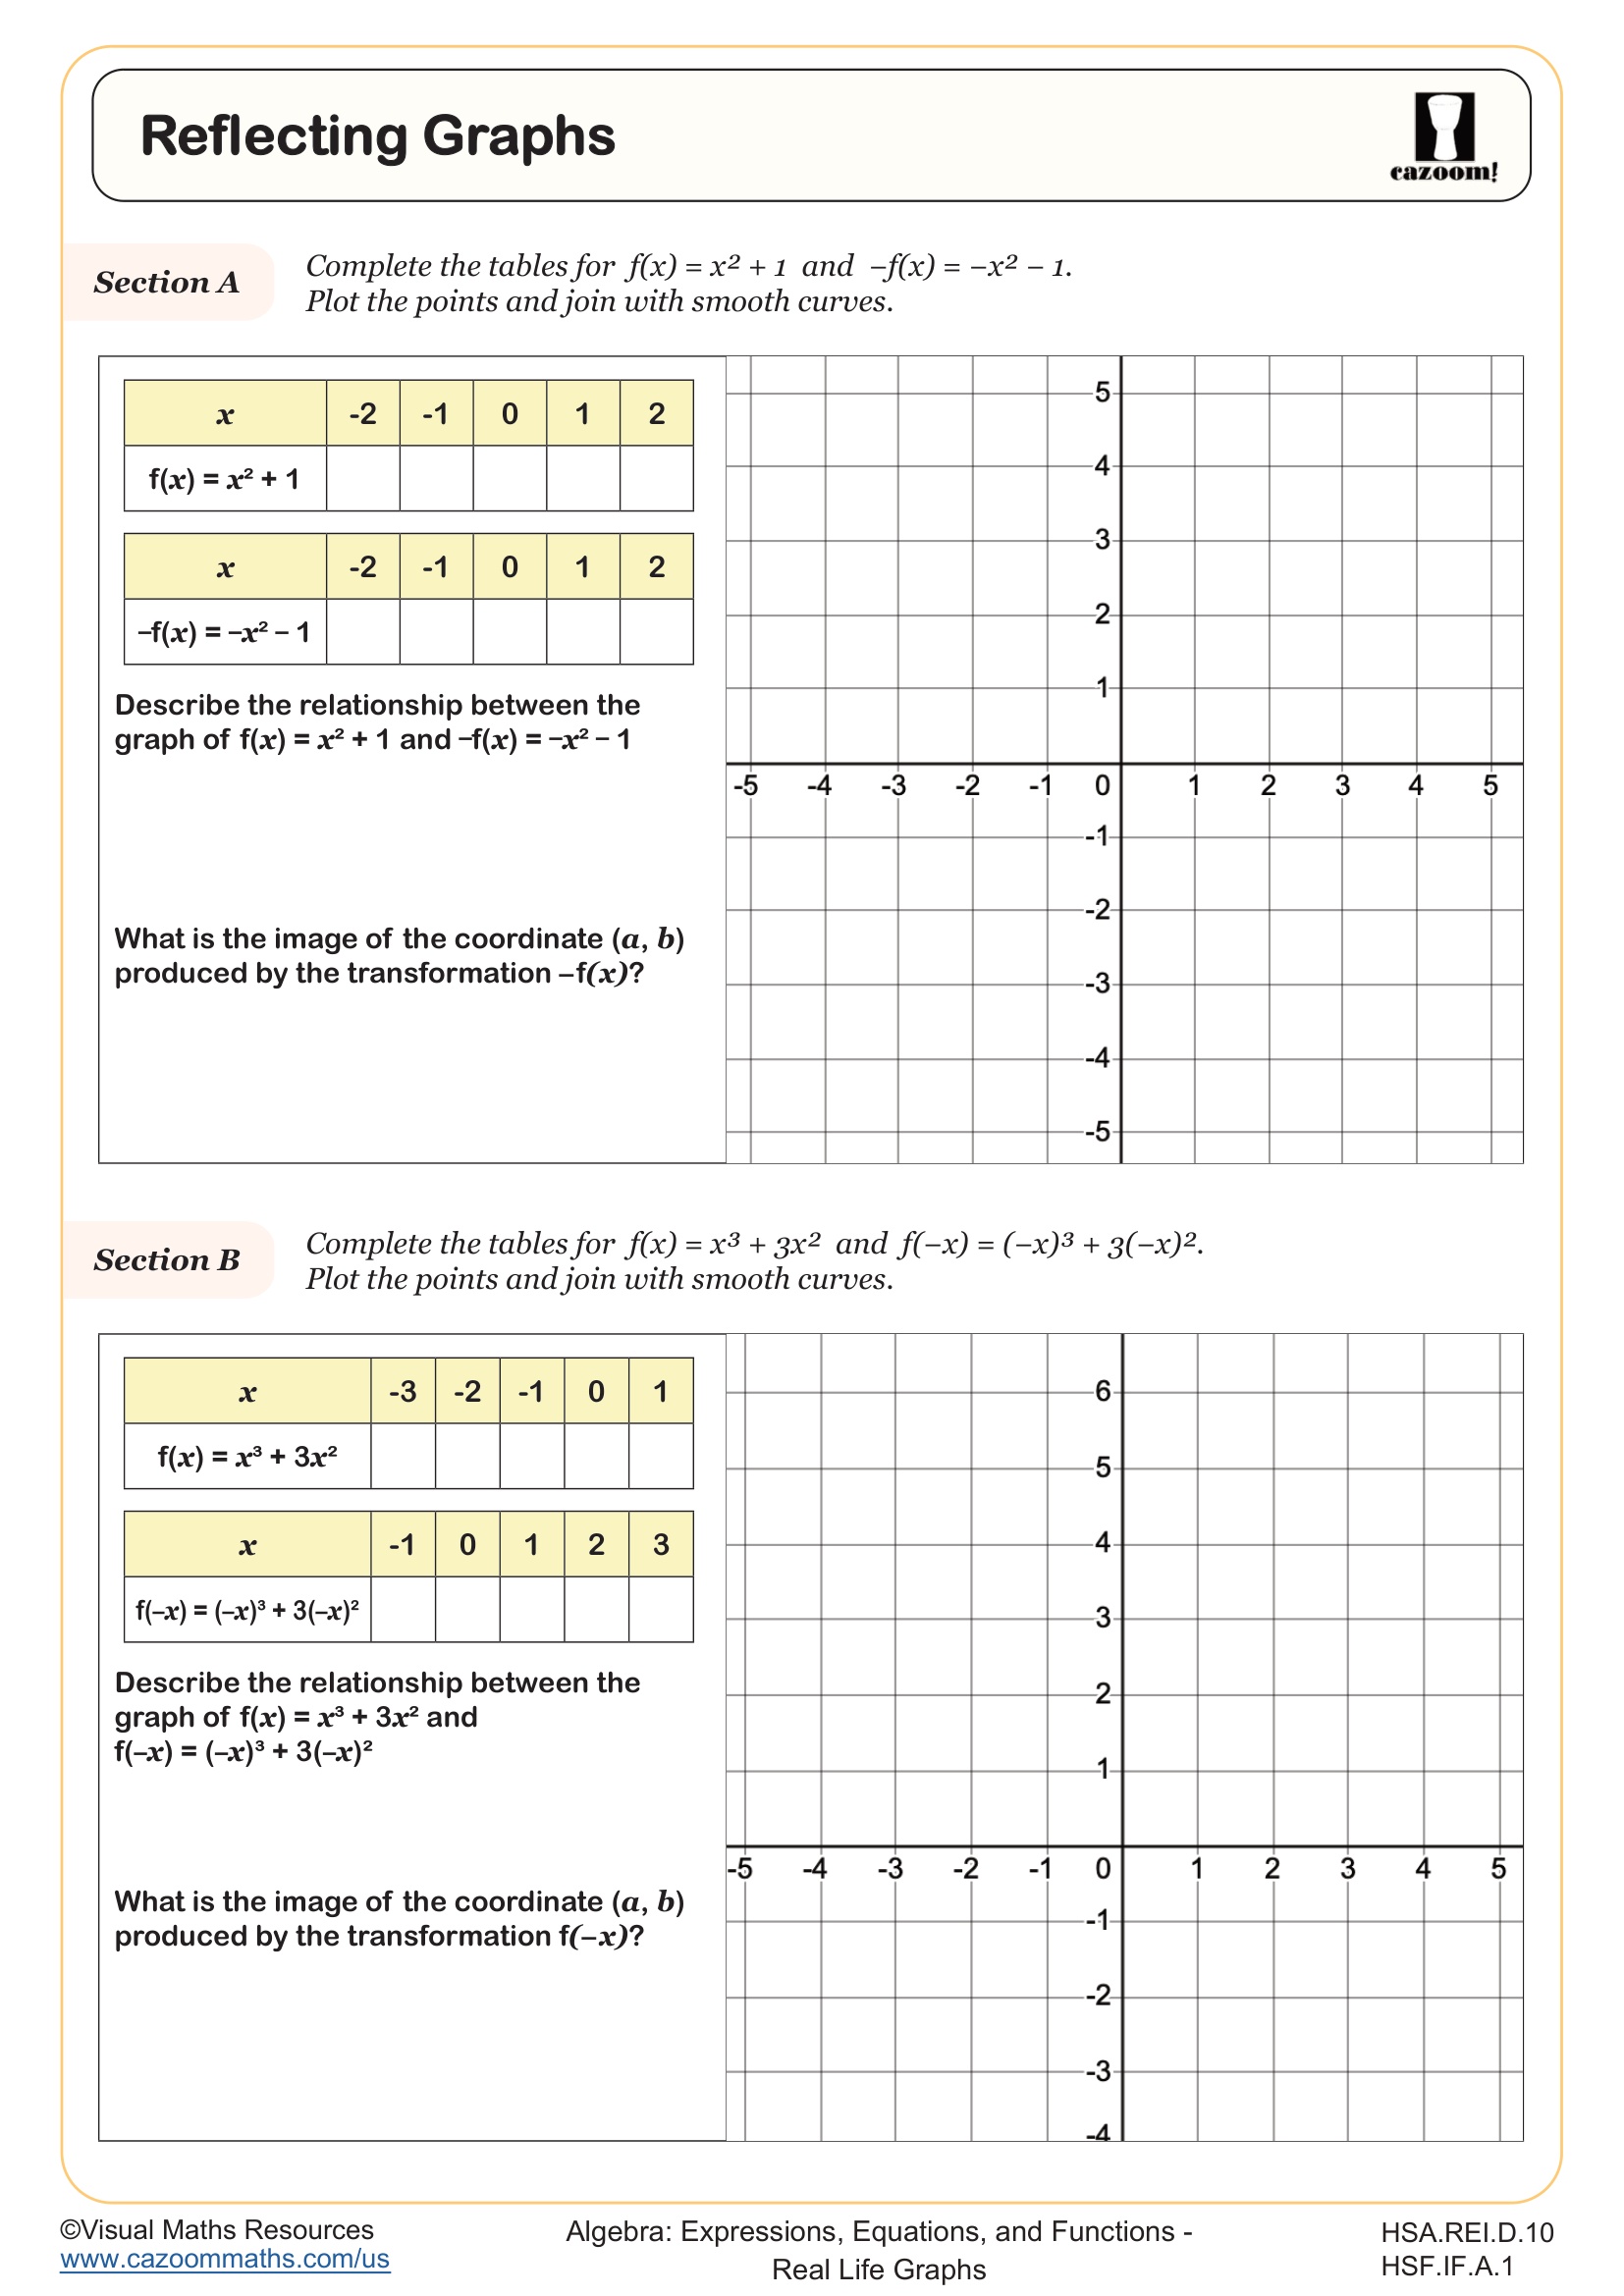
Reflecting Graphs
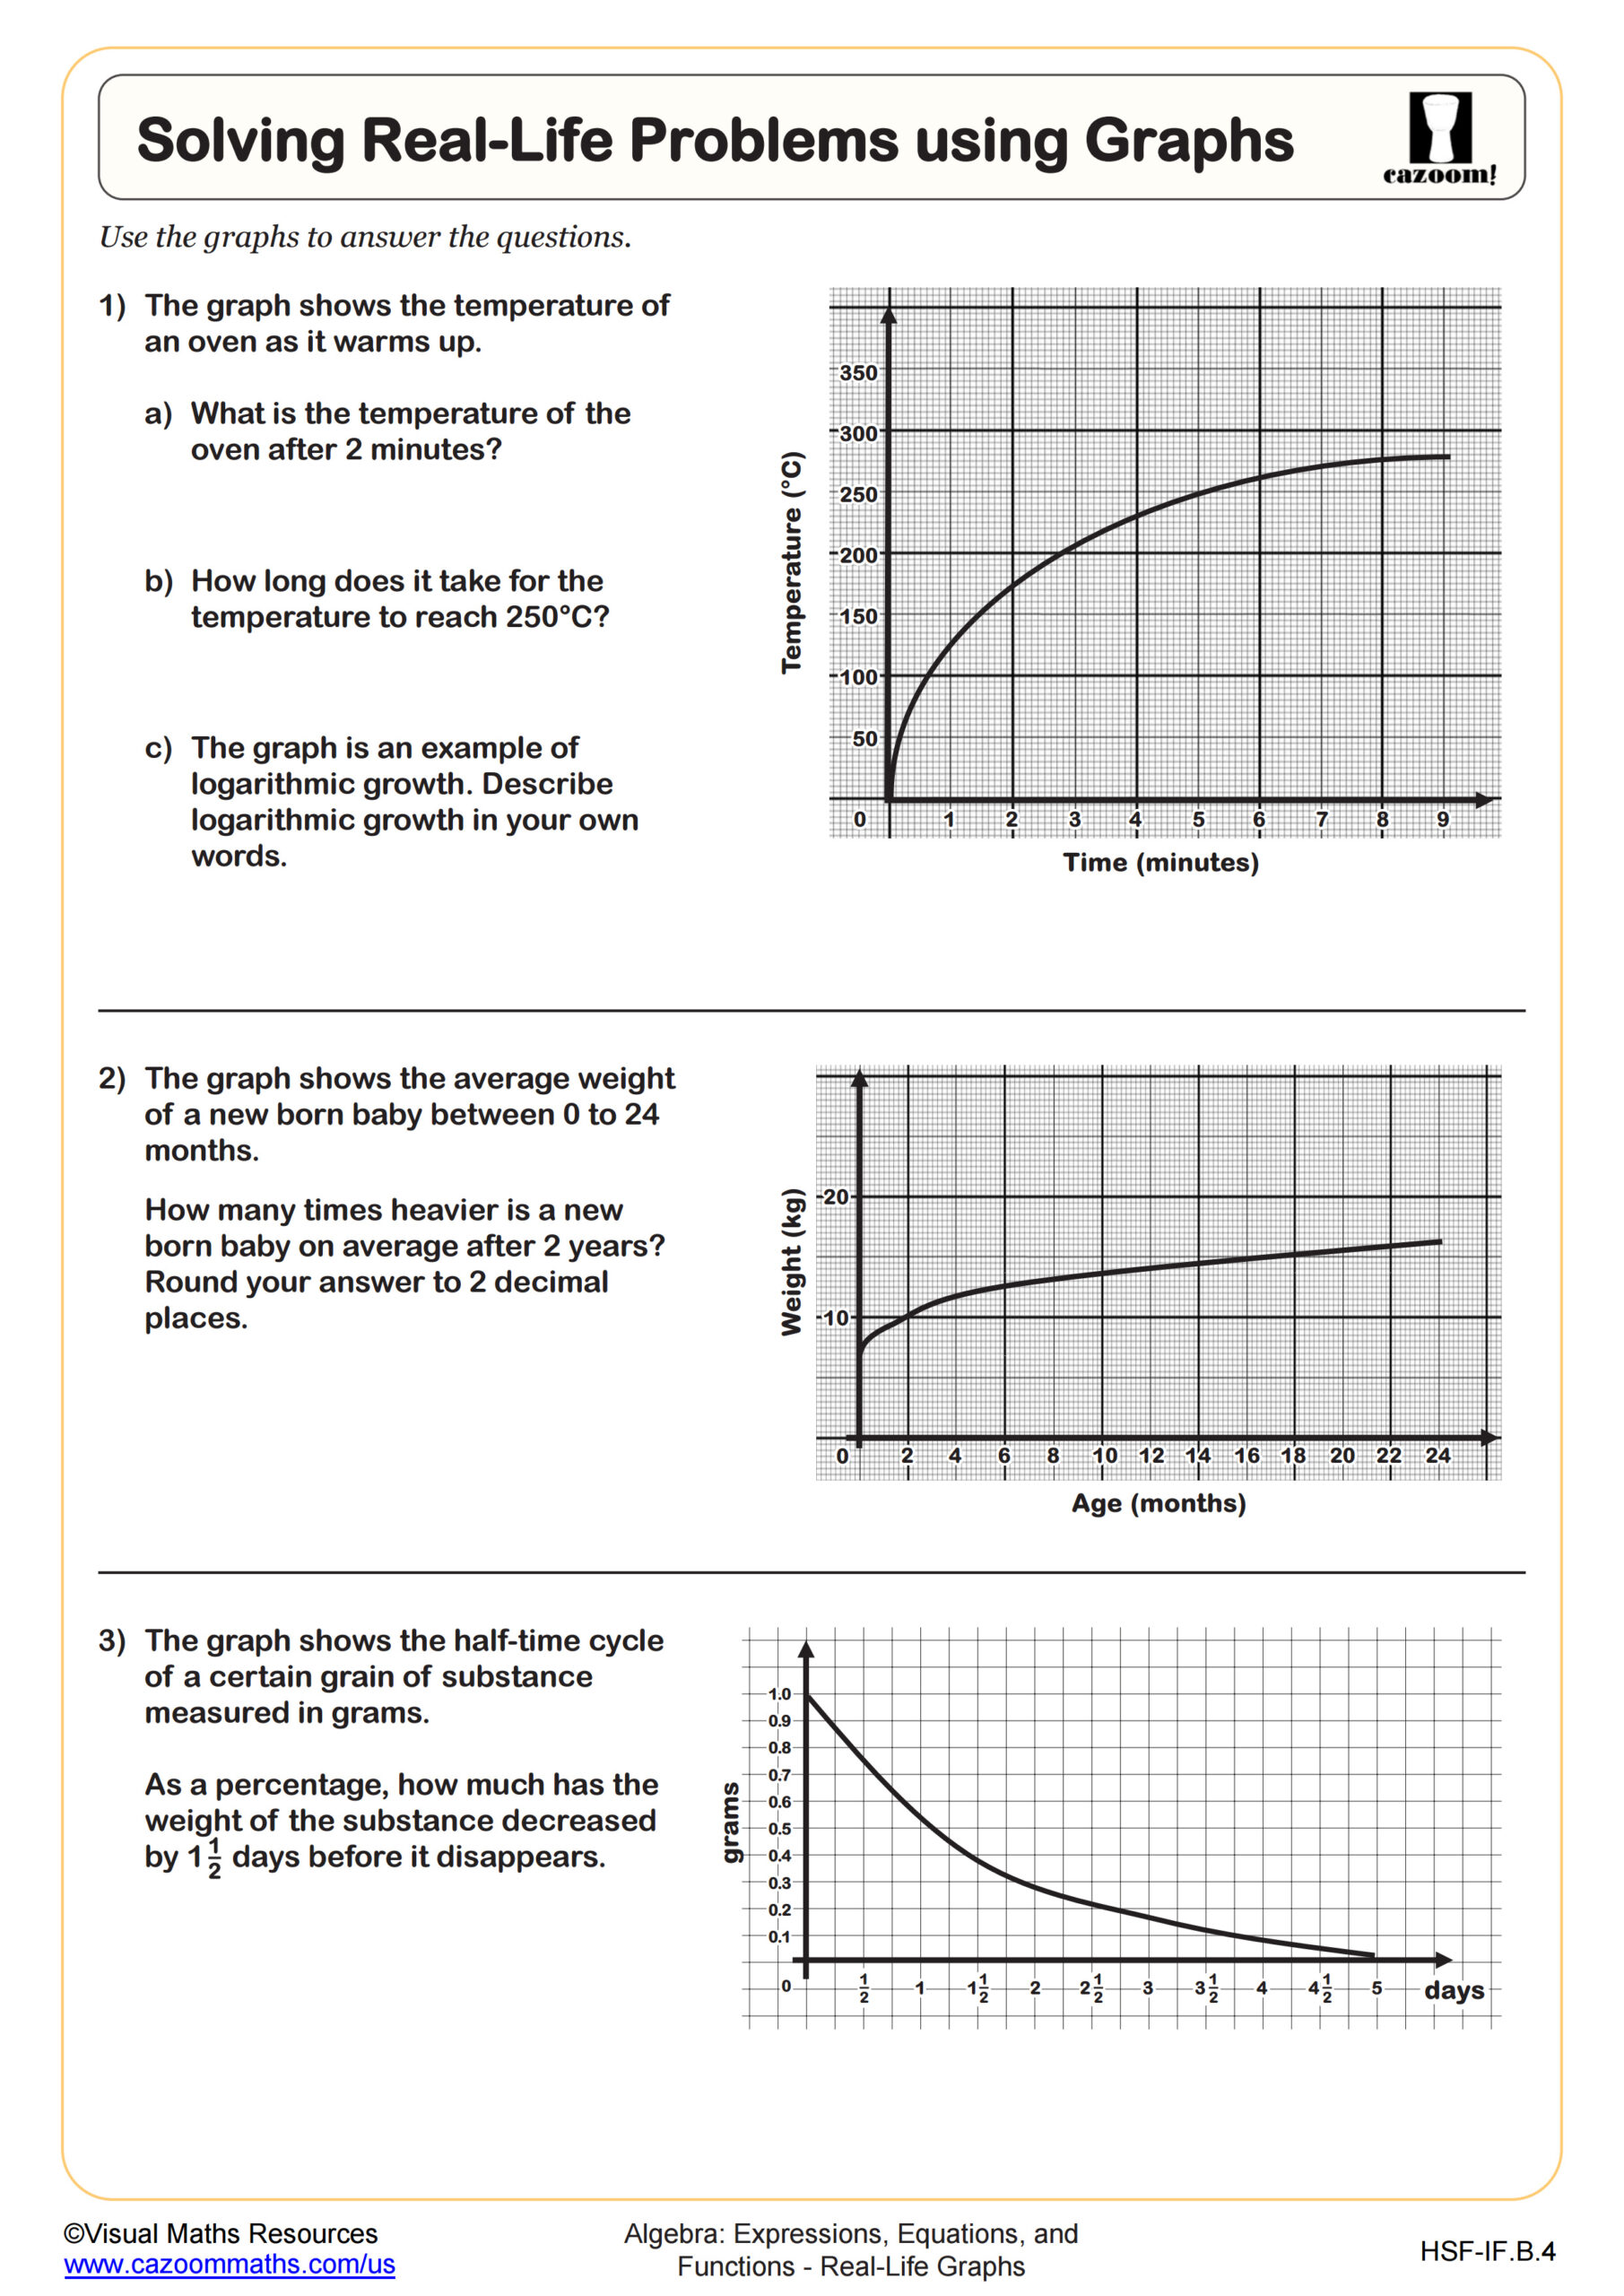
Solving Real-Life Problems using Graphs
All worksheets are created by the team of experienced teachers at Cazoom Math.
What makes effective graphing worksheets high school students can actually use?
Effective high school graphing worksheets move beyond basic plotting to focus on interpretation skills that align with Common Core standards for Functions and Algebra II. Students need practice reading domain and range from graphs, identifying increasing and decreasing intervals, and connecting mathematical representations to real-world contexts.
Teachers notice students often misread scale markings or confuse correlation with causation when interpreting data trends. Quality worksheets include varied scales, non-linear progressions, and questions that require students to justify their interpretations using mathematical language rather than just identifying coordinates.
How do reading graphs worksheets progress through high school grade levels?
Reading graphs worksheets high school curricula typically start with linear relationships in Algebra I, then advance to quadratic and exponential functions in Algebra II and Precalculus. Ninth graders focus on slope interpretation and rate of change, while upper classmen analyze transformations, asymptotes, and complex function behaviors.
By senior year, students should interpret piecewise functions, analyze continuity, and connect graphical features to algebraic properties. Teachers find that students who master graph interpretation in earlier grades show stronger performance in calculus courses, where visual understanding of limits and derivatives becomes focused for success.
What common errors appear on interpreting graphs worksheet assignments?
Students frequently misinterpret the meaning of intercepts, treating them as simple coordinate points rather than meaningful values in context. On distance-time graphs, many incorrectly assume that steeper lines always mean "going faster" without considering the actual scale or units involved.
Another persistent error involves confusing dependent and independent variables, especially when graphs show unconventional orientations. Teachers report that students often struggle with piecewise functions, missing the significance of open and closed circles at boundary points, which affects their understanding of domain restrictions and function continuity.
How should teachers structure analyzing graphs worksheet practice sessions?
Teachers find success when they begin each analyzing graphs worksheet session with a brief review of scale reading and axis labels before students attempt interpretation questions. Modeling the thought process aloud helps students develop systematic approaches to graph analysis rather than guessing based on visual patterns.
Structuring practice with partner discussions allows students to verbalize their reasoning and catch misconceptions early. Teachers report better retention when students explain their interpretations to classmates, particularly for complex scenarios involving multiple variables or non-standard coordinate systems that appear in advanced placement courses.