High School Statistics Worksheets
All worksheets are created by the team of experienced teachers at Cazoom Math.
What statistics topics do high school students need to master?
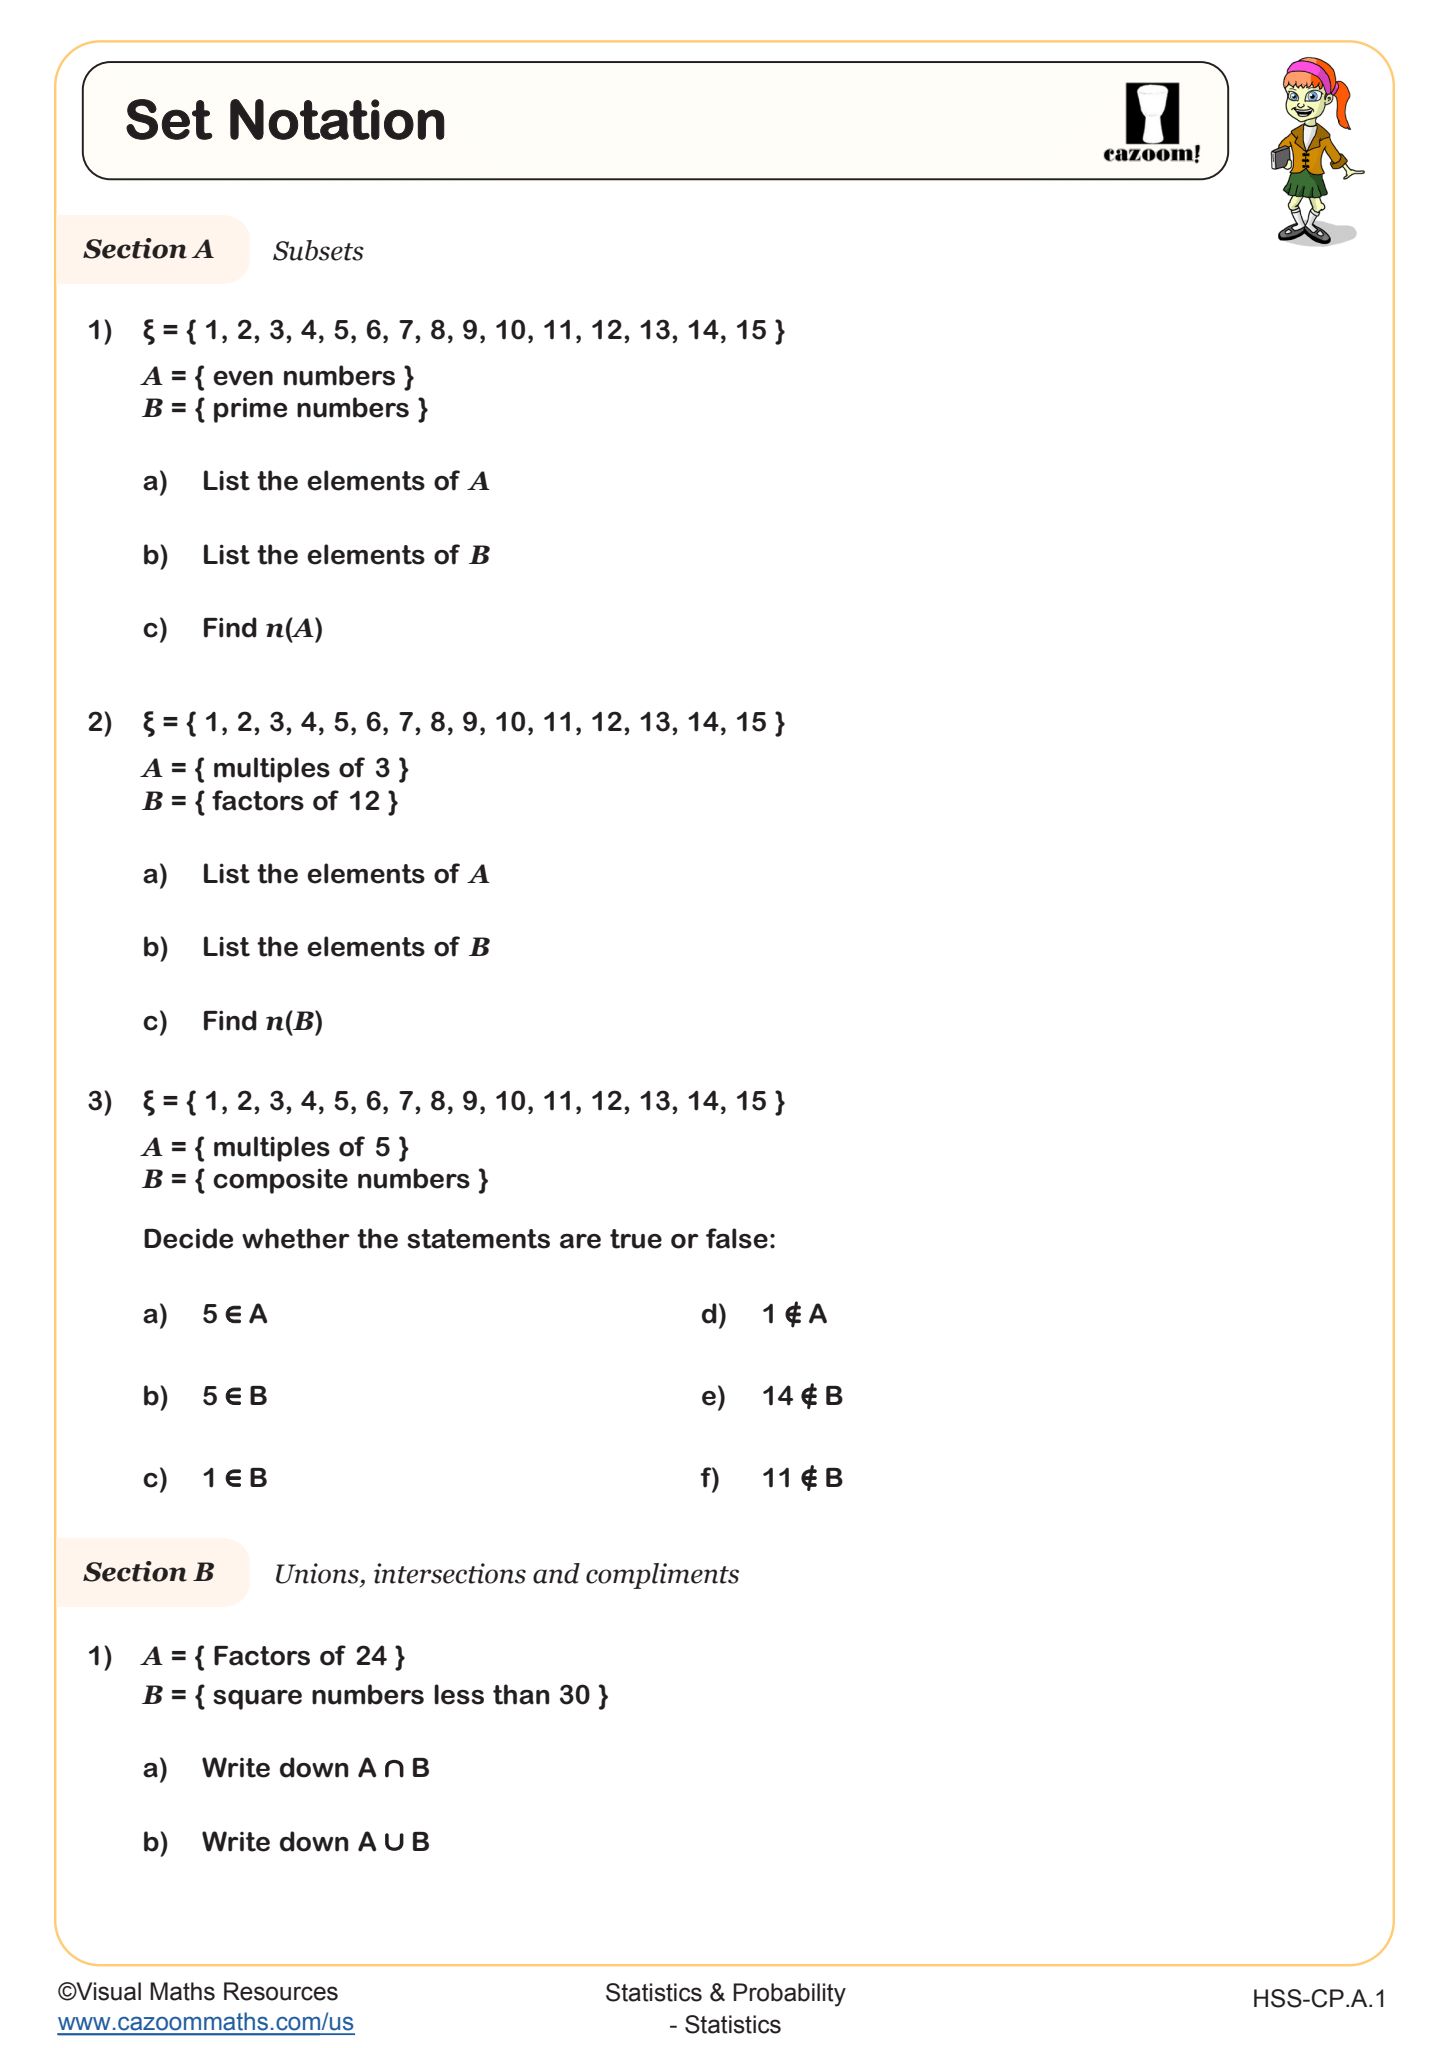
High school statistics focuses on data organization, visual representation, and introductory statistical inference. Students work with set notation to classify data, create various chart types to display information effectively, and begin understanding confidence intervals for making predictions from sample data. These skills align with Common Core standards and prepare students for both college-level statistics courses and data analysis requirements in other subjects.
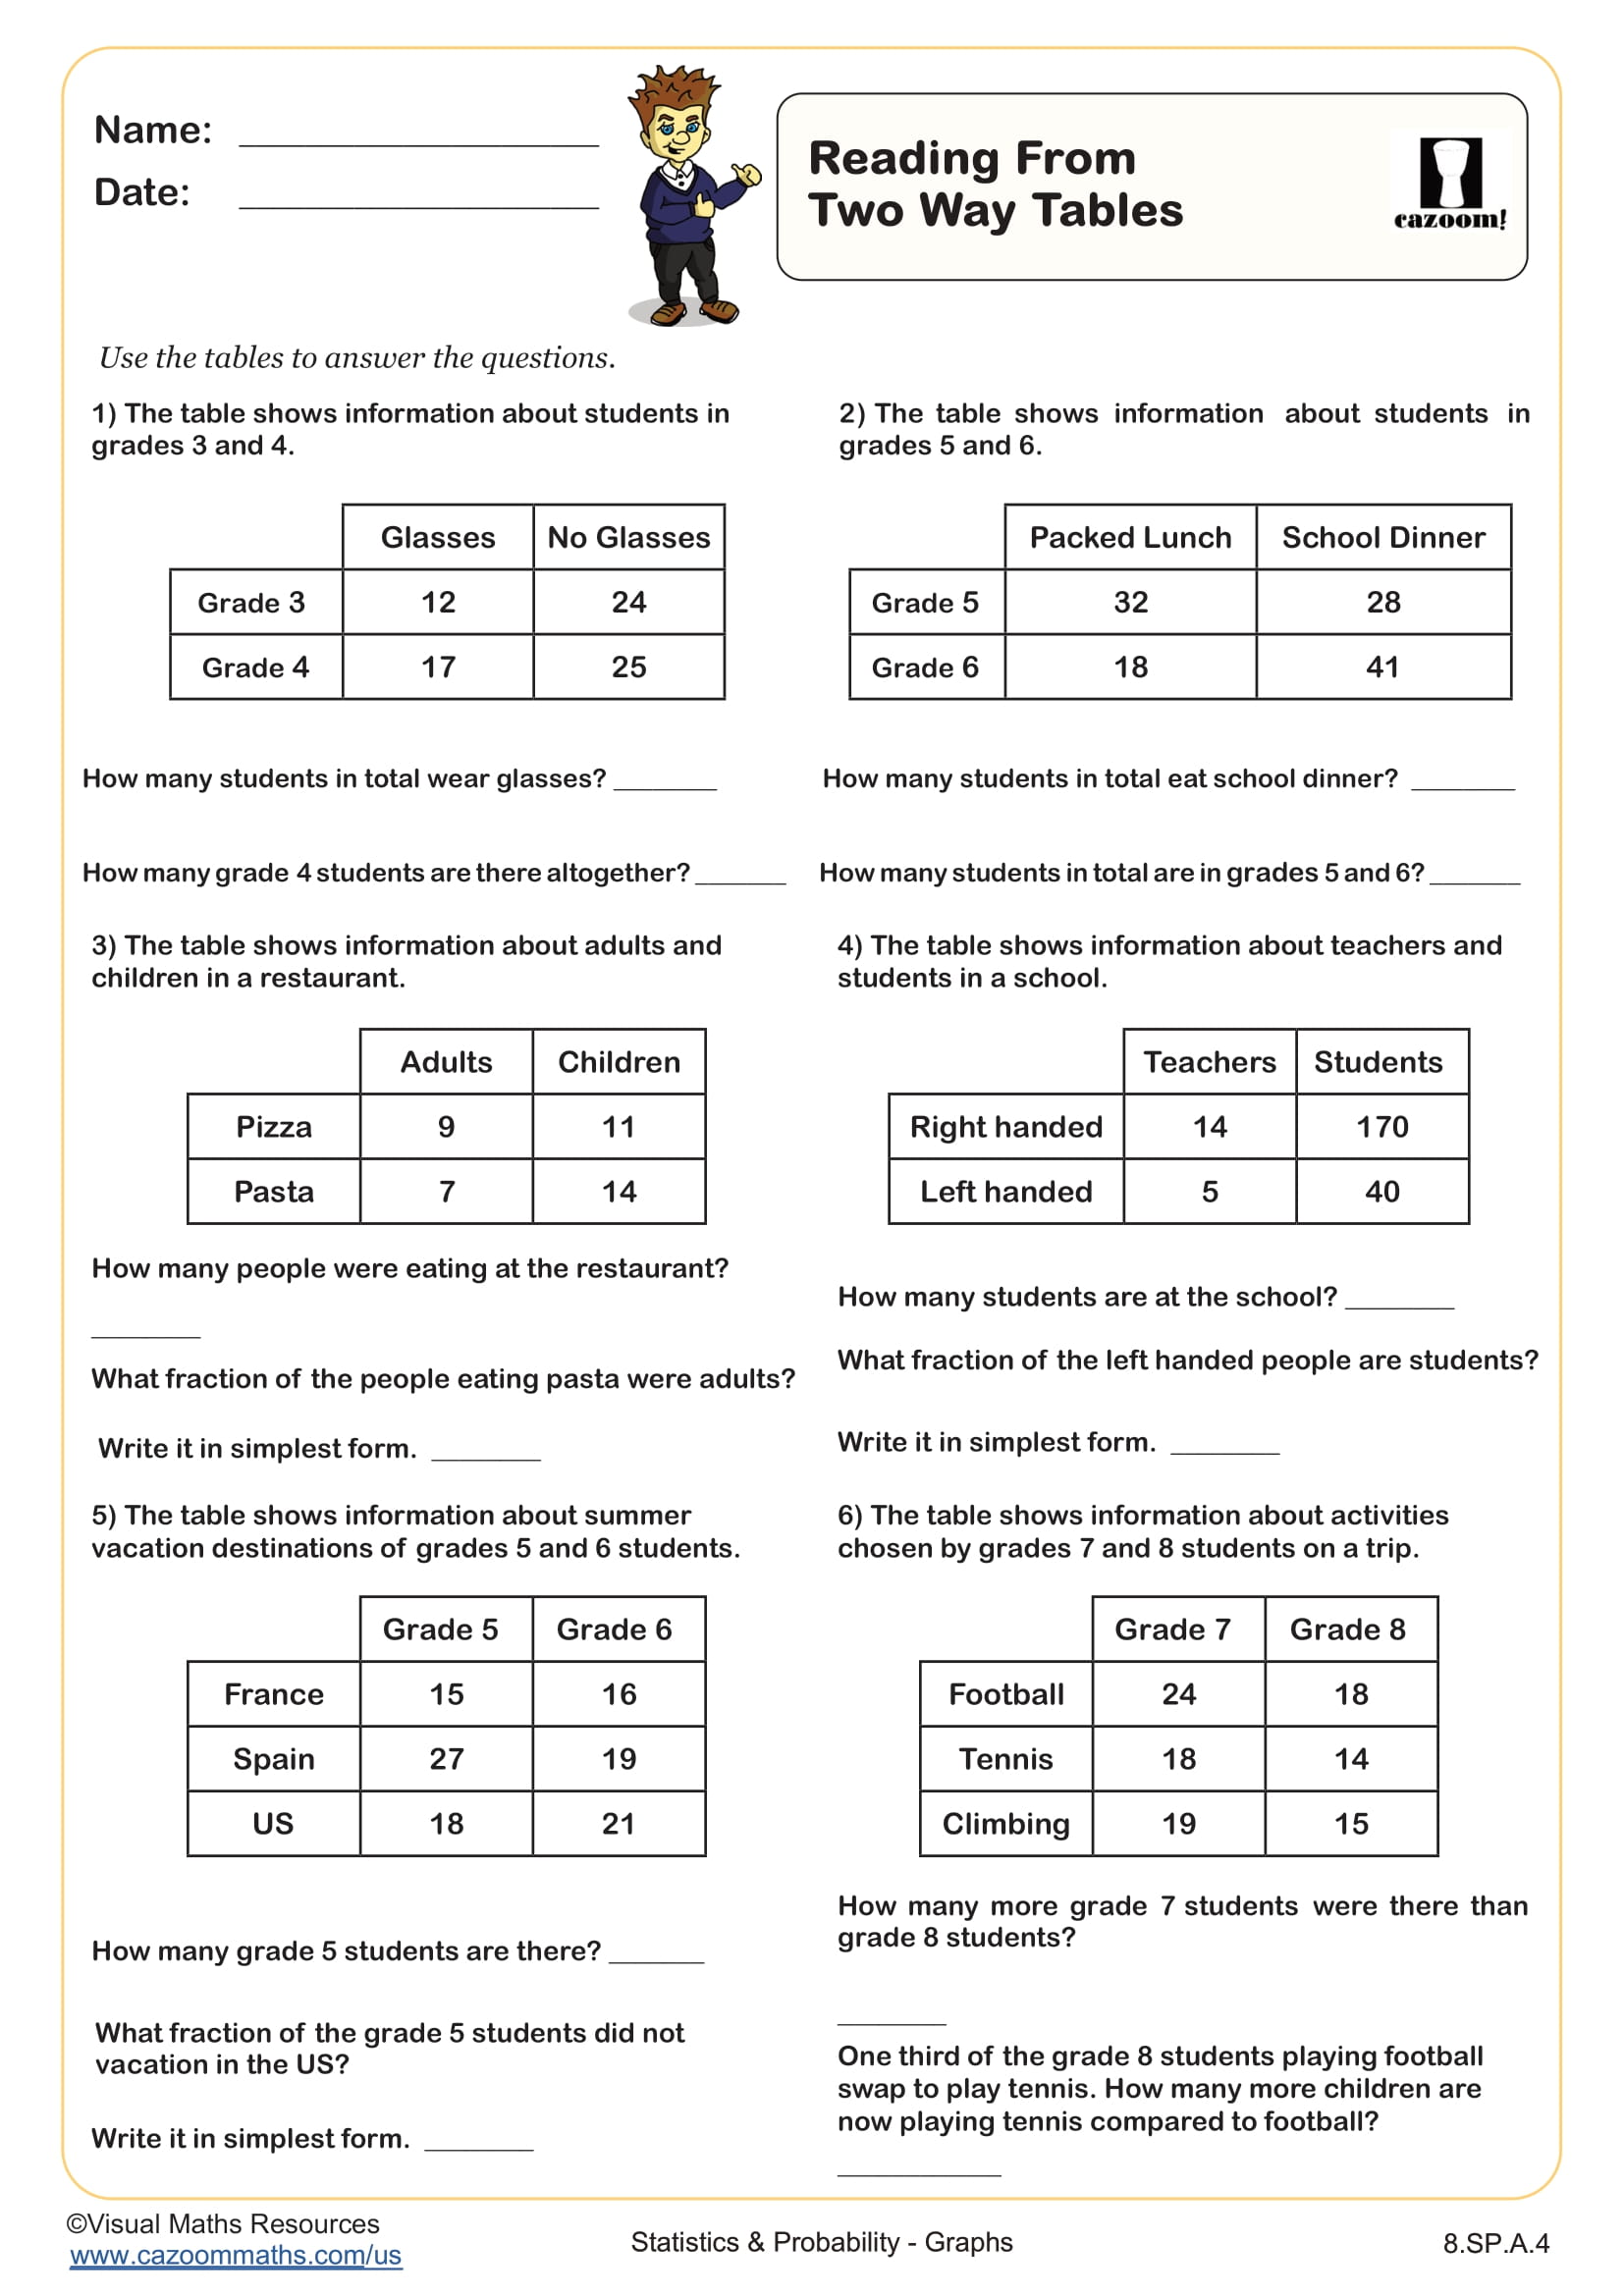
Teachers frequently notice that students who rush through tally chart construction make counting errors that cascade through their analysis. The key breakthrough happens when students recognize that organizing raw data systematically before graphing prevents errors in the visualization stage. Students lose points on assessments when they create technically correct graphs that don't match the data type, such as connecting discrete category data points with lines instead of using bars.
Which grade levels use high school statistics worksheets?
These statistics worksheets support students in Algebra I, Algebra II, Geometry, Precalculus, and the Integrated Math sequence (IM 1, IM 2, IM 3) throughout high school. Different courses emphasize statistics at varying depth, with Algebra I introducing foundational data displays while Algebra II and Precalculus incorporate more sophisticated statistical reasoning including confidence intervals.
The progression across high school becomes more analytical each year. Freshman-level work focuses on accurately constructing charts and graphs from given data sets. By junior and senior year, students interpret complex composite bar charts comparing multiple data sets simultaneously and apply confidence interval concepts that require understanding margin of error and statistical significance. The Integrated Math pathway distributes these skills across all three courses rather than concentrating them in Algebra courses.
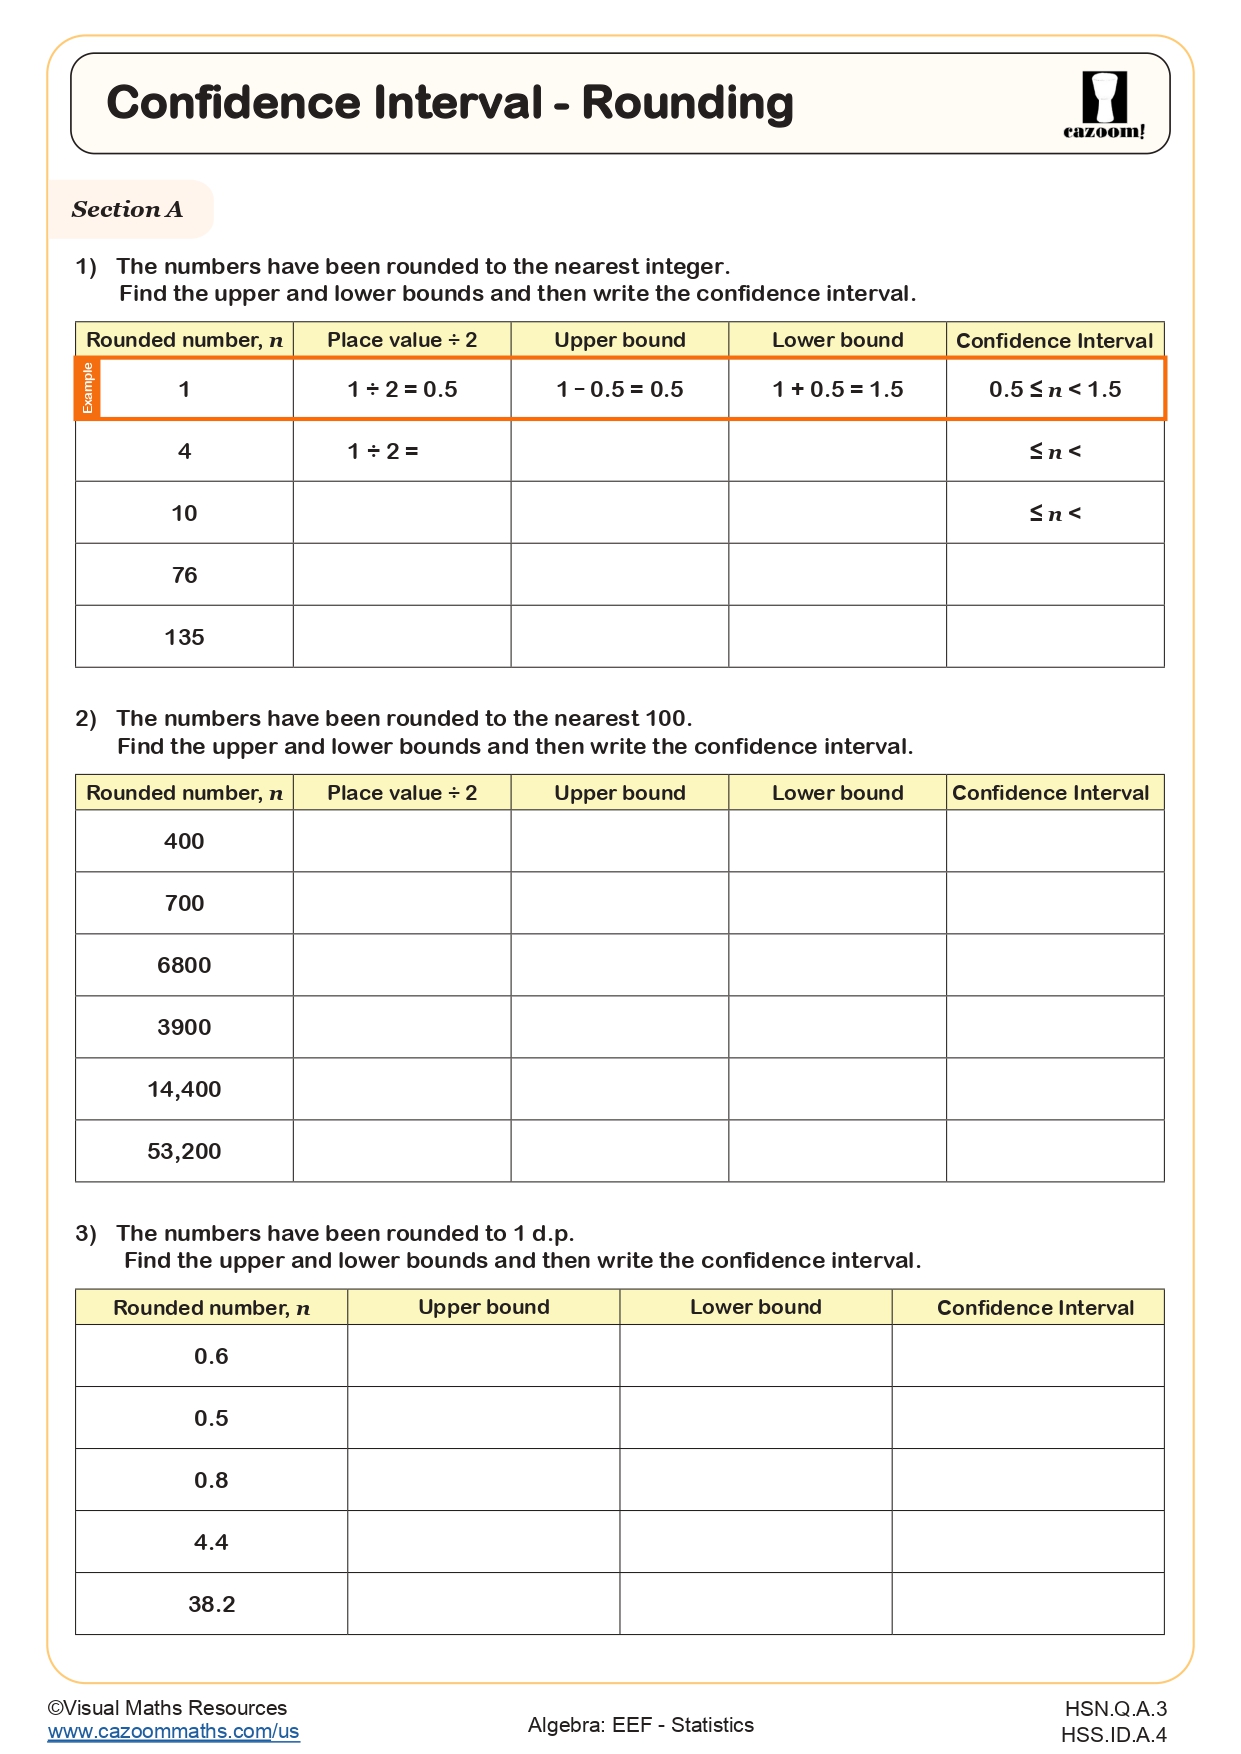
How do students learn to interpret confidence intervals?
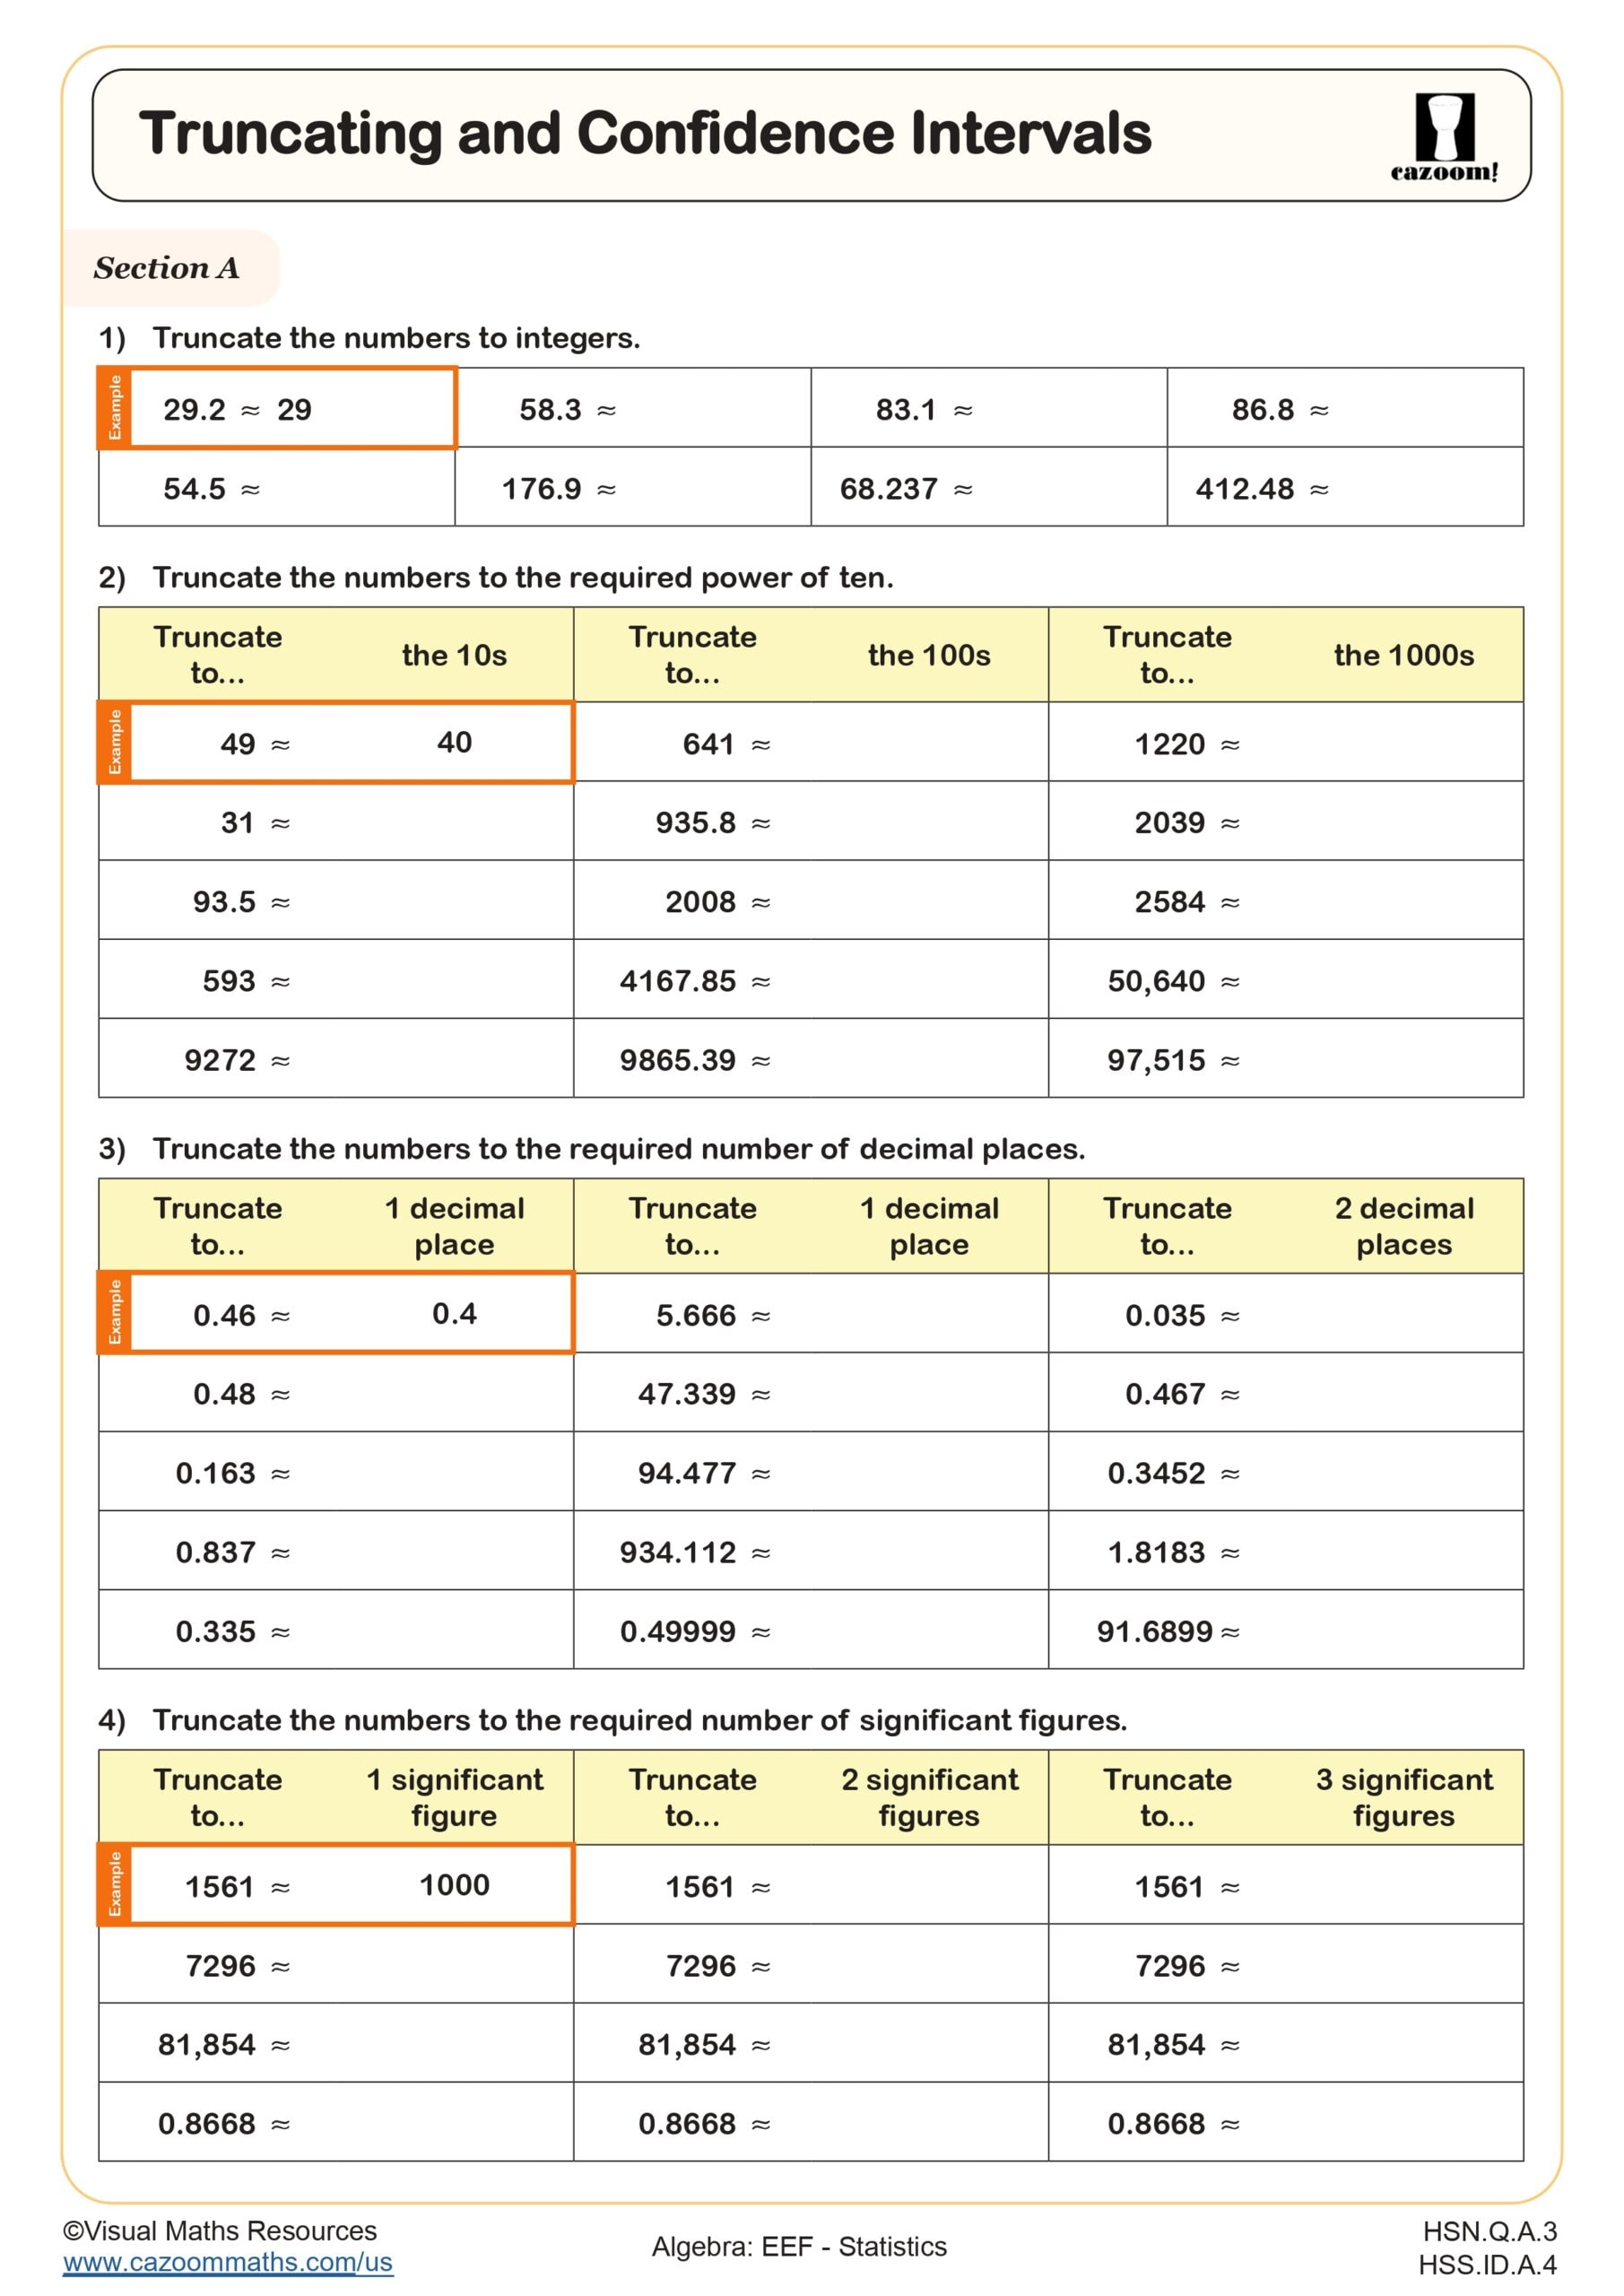
Confidence intervals introduce students to statistical inference, helping them understand that sample data provides estimates with measurable uncertainty. Students learn to calculate intervals that likely contain the true population parameter and practice appropriate rounding to maintain statistical validity. This concept requires combining calculation skills with conceptual understanding of why larger samples produce narrower, more precise intervals.
Confidence intervals appear constantly in medical research, polling data, and quality control processes. When pharmaceutical companies test new medications, they report effectiveness using confidence intervals rather than single numbers. Students who grasp this concept can critically evaluate news reports claiming a candidate leads by a certain margin, recognizing whether the margin of error makes that lead statistically meaningful. This statistical literacy becomes increasingly important as students encounter data-driven claims in media, scientific literature, and their future careers in fields from psychology to engineering.
How can teachers use these statistics worksheets effectively?
The worksheets provide structured practice that moves from data organization through visual representation to statistical reasoning. Each worksheet focuses on specific skills, allowing teachers to assign targeted practice based on student needs rather than working through entire units simultaneously. The included answer keys enable quick assessment of student understanding and help identify whether errors stem from calculation mistakes or conceptual misunderstandings about graph selection and interpretation.
Many teachers use these worksheets for differentiated instruction, assigning tally chart and basic graphing practice to students who need foundational review while directing advanced students toward confidence interval problems. The worksheets work well for station rotations where students practice different data visualization techniques, then compare results. They also serve as effective homework after introducing new graph types in class, giving students immediate feedback through answer keys before misconceptions become ingrained. Some teachers assign worksheets as collaborative paired work, where one student constructs a graph while their partner verifies accuracy using the answer key.