High school Stem-and-Leaf Diagrams Worksheets
All worksheets are created by the team of experienced teachers at Cazoom Math.
How Our High School Stem and Leaf Diagrams Worksheets Accelerate Statistical Understanding
These worksheets transform raw numbers into meaningful visual patterns. Students learn to spot trends, clusters, and outliers that remain hidden in unorganized data lists. They discover how stem and leaf plots preserve original values while revealing distribution shapes.
Regular practice with these diagrams develops essential data literacy for advanced mathematics. Students gain skills they'll apply in calculus-based statistics, research methods, and data science. The systematic progression from plot creation to statistical analysis prepares them for standardized tests and college coursework.
Classroom-Ready Measurement and Data Topics for Lessons, Homework, and Revision
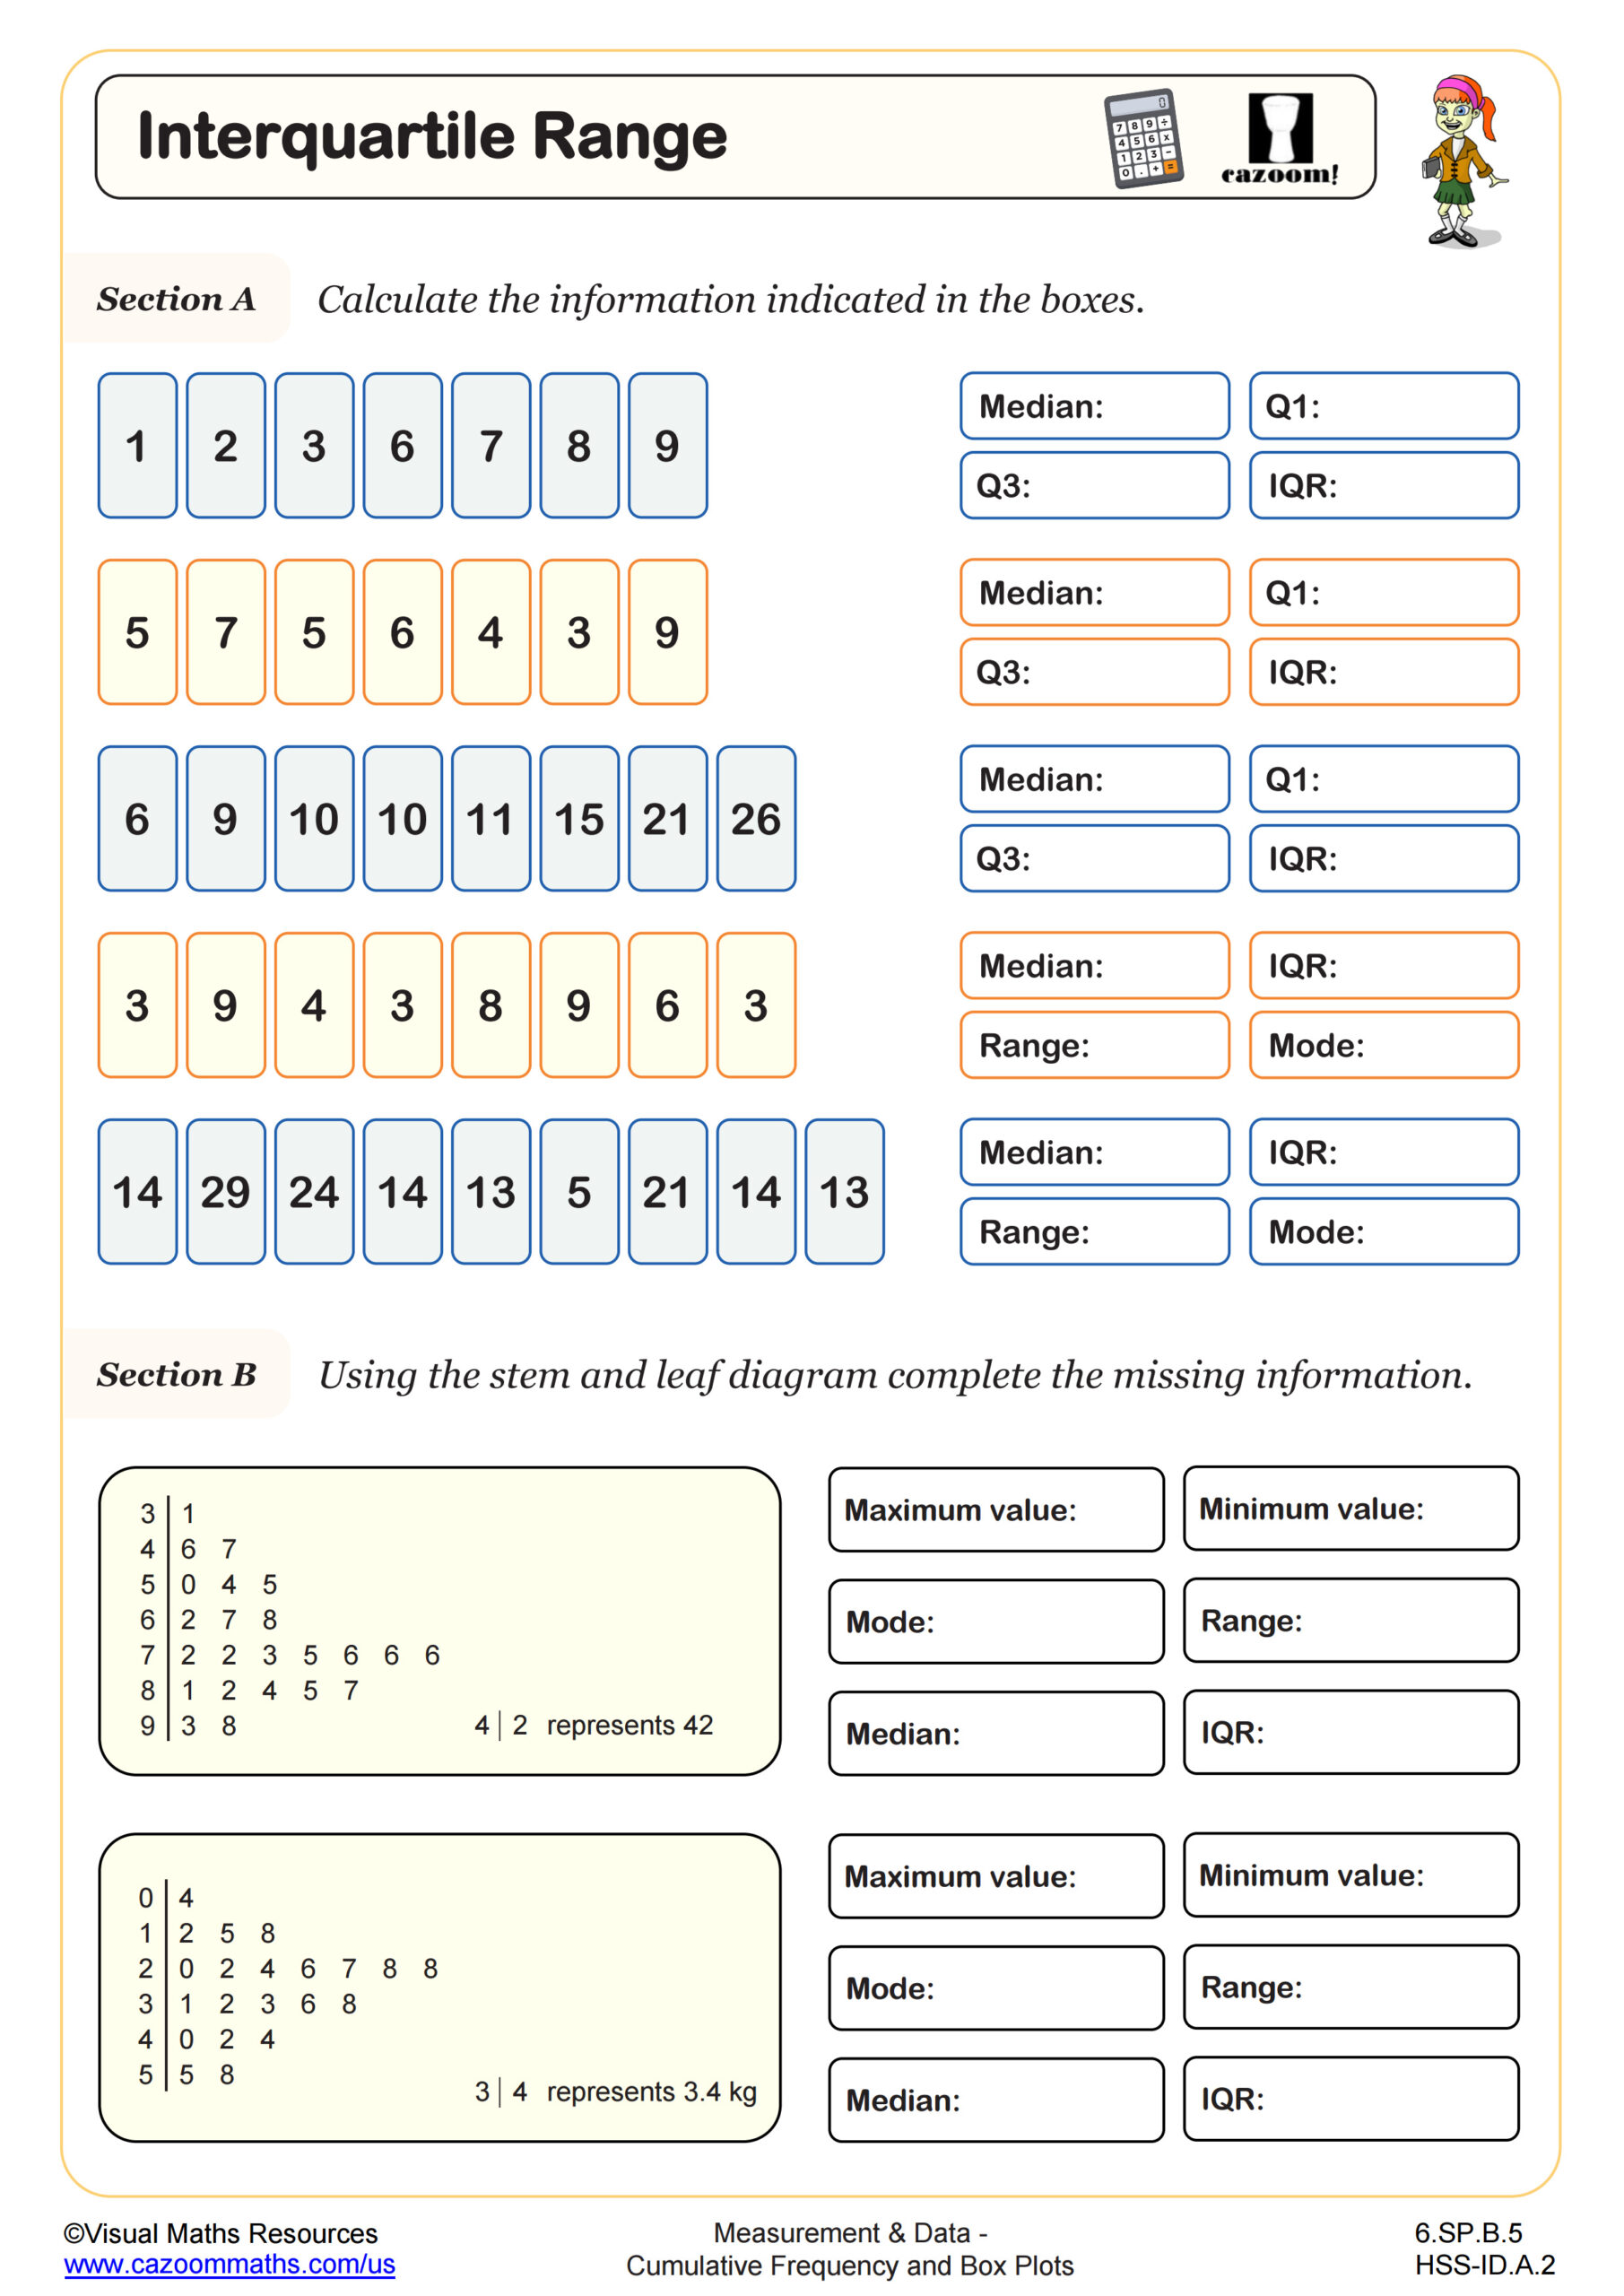
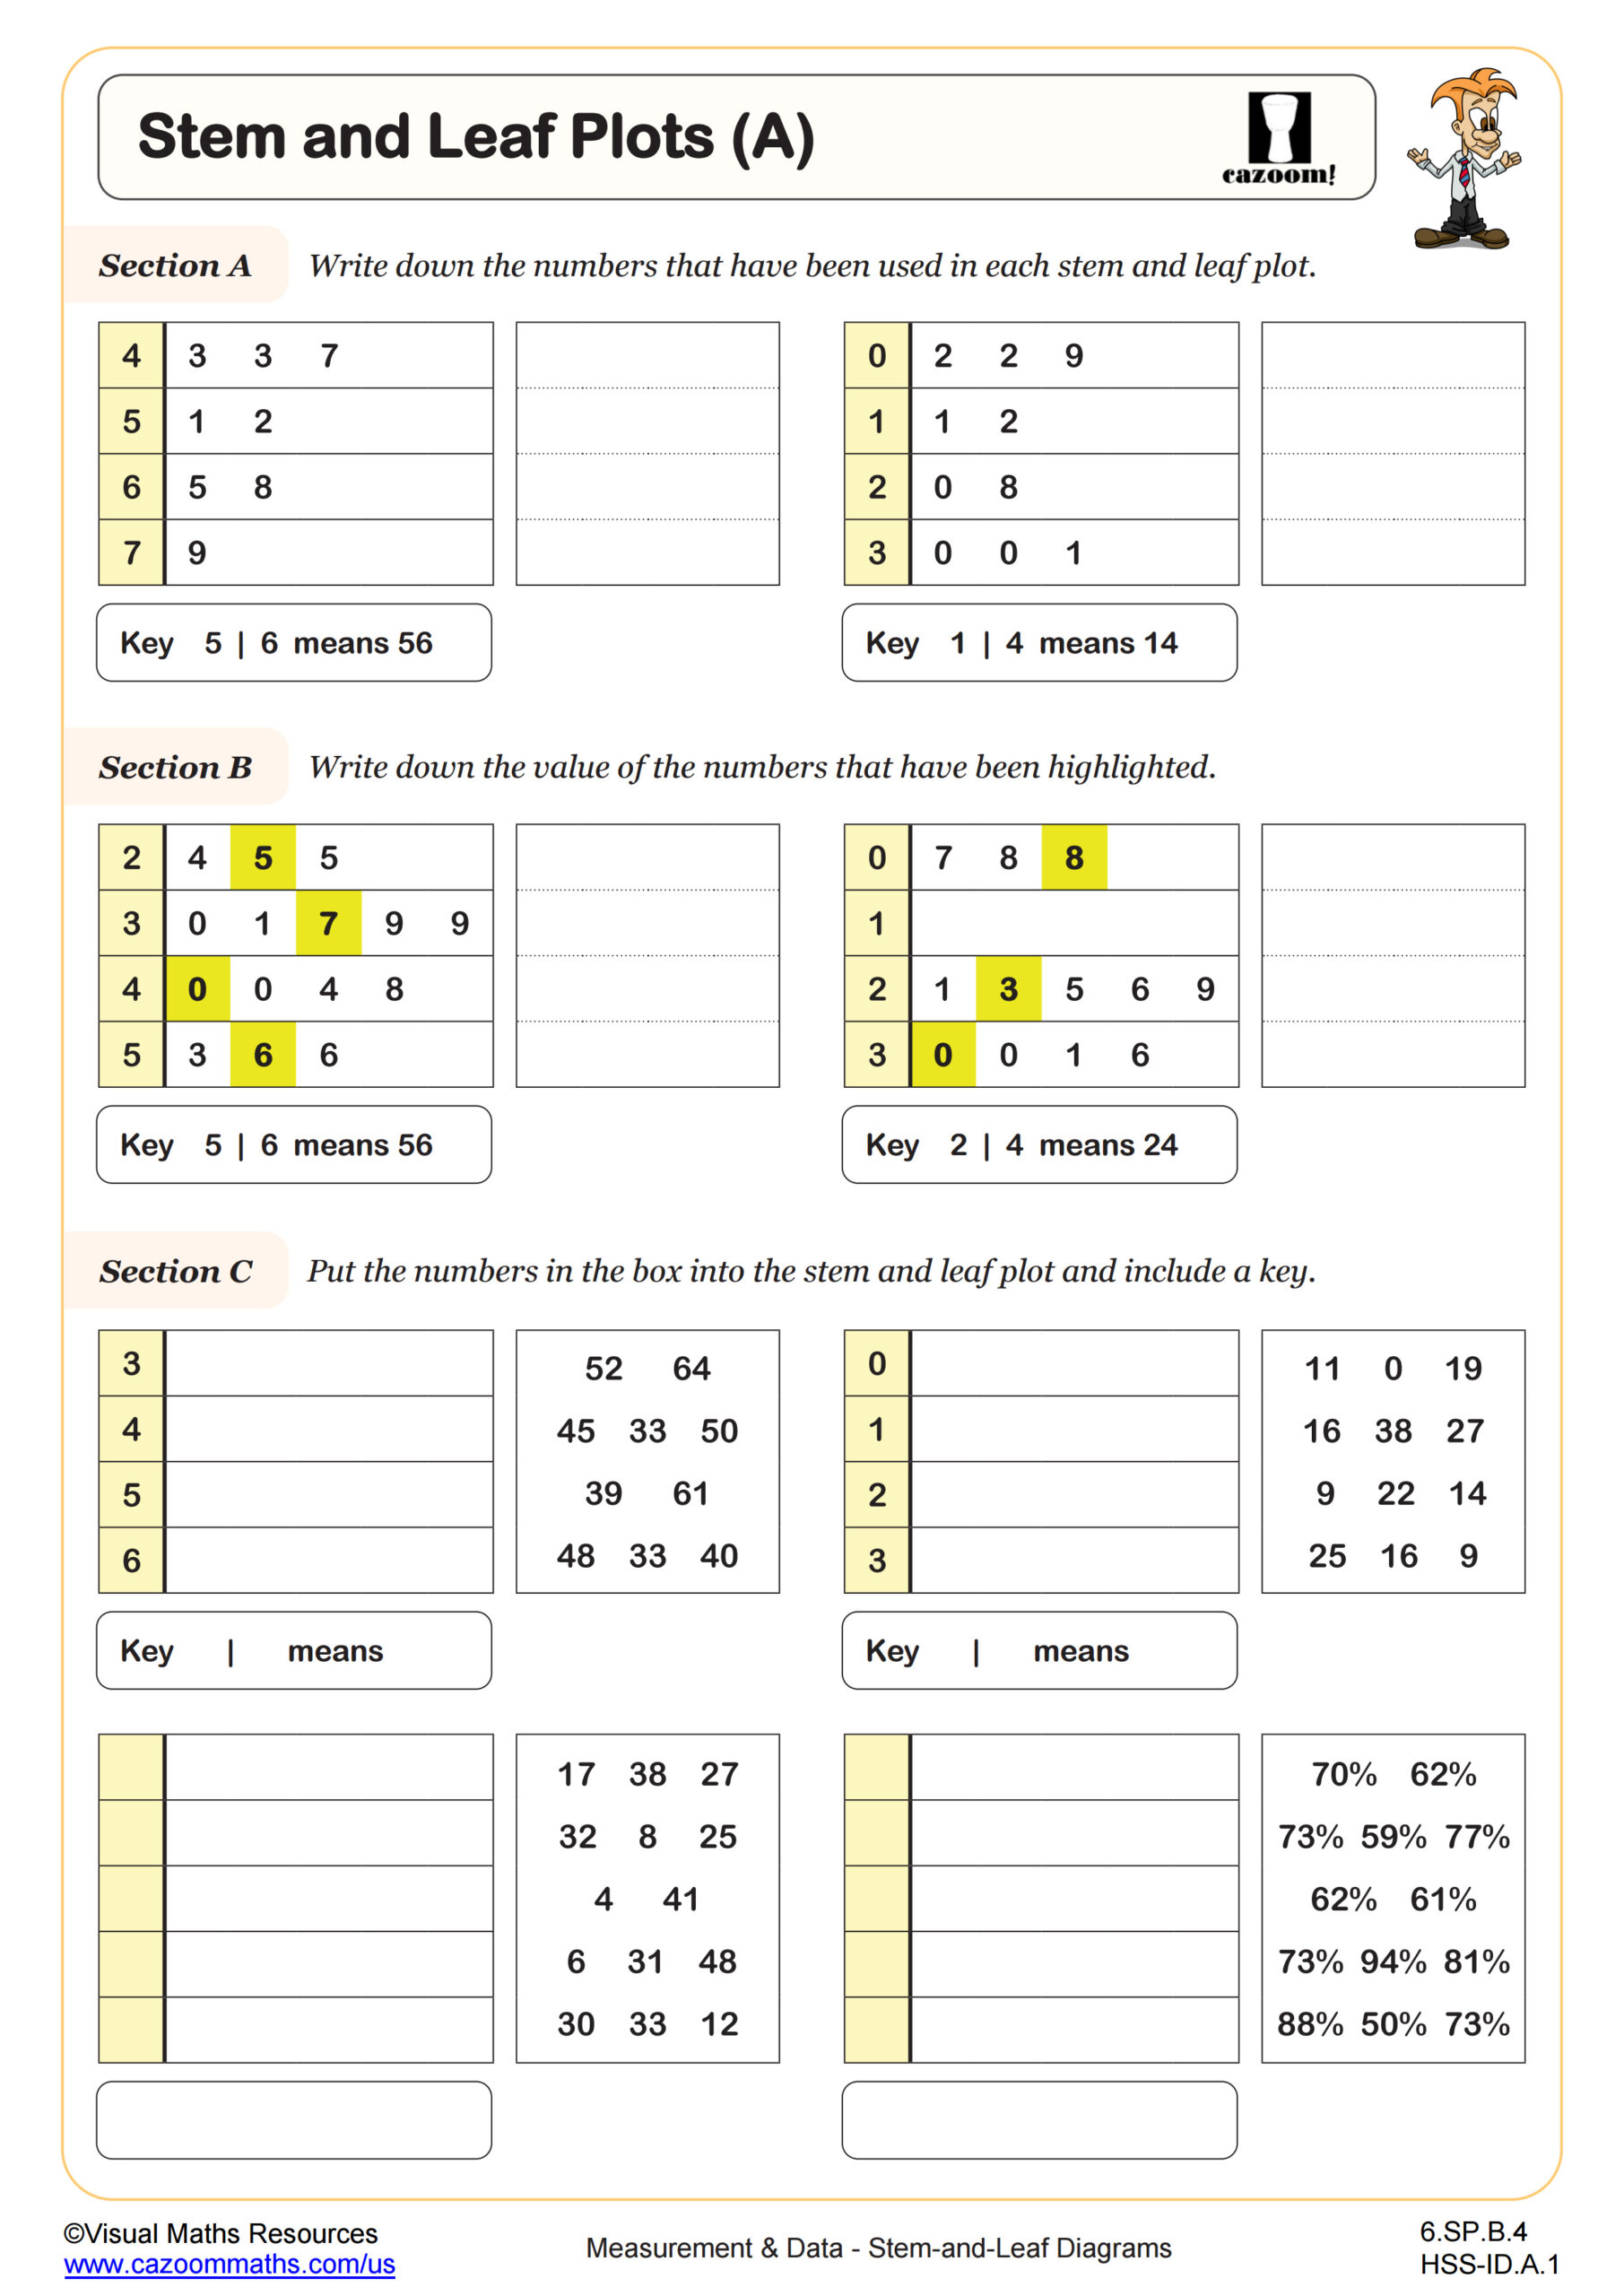
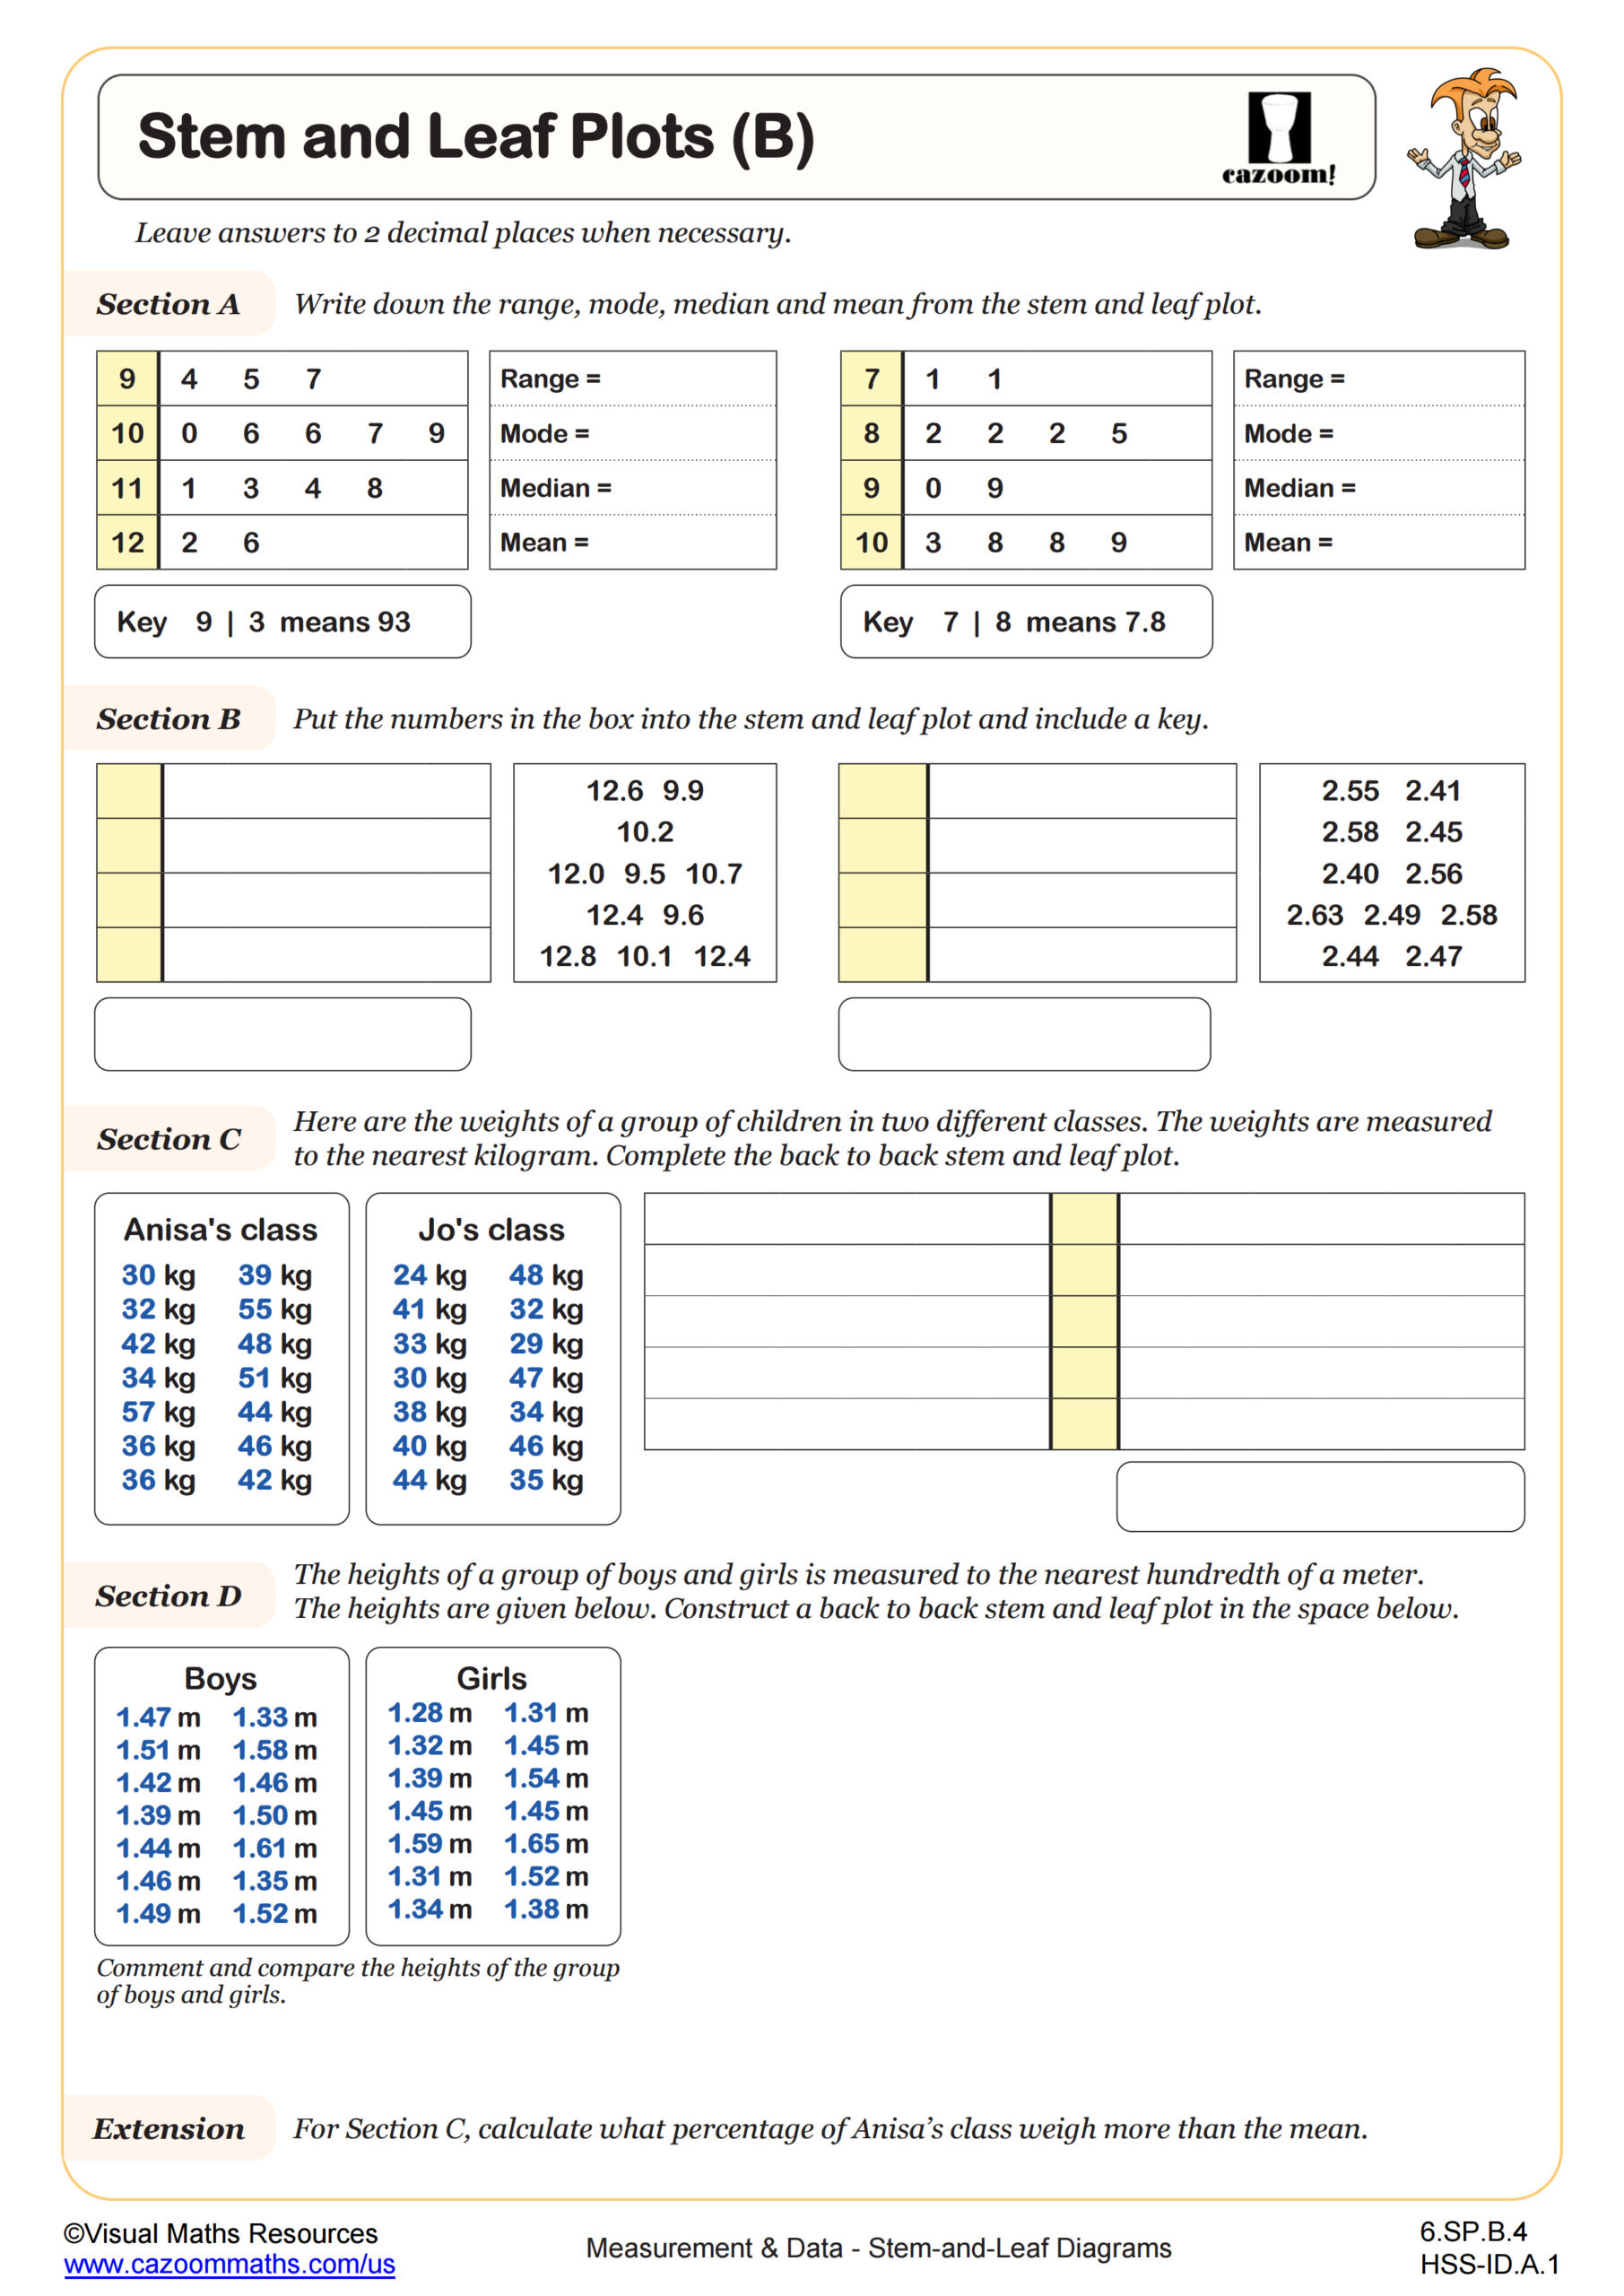
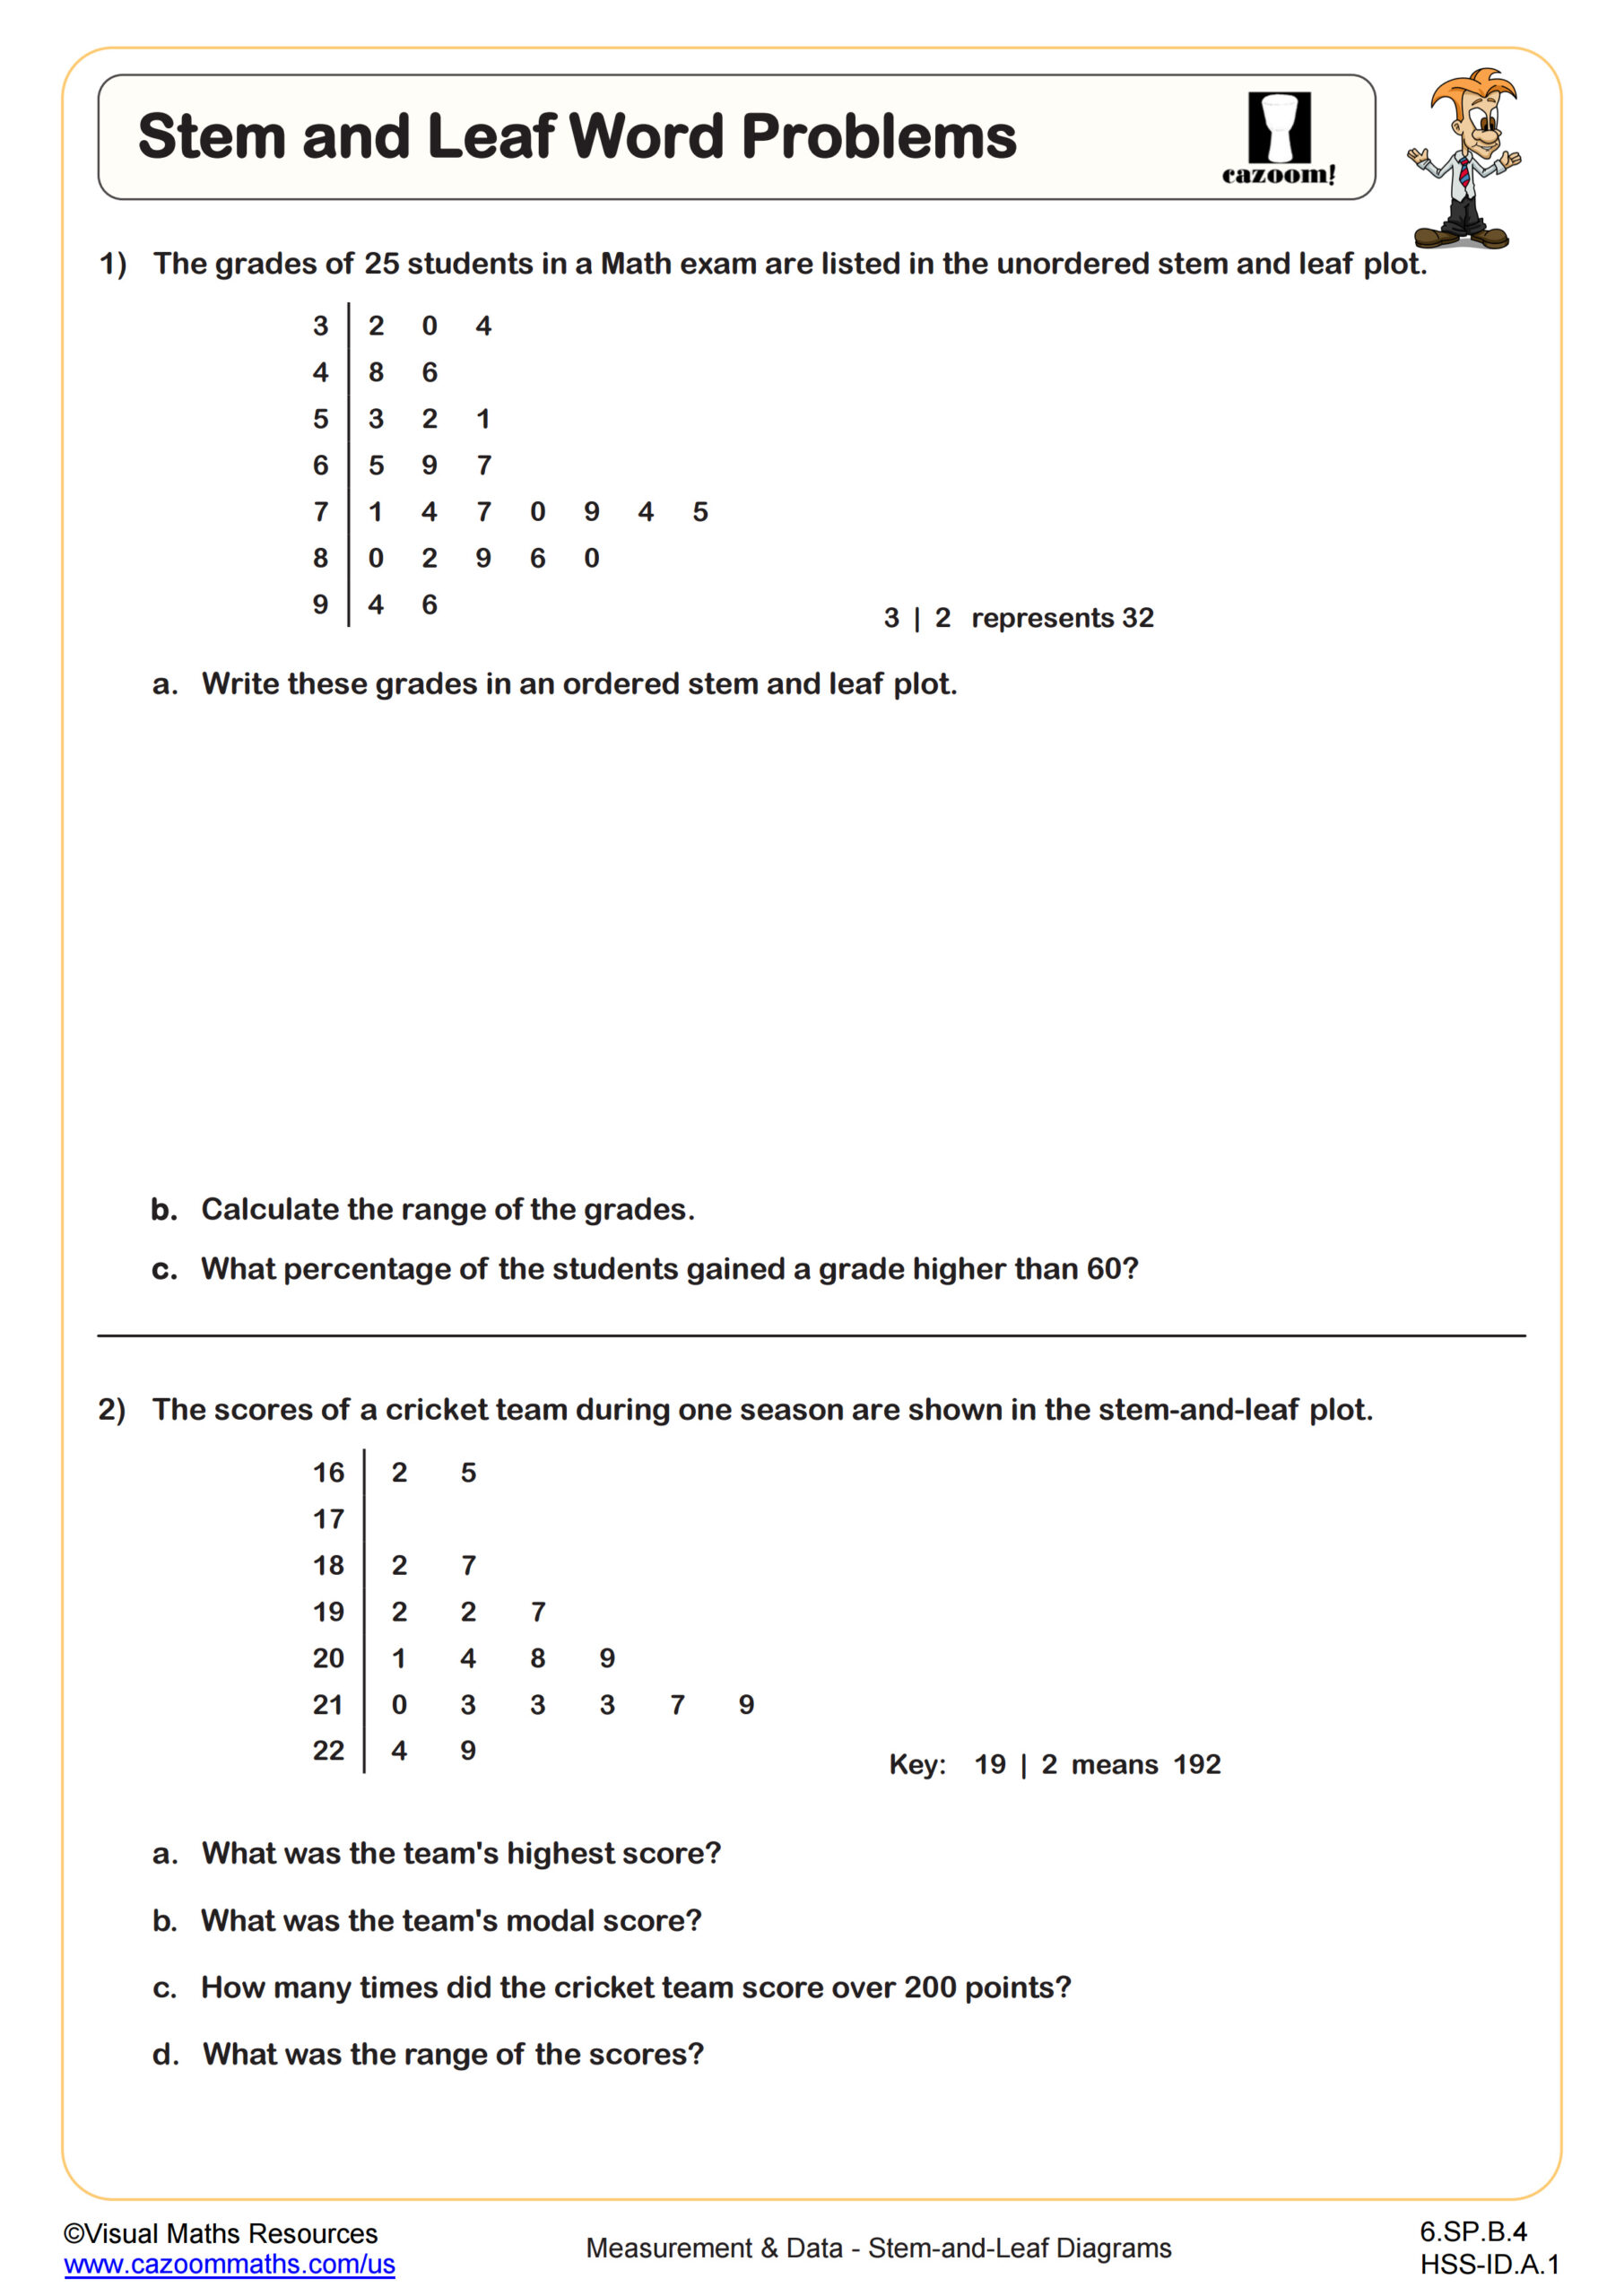
Students progress from working with simple data points to understanding abstract statistical concepts. Each worksheet includes detailed answer sheets showing complete construction methods and calculations. Covering quartile and spread analysis, single- and comparative-stem-and-leaf plots, and real-world problem applications, this collection strengthens students’ ability to organize, interpret, and analyze data visually and numerically.
Traditional Lessons or Worksheets? Why Cazoom Math Stem-and-Leaf Diagrams Work Best
The worksheets work well with teachers because they can be easily added to their existing lesson plans. The varying levels of difficulty in the activities facilitate the differentiation of instruction for students with diverse abilities in a mixed-ability classroom. The extension problems serve as challenging material for advanced learners, while the foundational exercises provide additional practice for students who need it.
The solution keys provide step-by-step explanations of the mathematical operations used in each calculation. The method enables teachers to identify which concepts and procedures students require assistance with. The grading process becomes more efficient because it allows for the rapid detection of errors. The format functions effectively for homework assignments as well as bell ringers and exit tickets. Cazoom Math worksheets save hours of preparation time for retrieval practice activities. Teachers should focus their efforts on teaching students in the classroom rather than developing educational materials.
Where Stem and Leaf Skills Apply Outside the Classroom
Students encounter these data organization techniques in various fields, including research, business, and science. Sports analysts use stem-and-leaf plots to compare player statistics across seasons. Quality control teams use these methods to efficiently track manufacturing data. Scientists organize experimental results using these visual tools before deeper analysis.
• Comparing test scores across classes
• Tracking athletic times and distances
• Monitoring stock prices and trends
• Recording scientific experiment data