Integrated Math 2 Statistics Worksheets
All worksheets are created by the team of experienced teachers at Cazoom Math.
What statistics skills are covered in Integrated Math 2?
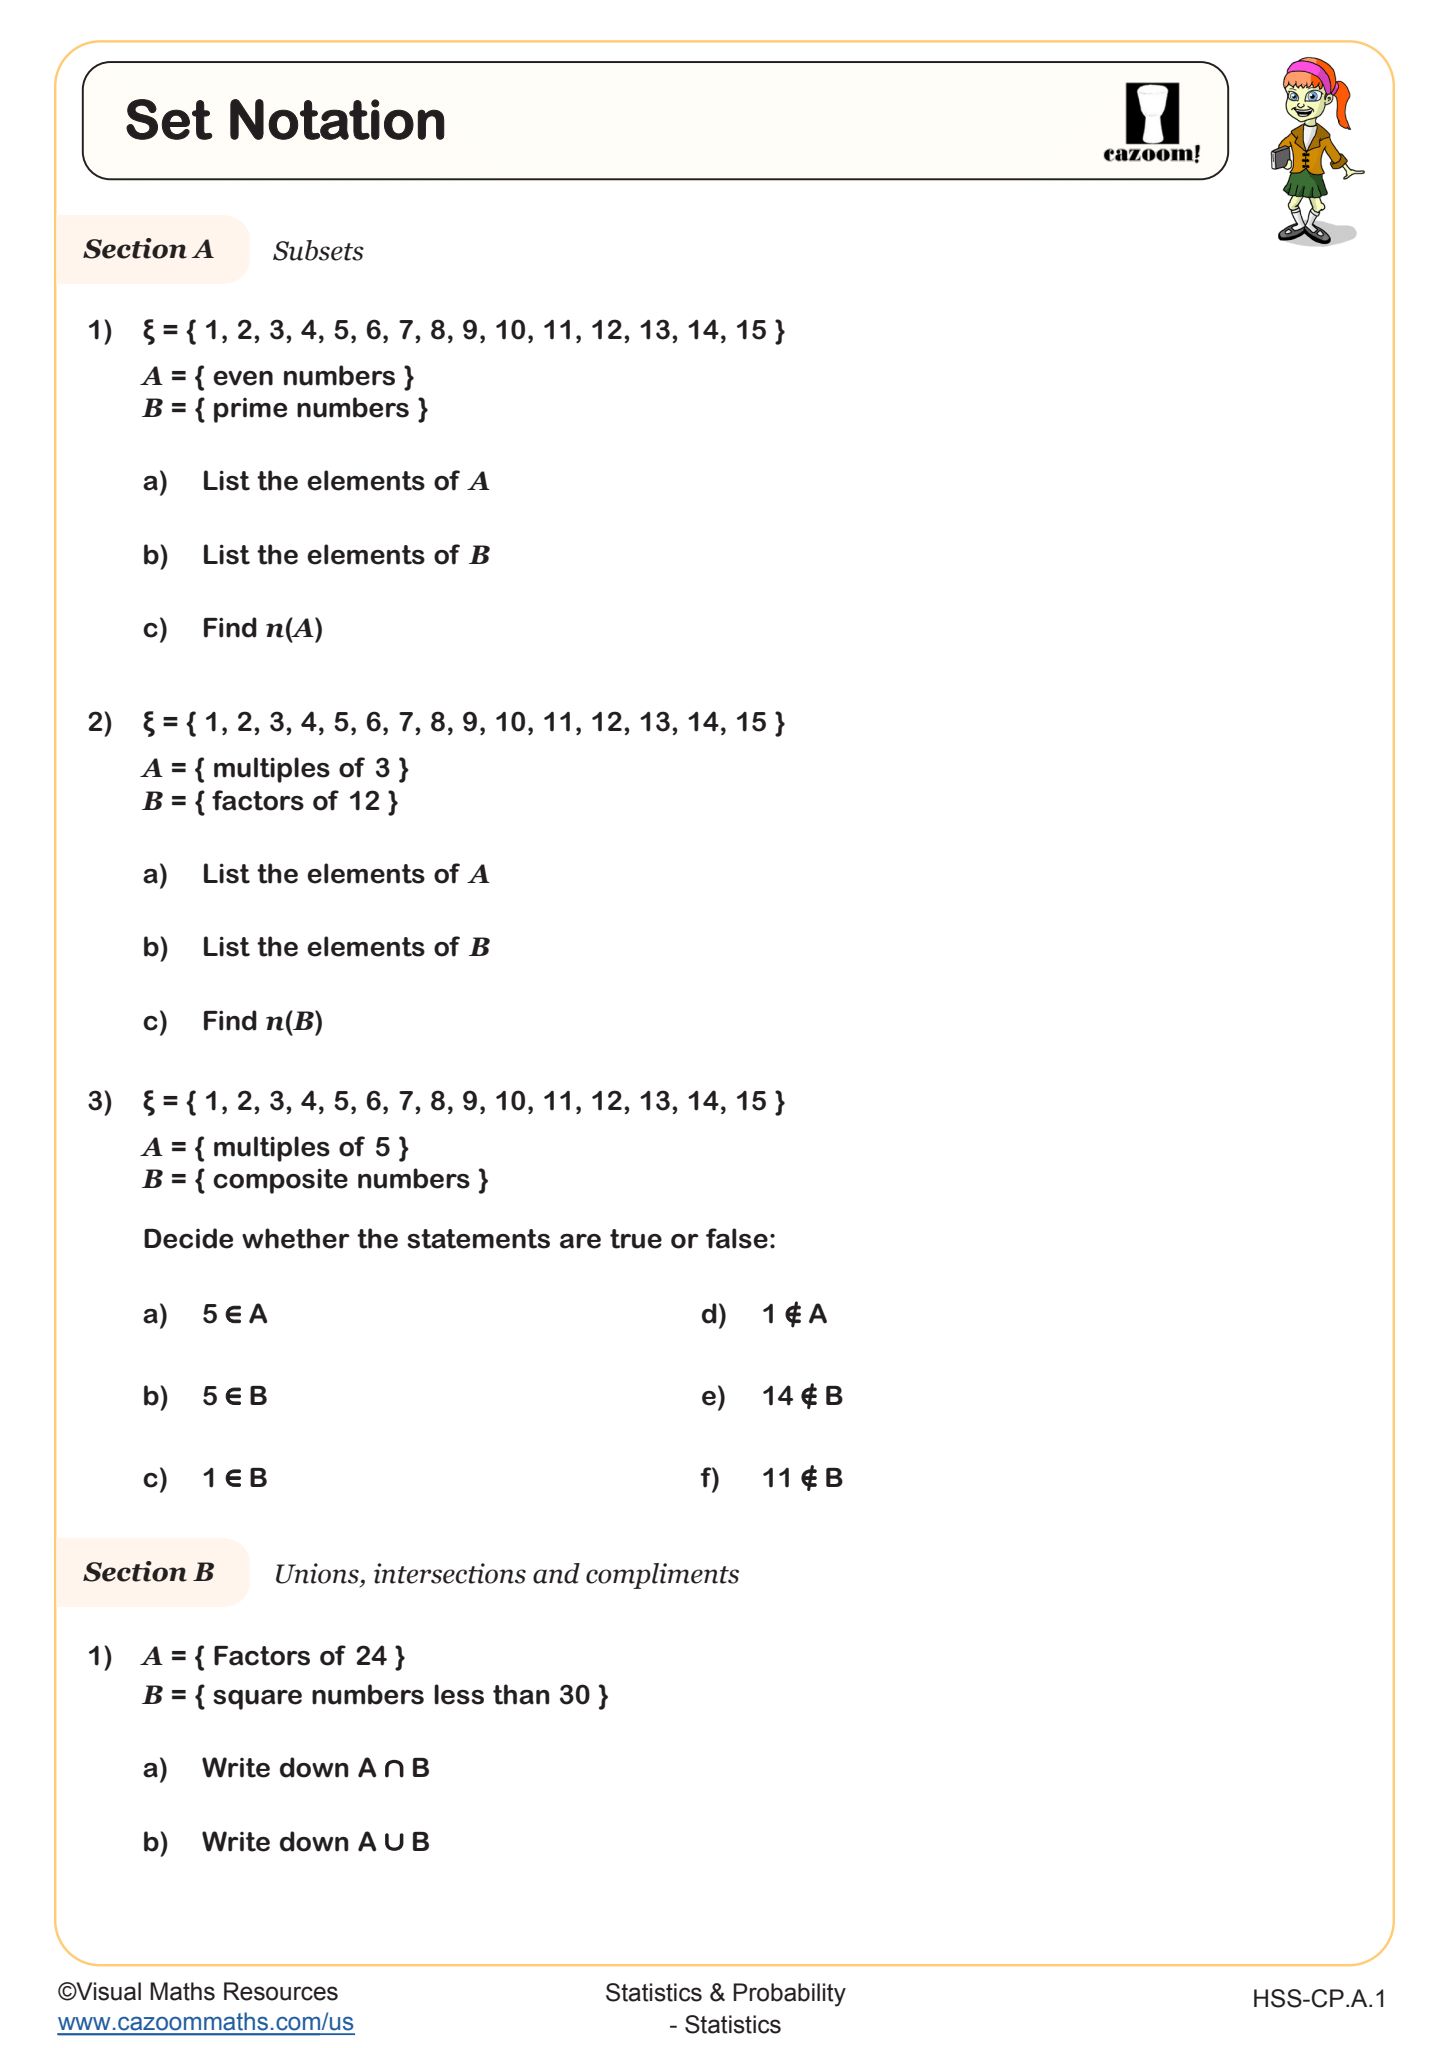
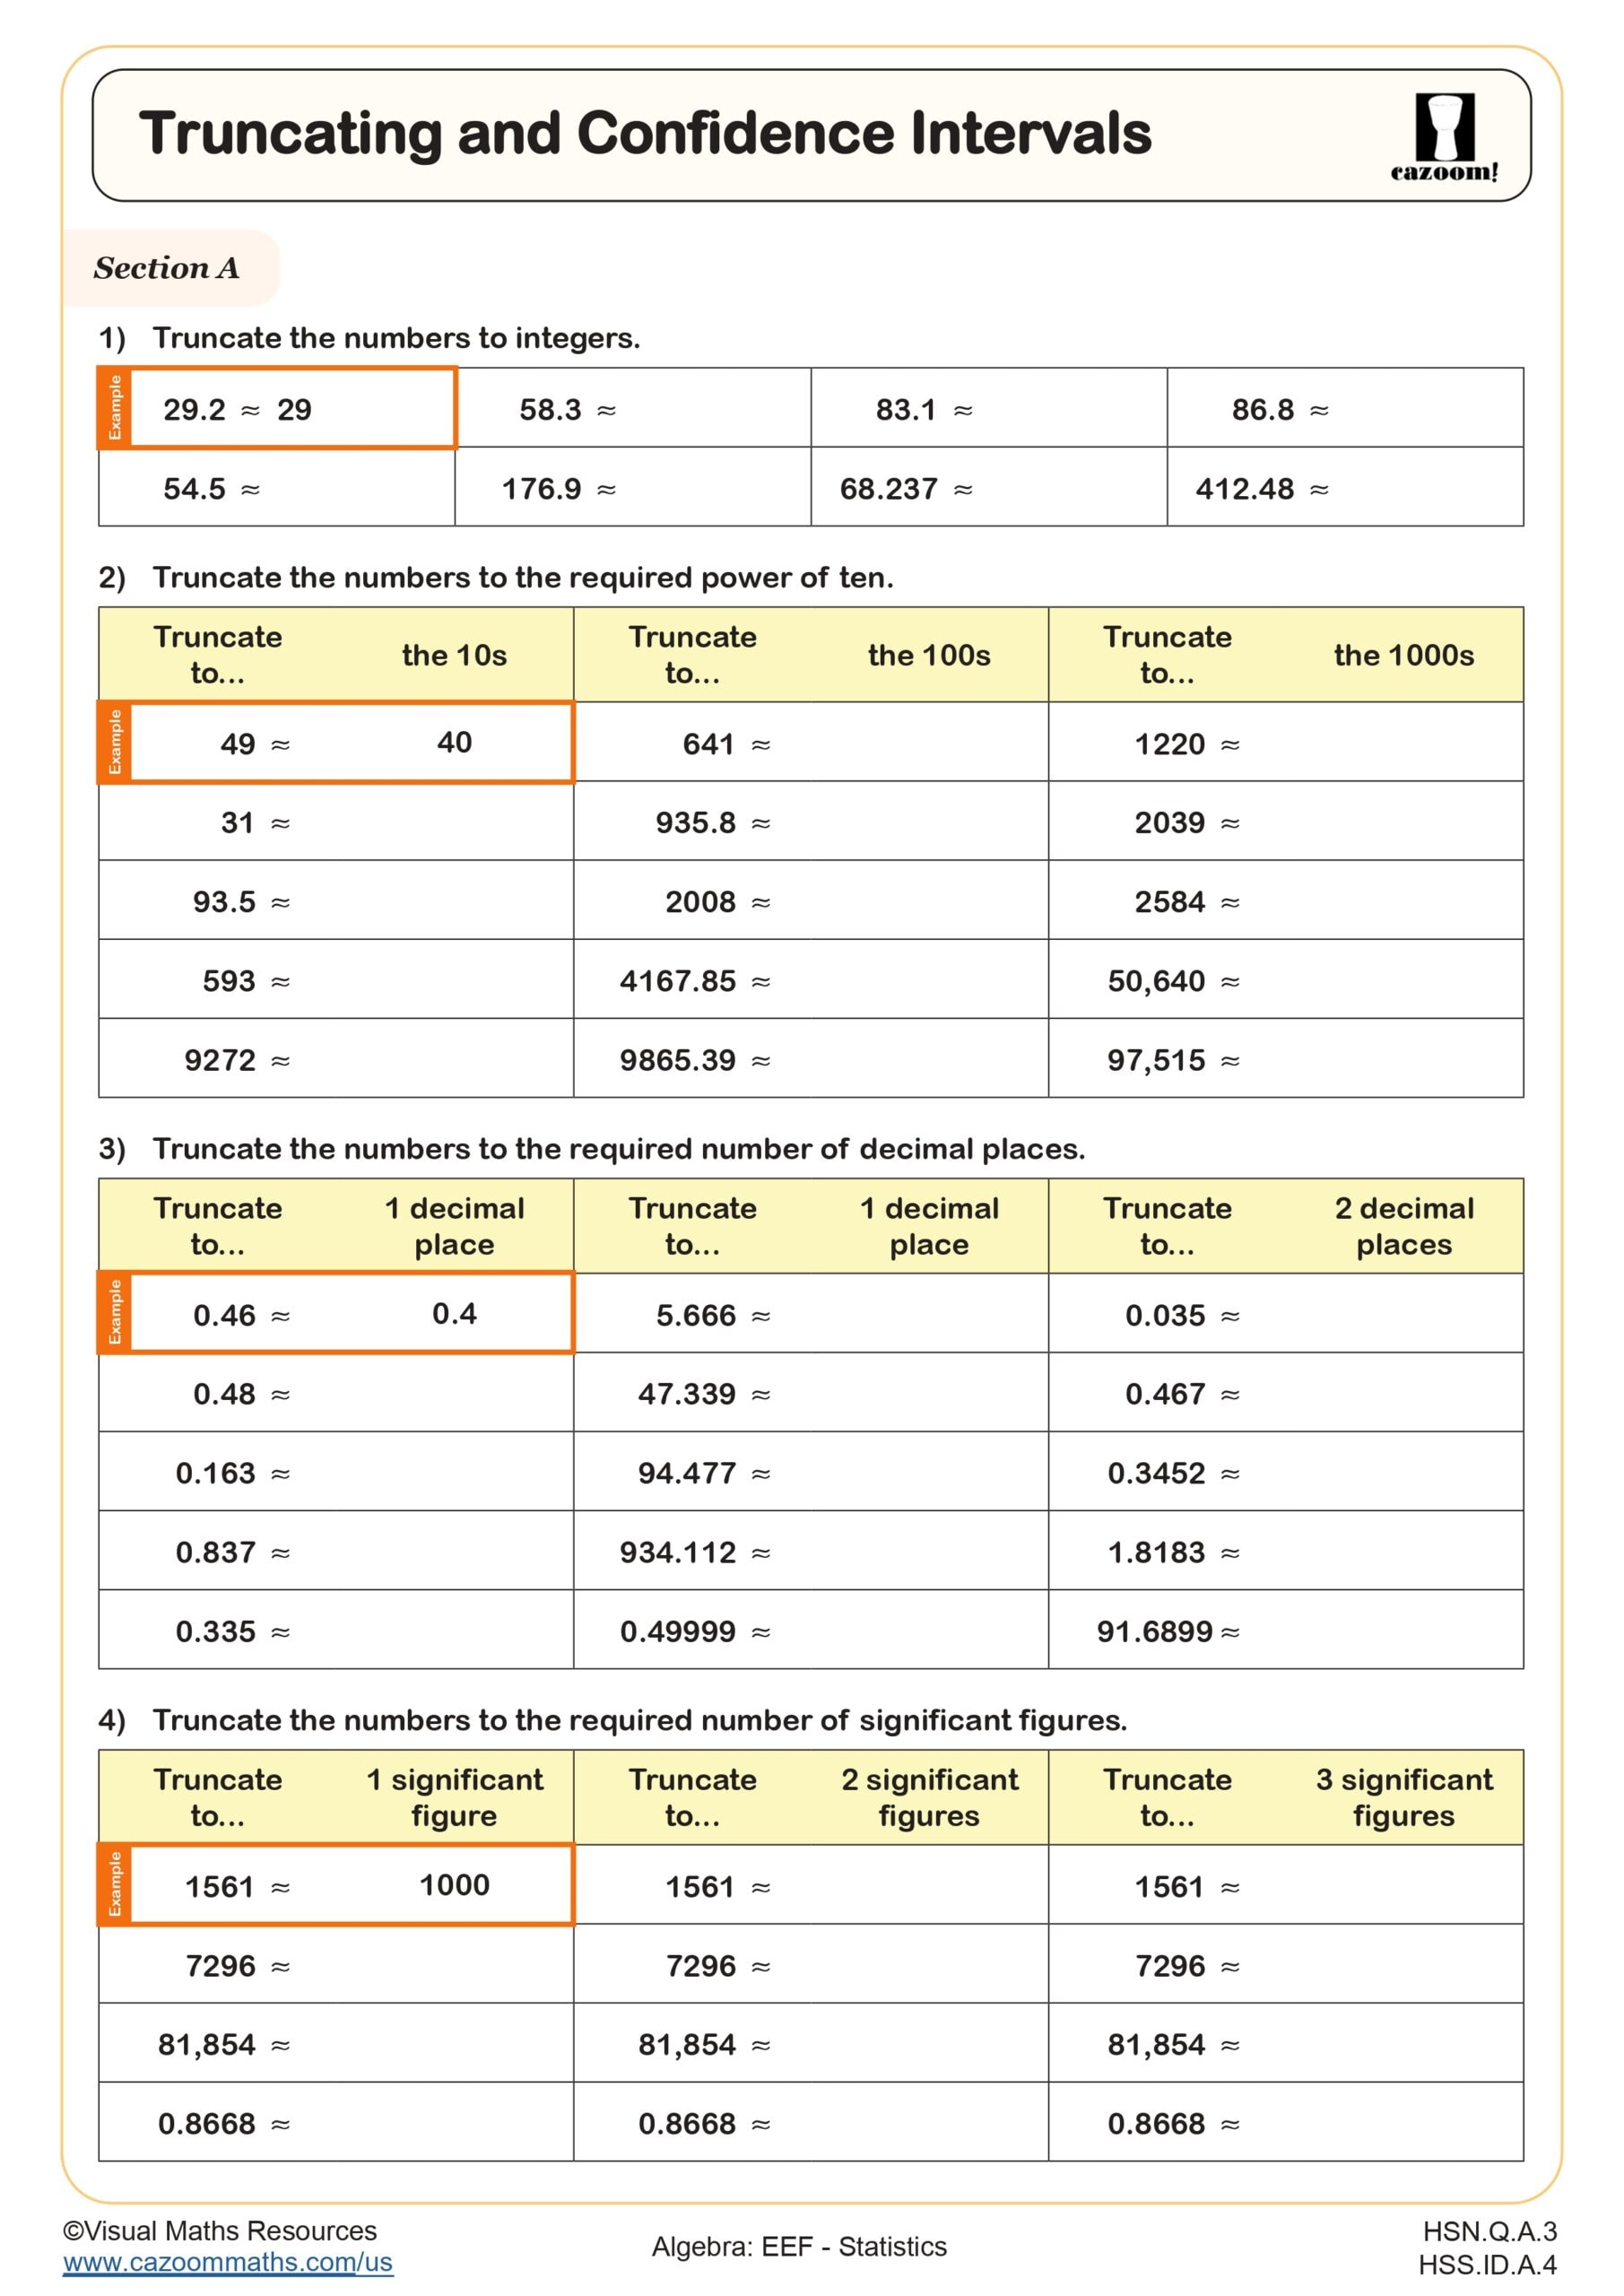
Integrated Math 2 statistics focuses on data representation, set theory applications, and introductory inferential statistics. Students work with set notation to describe data populations and subsets, calculate and interpret confidence intervals with appropriate rounding, and construct multiple types of data visualizations including composite bar charts, dual bar charts, tally charts, and line graphs. This builds on the descriptive statistics from earlier courses while preparing students for more advanced probability and inference.
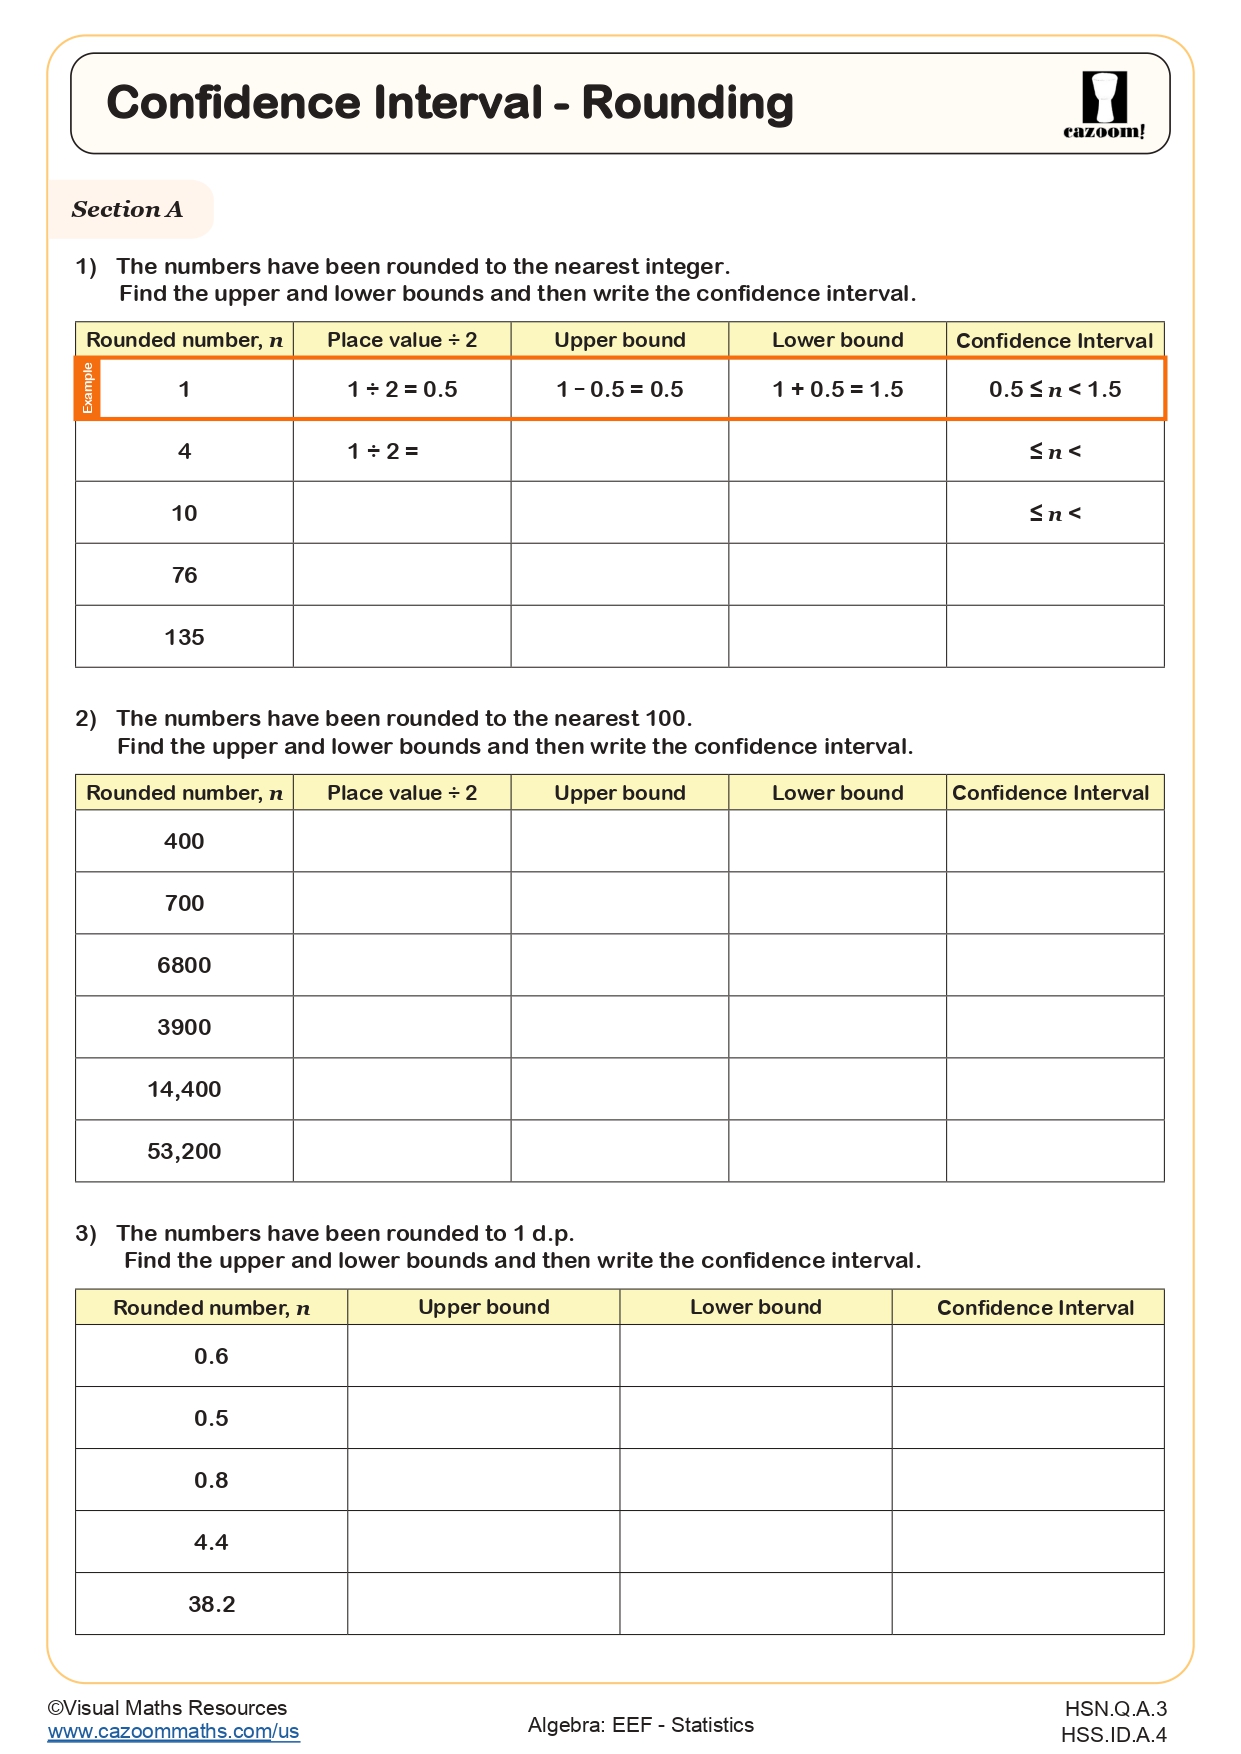
A common error occurs when students round confidence intervals incorrectly, often rounding too early in the calculation process rather than at the final step. Teachers frequently need to remind students that rounding a confidence interval to the nearest whole number when the context involves decimals (like average test scores of 87.3) loses important precision. State assessments regularly test whether students can match the rounding to the context of the problem.
Which grade levels use these Integrated Math 2 statistics worksheets?
These statistics worksheets align with Integrated Math 2 curriculum, typically taught to high school students in grades 9-11 depending on their math pathway. In states following an integrated math sequence, students encounter this material after completing Integrated Math 1, which covers foundational algebra and geometry. The integrated approach spirals back to statistical concepts throughout the course rather than isolating them in a single unit.
The difficulty progression within Integrated Math 2 statistics moves from organizing raw data with tally charts and basic graphs to analyzing relationships through dual and composite bar charts, then advances to working with confidence intervals and formal mathematical notation for sets. Students who struggled with fractions and decimals in earlier grades often find the rounding requirements in confidence intervals particularly challenging, making strong foundational number sense critical for success.
How do confidence intervals connect to real-world applications?
Confidence intervals provide a range of values within which a population parameter likely falls, along with a confidence level (typically 90%, 95%, or 99%). Students calculate these intervals using sample data and learn to interpret statements like "we are 95% confident the true mean falls between 42.3 and 48.7." Understanding proper rounding ensures the interval maintains statistical validity while matching the precision of the measured data.
This skill appears constantly in STEM fields and everyday decision-making. Medical researchers use confidence intervals to report clinical trial results, quality control engineers apply them to manufacturing tolerances, and polling organizations rely on them for election forecasts. When students see a news report stating "the margin of error is plus or minus 3 percentage points," they're encountering confidence intervals. Environmental scientists analyzing water quality samples, economists forecasting unemployment rates, and sports analysts predicting performance all depend on confidence intervals to communicate uncertainty alongside their estimates.
How can teachers use these statistics worksheets effectively in class?
These worksheets support learning through progressive skill development, starting with concrete data organization methods like tally charts before advancing to more abstract concepts like set notation and confidence intervals. The variety of graphical representations helps students recognize which visualization best communicates specific types of data relationships. Complete answer keys allow teachers to quickly assess understanding and identify where students need additional support with calculation steps or graphical accuracy.
Many teachers use these worksheets for differentiated instruction, assigning tally chart and basic graphing practice to students who need foundational reinforcement while challenging advanced learners with confidence interval calculations. The worksheets work well for paired activities where one student creates a data display and their partner interprets it, promoting mathematical discussion. Teachers also find them valuable for pre-assessment before introducing new statistical software or graphing calculators, since strong hand-drawing skills help students understand what technology automates. The answer keys make these worksheets practical for homework with self-checking or for test review stations.