Integrated Math 3 Real Life Graphs Worksheets
All worksheets are created by the team of experienced teachers at Cazoom Math.
What Do Real Life Graphs Cover in Integrated Math 3?
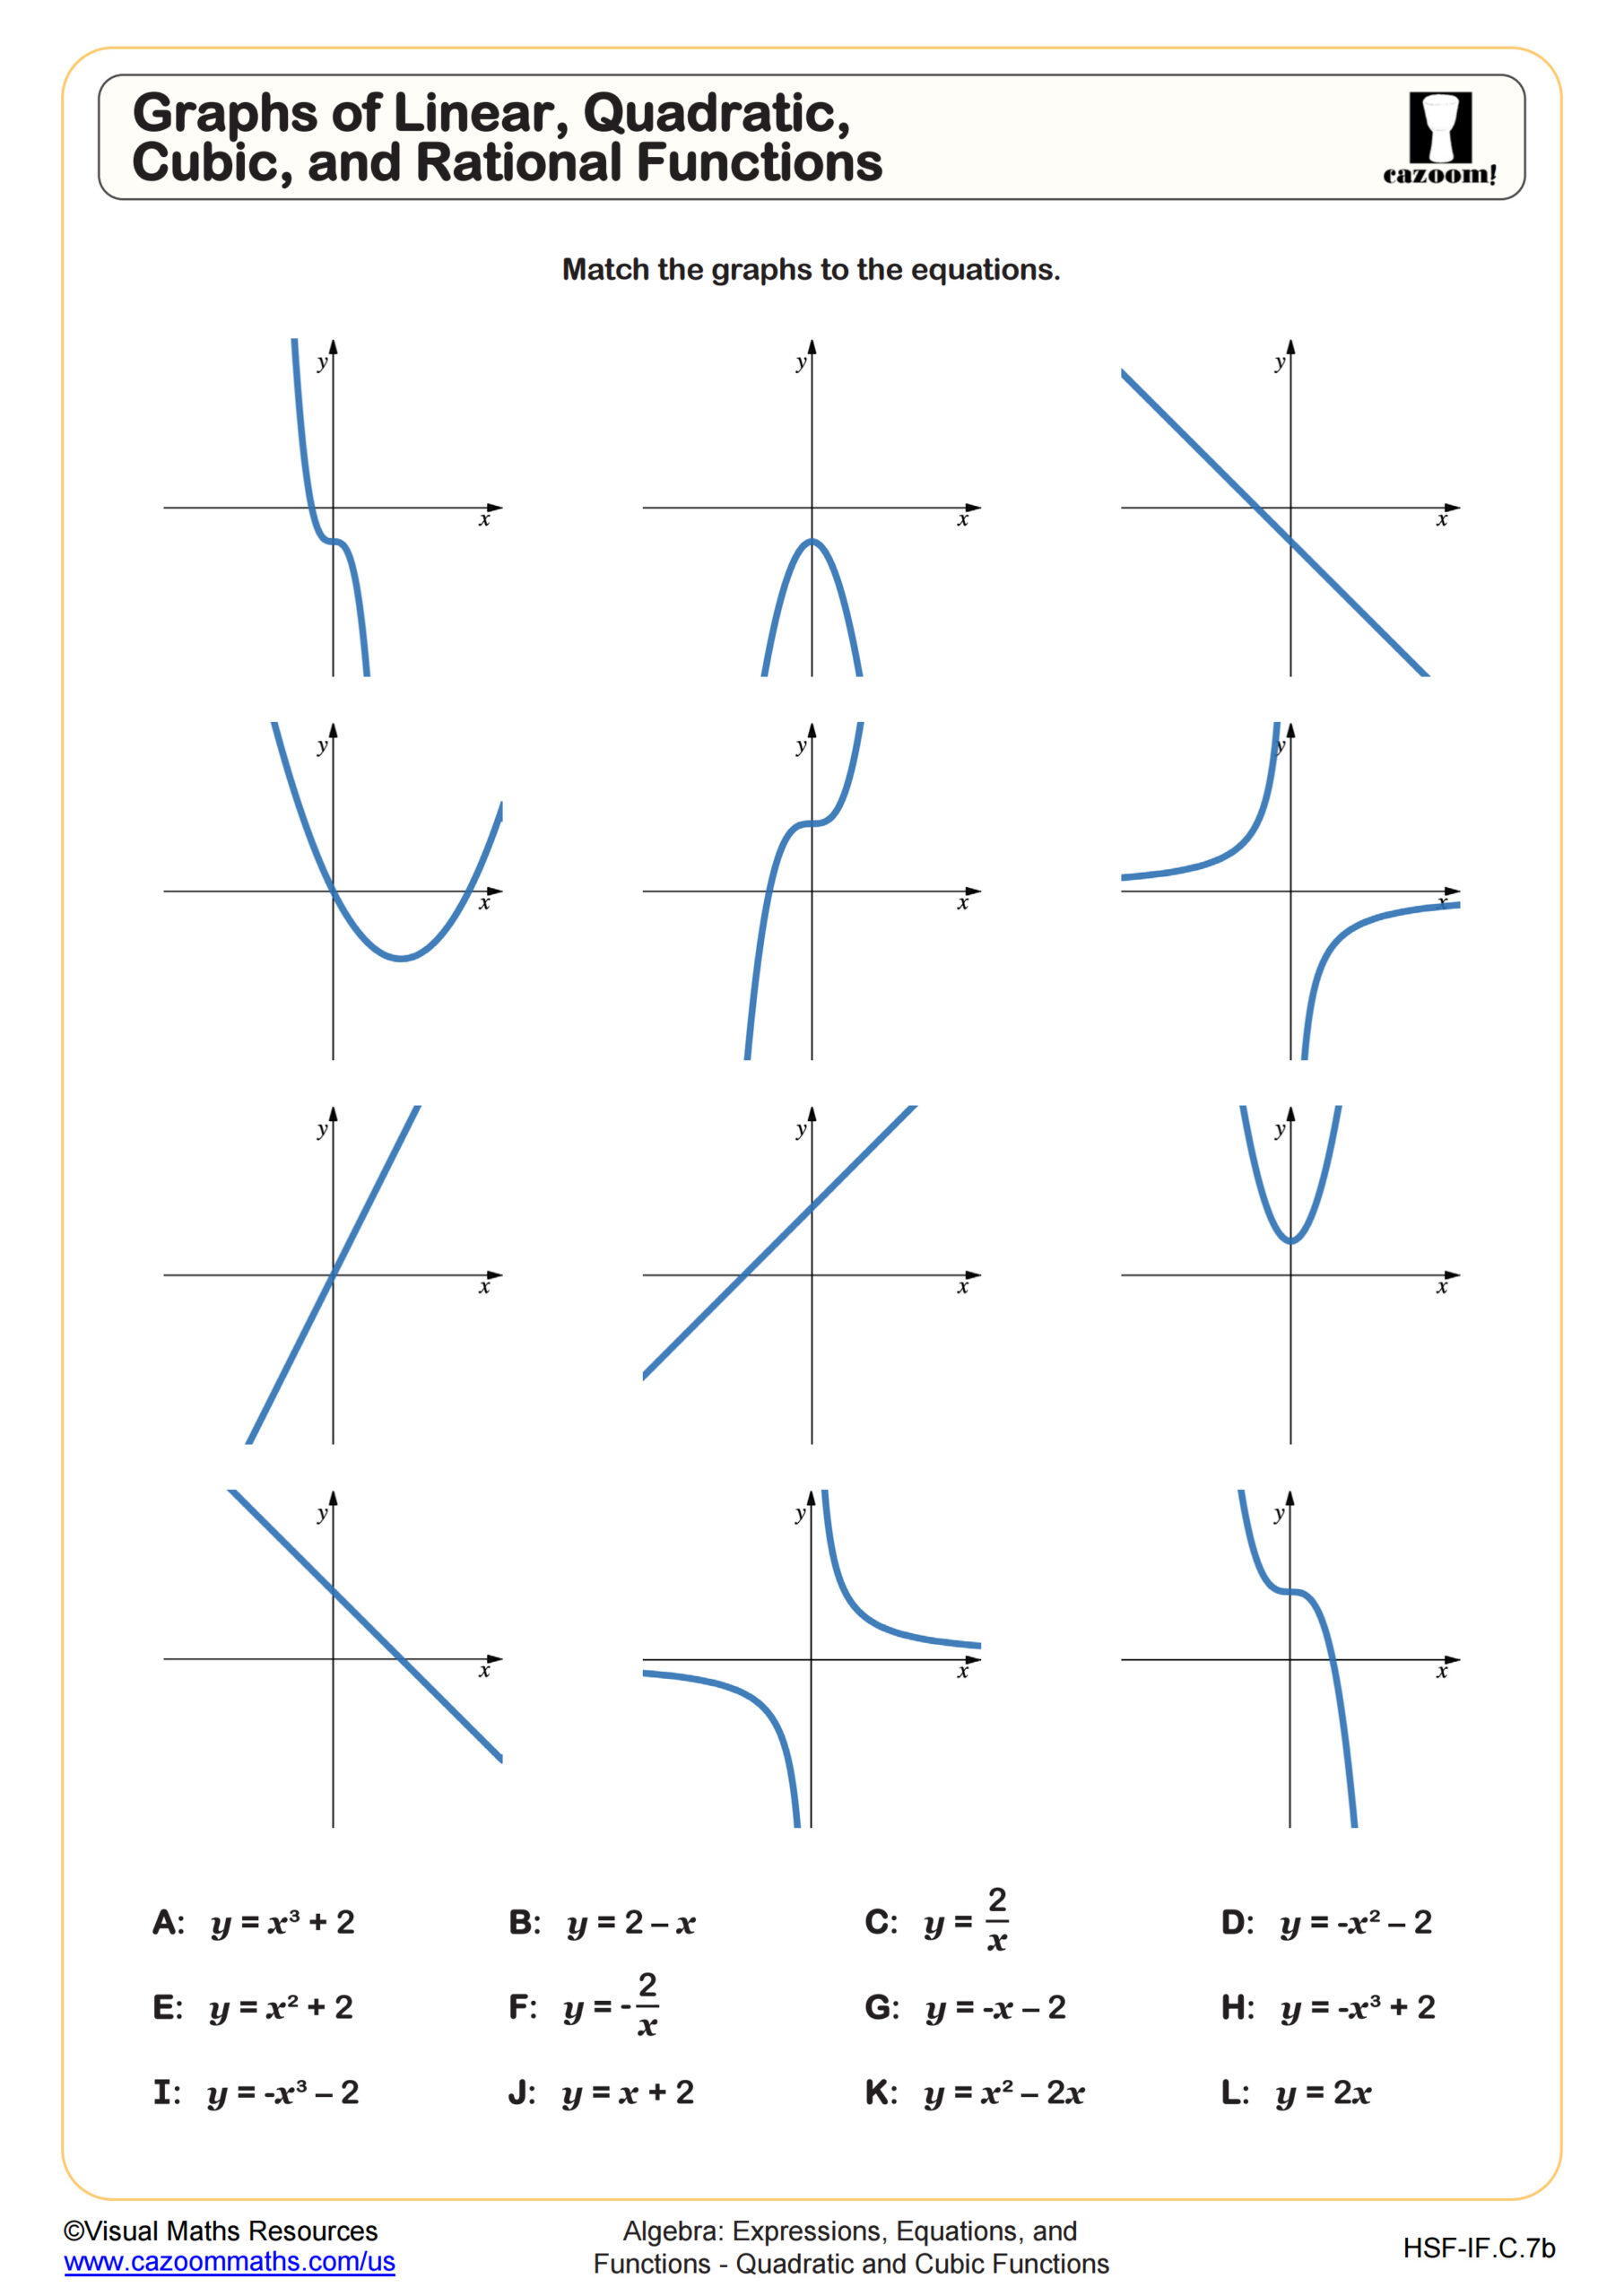
Real life graphs in Integrated Math 3 focus on interpreting and creating graphs of linear, quadratic, cubic, and rational functions within real-world contexts. Students analyze how different function families behave in practical scenarios, identify key features like intercepts and asymptotes from contextual information, and determine which function type best models a given situation. This topic connects algebraic function properties with graphical representations and meaningful applications.
A common misconception is that students assume all upward curves represent quadratic functions. Many overlook cubic functions or exponential relationships, defaulting to parabolas when they see any non-linear growth. Teachers frequently need to emphasize examining end behavior and rate of change to distinguish between function types, particularly when graphs show limited domains that hide characteristic behaviors.
How Are Real Life Graphs Tested on Standardized Assessments?
The SAT and ACT regularly include questions requiring students to match real-world scenarios with appropriate function graphs or interpret graphical data to answer context-based questions. These assessments expect students to identify function types from graph shapes, extract information from intercepts and asymptotes, and translate between verbal descriptions and visual representations. State tests often present multi-step problems where students must first interpret a graph, then perform calculations based on that interpretation.
Students lose points when they misread axis labels or fail to notice scale changes, leading to incorrect interpretations of rates and quantities. Another frequent error occurs when students don't recognize that rational functions with horizontal asymptotes represent situations with limiting values, such as maximum capacity or terminal velocity. Test questions deliberately include distractors that match common misinterpretations of graph features.
Why Is Identifying Function Type From Graph Shape Important?
Recognizing function families by their characteristic graph shapes allows students to make predictions about behavior and select appropriate models for real situations. Linear graphs show constant rates, quadratics display symmetry with one turning point, cubic functions have different end behaviors in opposite directions, and rational functions feature asymptotes where values approach but never reach certain limits. This visual recognition skill supports both analysis and modeling tasks throughout higher mathematics.
Engineers and data scientists rely on this skill when selecting models for real phenomena. A company analyzing sales trends needs to distinguish between linear growth, quadratic decline, or rational functions approaching market saturation. College-bound students encounter this repeatedly in calculus when determining function behavior, and in statistics when choosing regression models. Physics students apply these graphs when modeling motion, electrical circuits, and thermodynamic processes.
How Do These Worksheets Support Integrated Math 3 Learning?
The worksheets present problems that require students to connect function properties with real-world scenarios, moving beyond abstract graphing to meaningful interpretation. Problems guide students through analyzing graphs that represent practical situations, identifying function types based on visual characteristics, and extracting relevant information from key features. Complete answer keys allow students to check their reasoning and understand where interpretation errors occur.
Teachers use these materials for formative assessment before unit tests, identifying which students confuse function families or struggle with contextual interpretation. The worksheets work well for paired activities where students discuss which function type fits a scenario and justify their reasoning. Many teachers assign these as review before state assessments or standardized tests, since graph interpretation appears consistently on those exams. The real-world contexts also help students preparing for math-intensive college courses see practical applications of abstract function concepts.