Statistics Worksheets With Answers
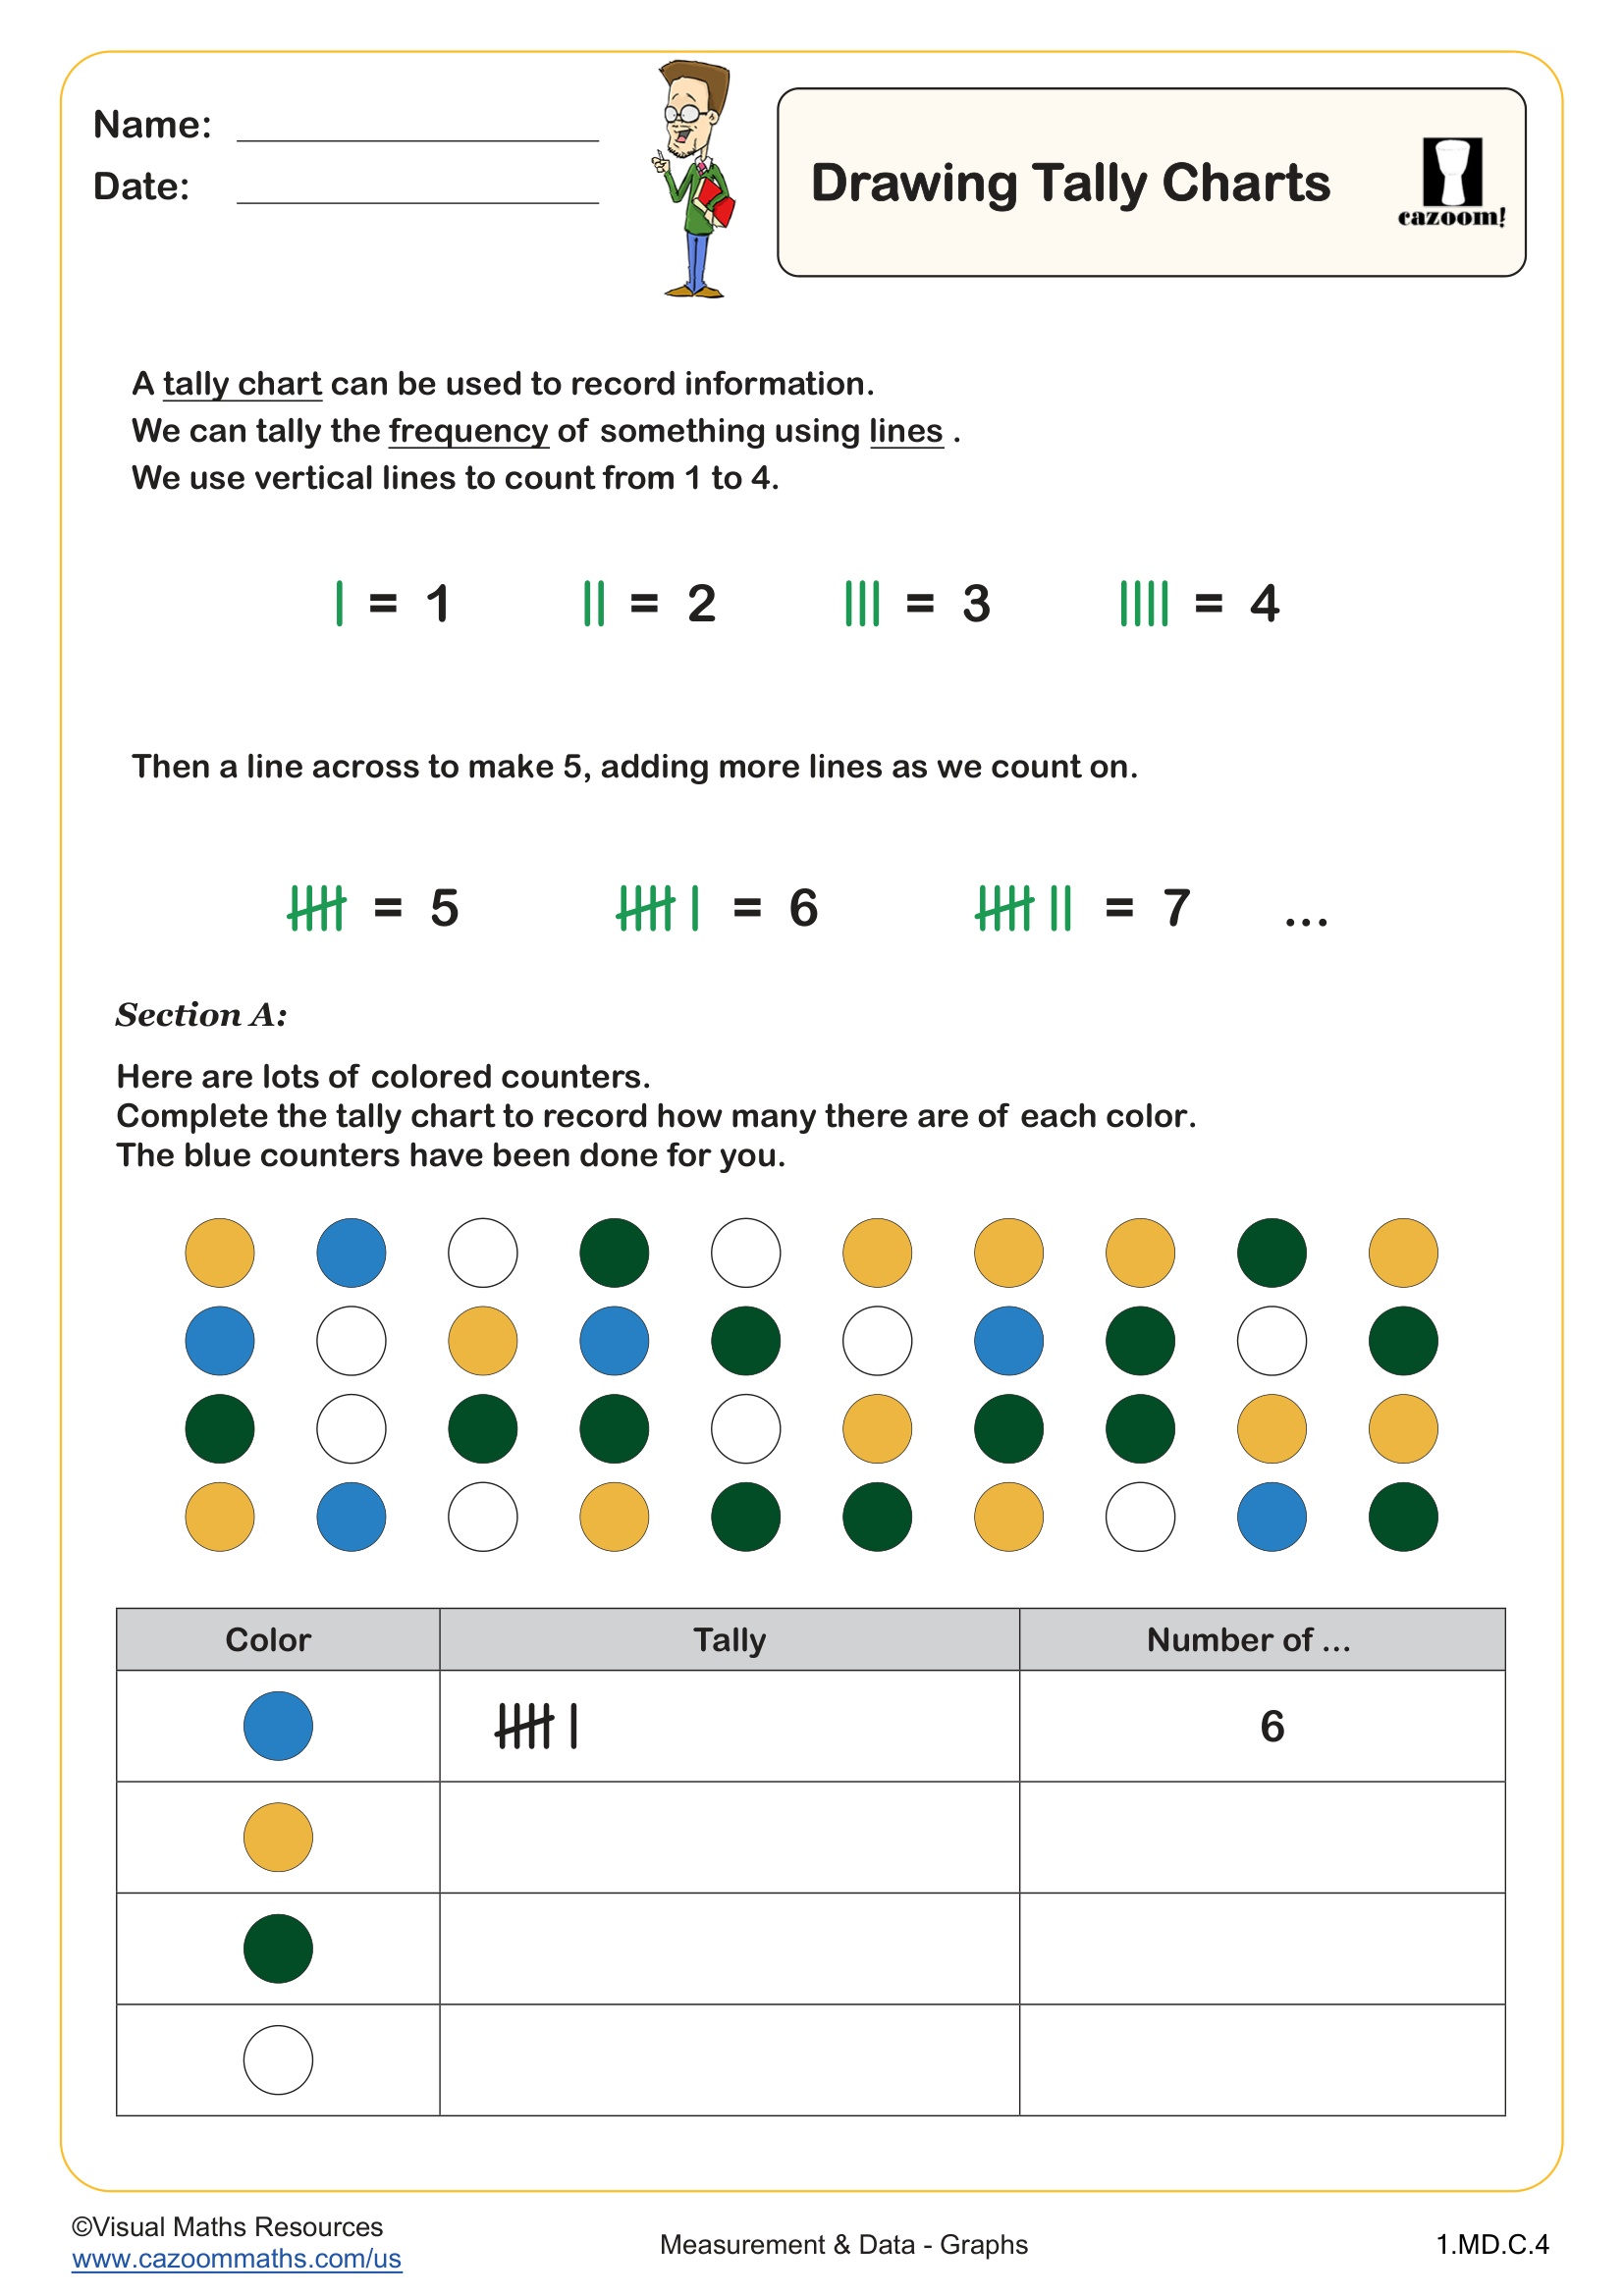
Drawing Tally Charts
Grades: 1st Grade
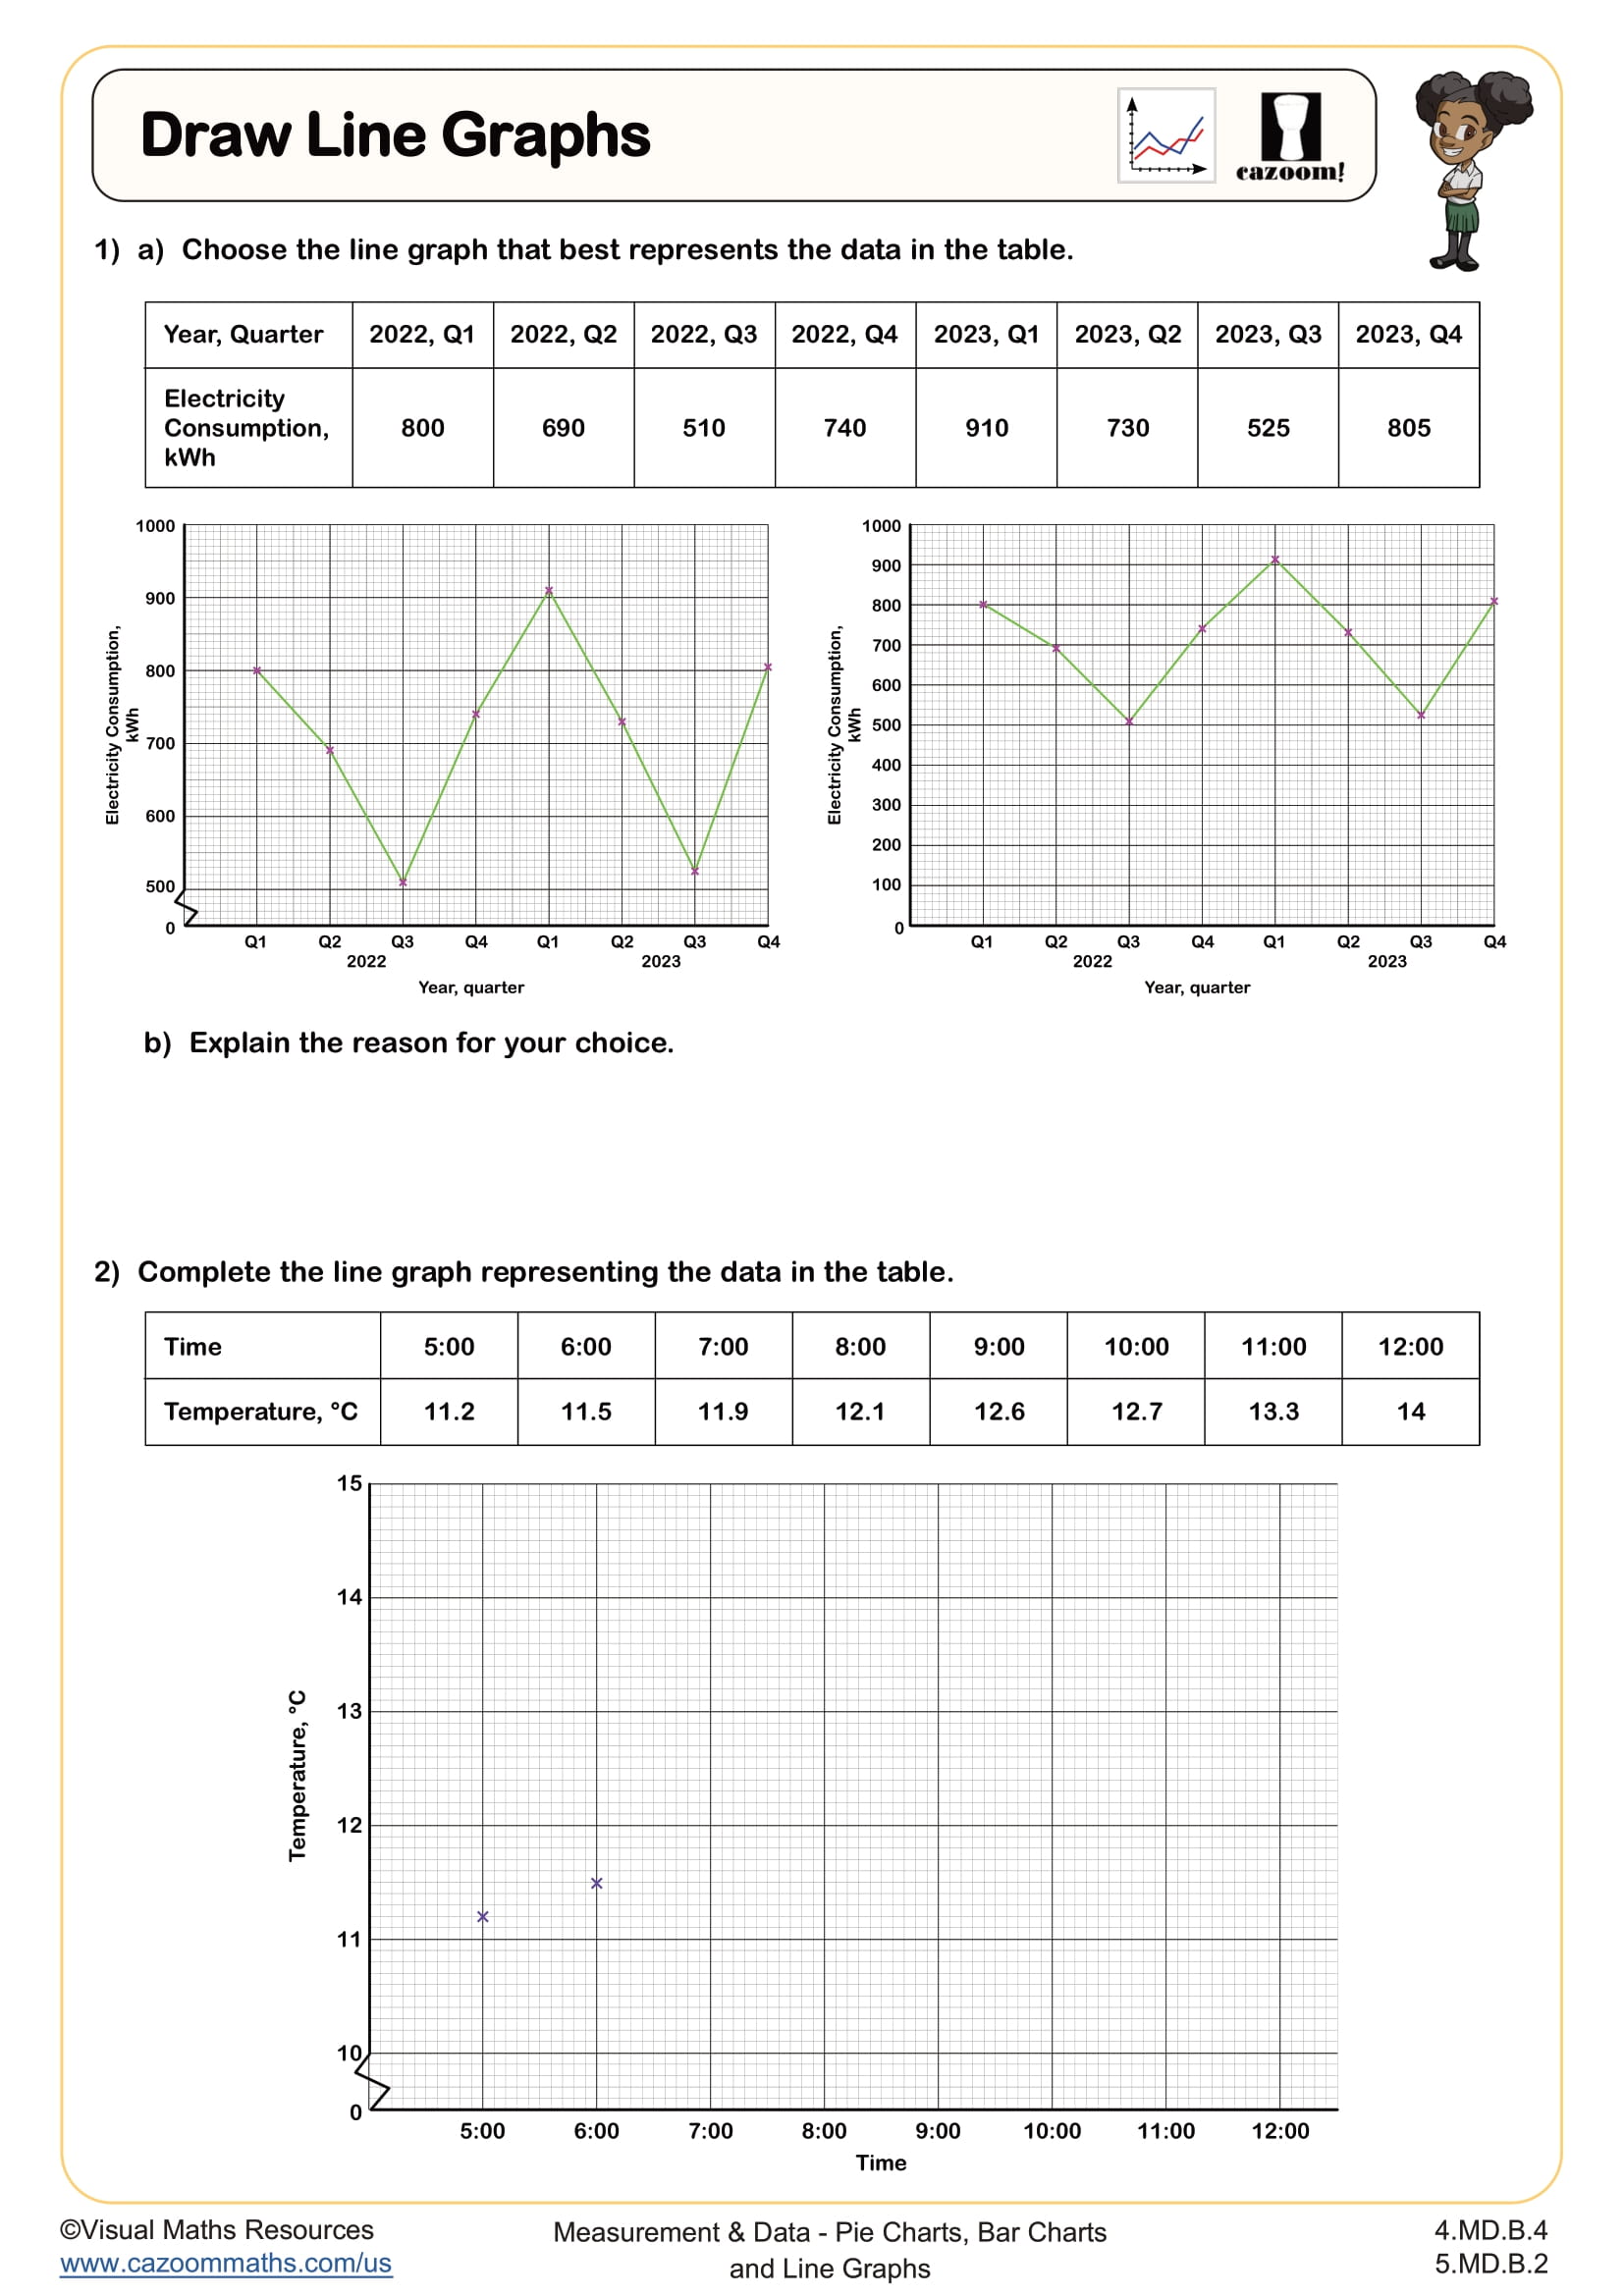
Draw Line Graphs
Grades: 4th Grade, 5th Grade
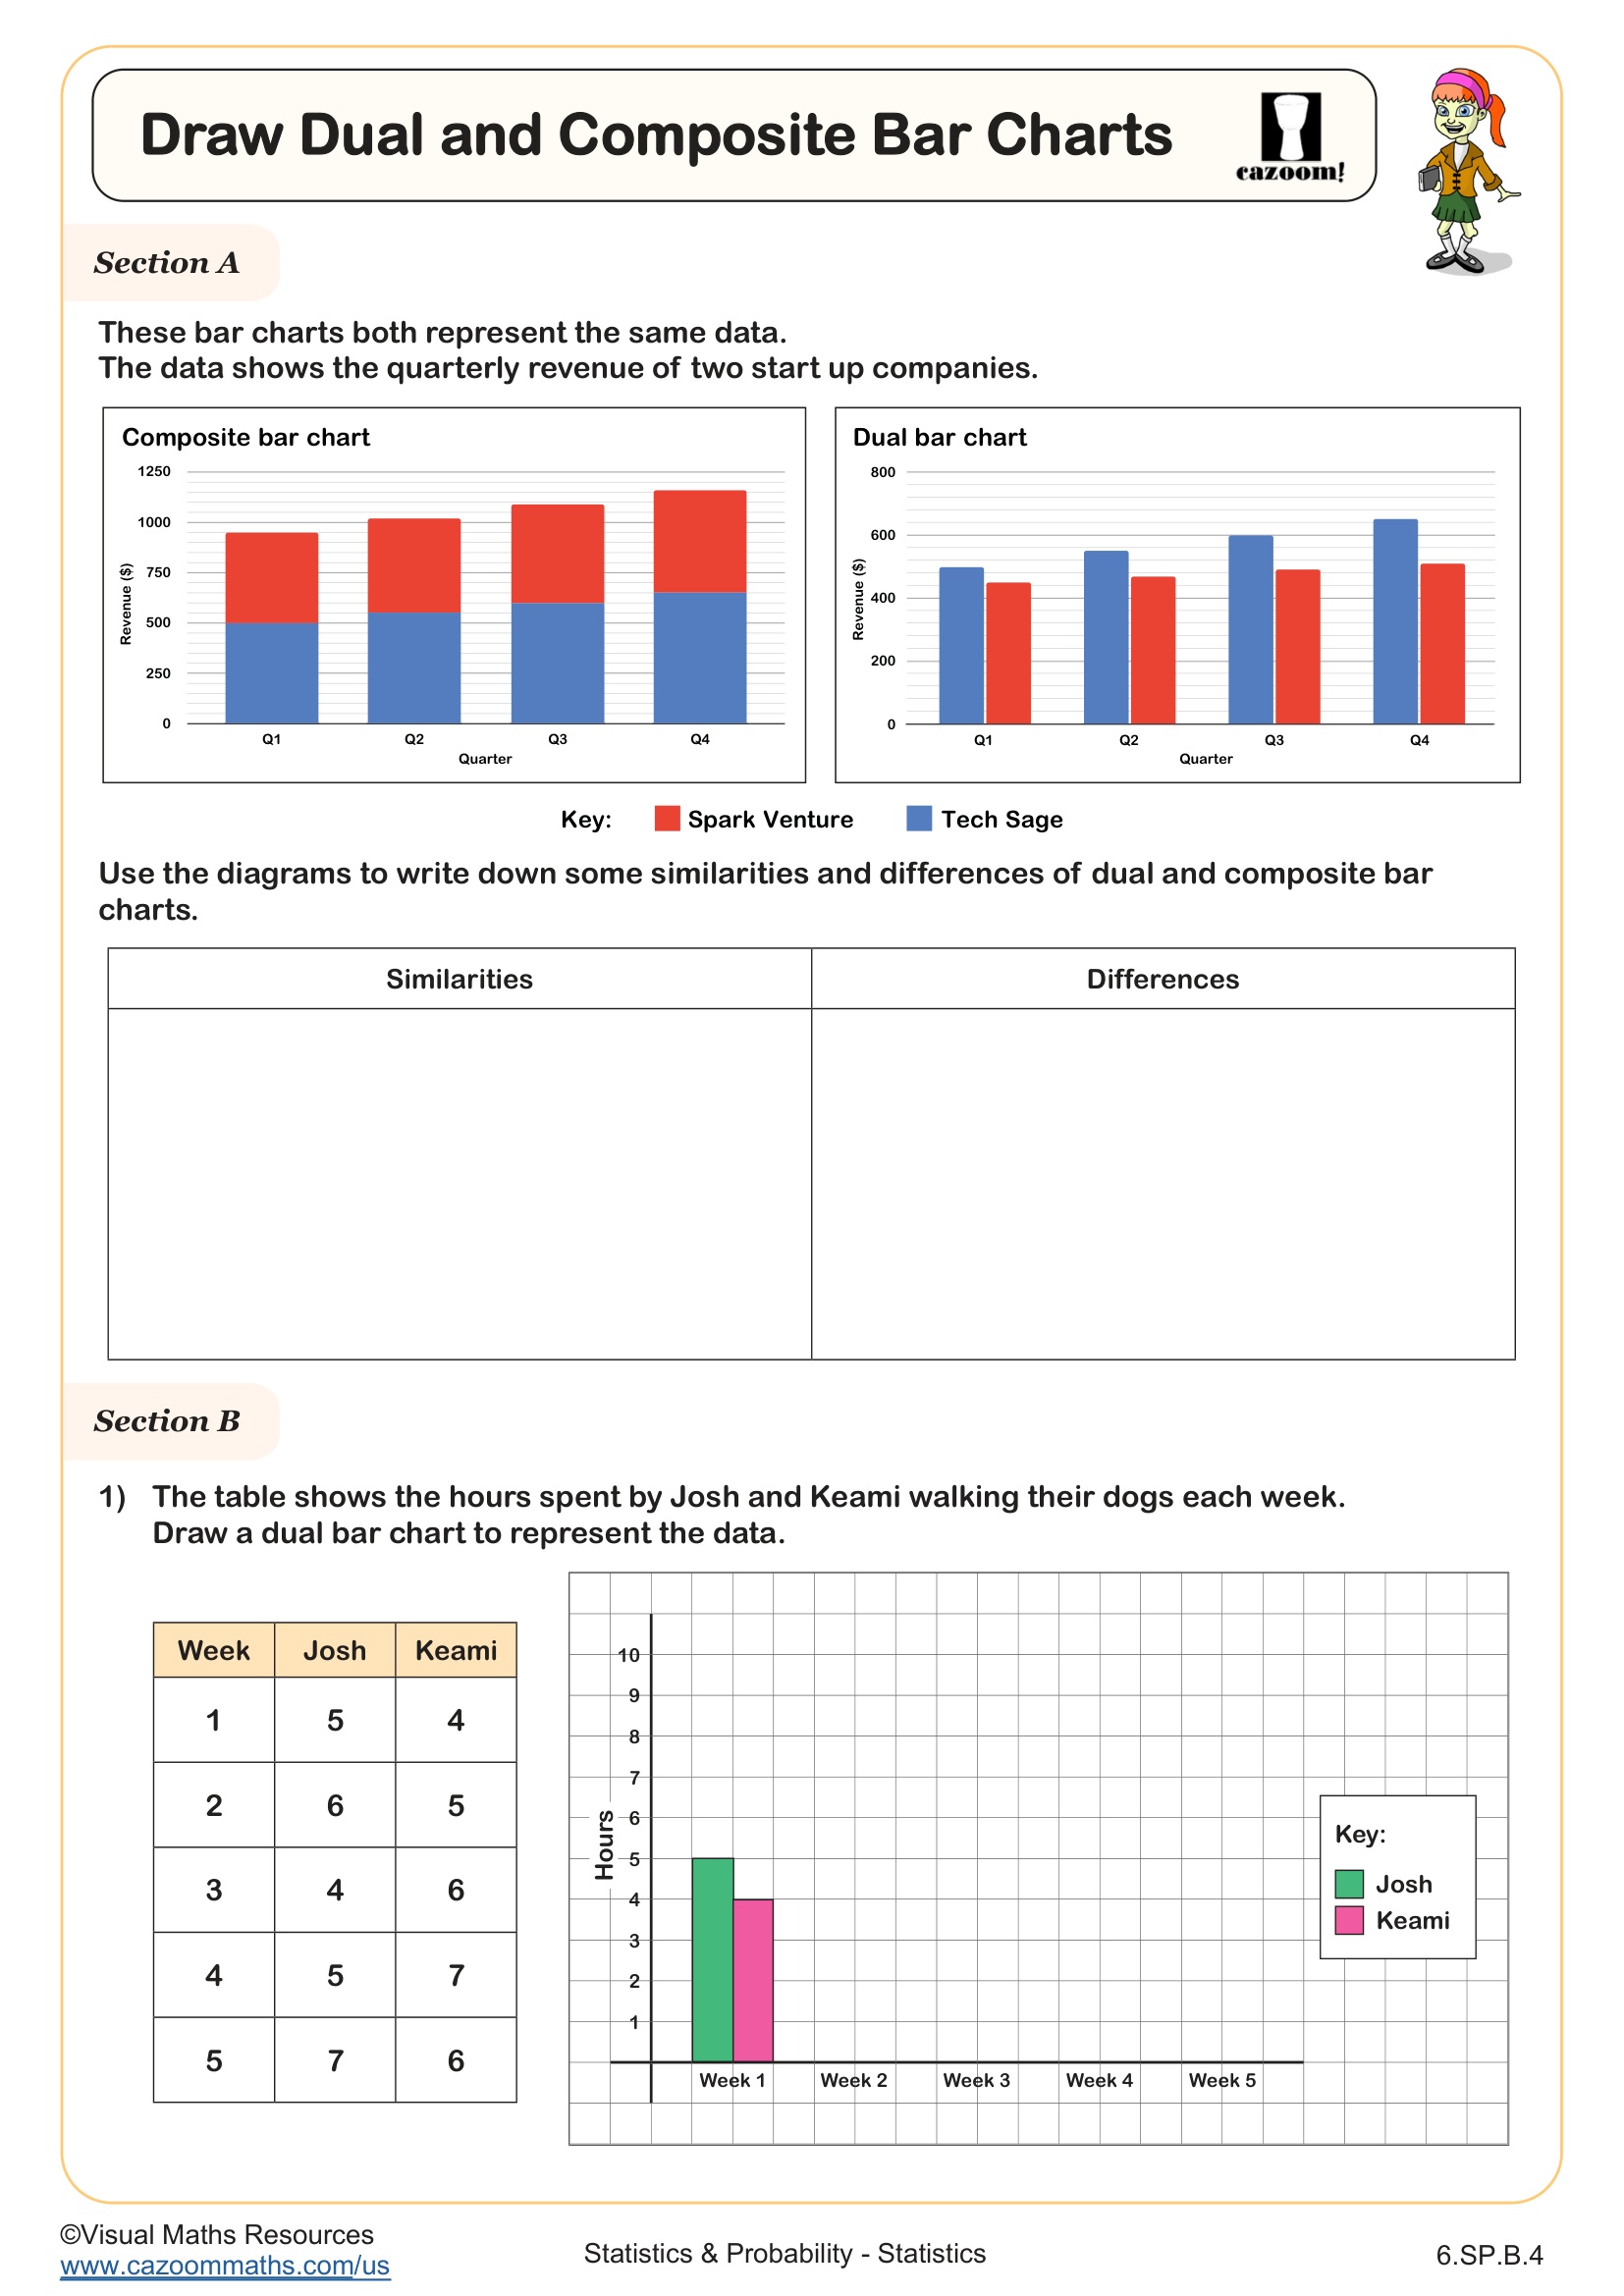
Draw Composite and Dual Bar Charts
Grades: 6th Grade
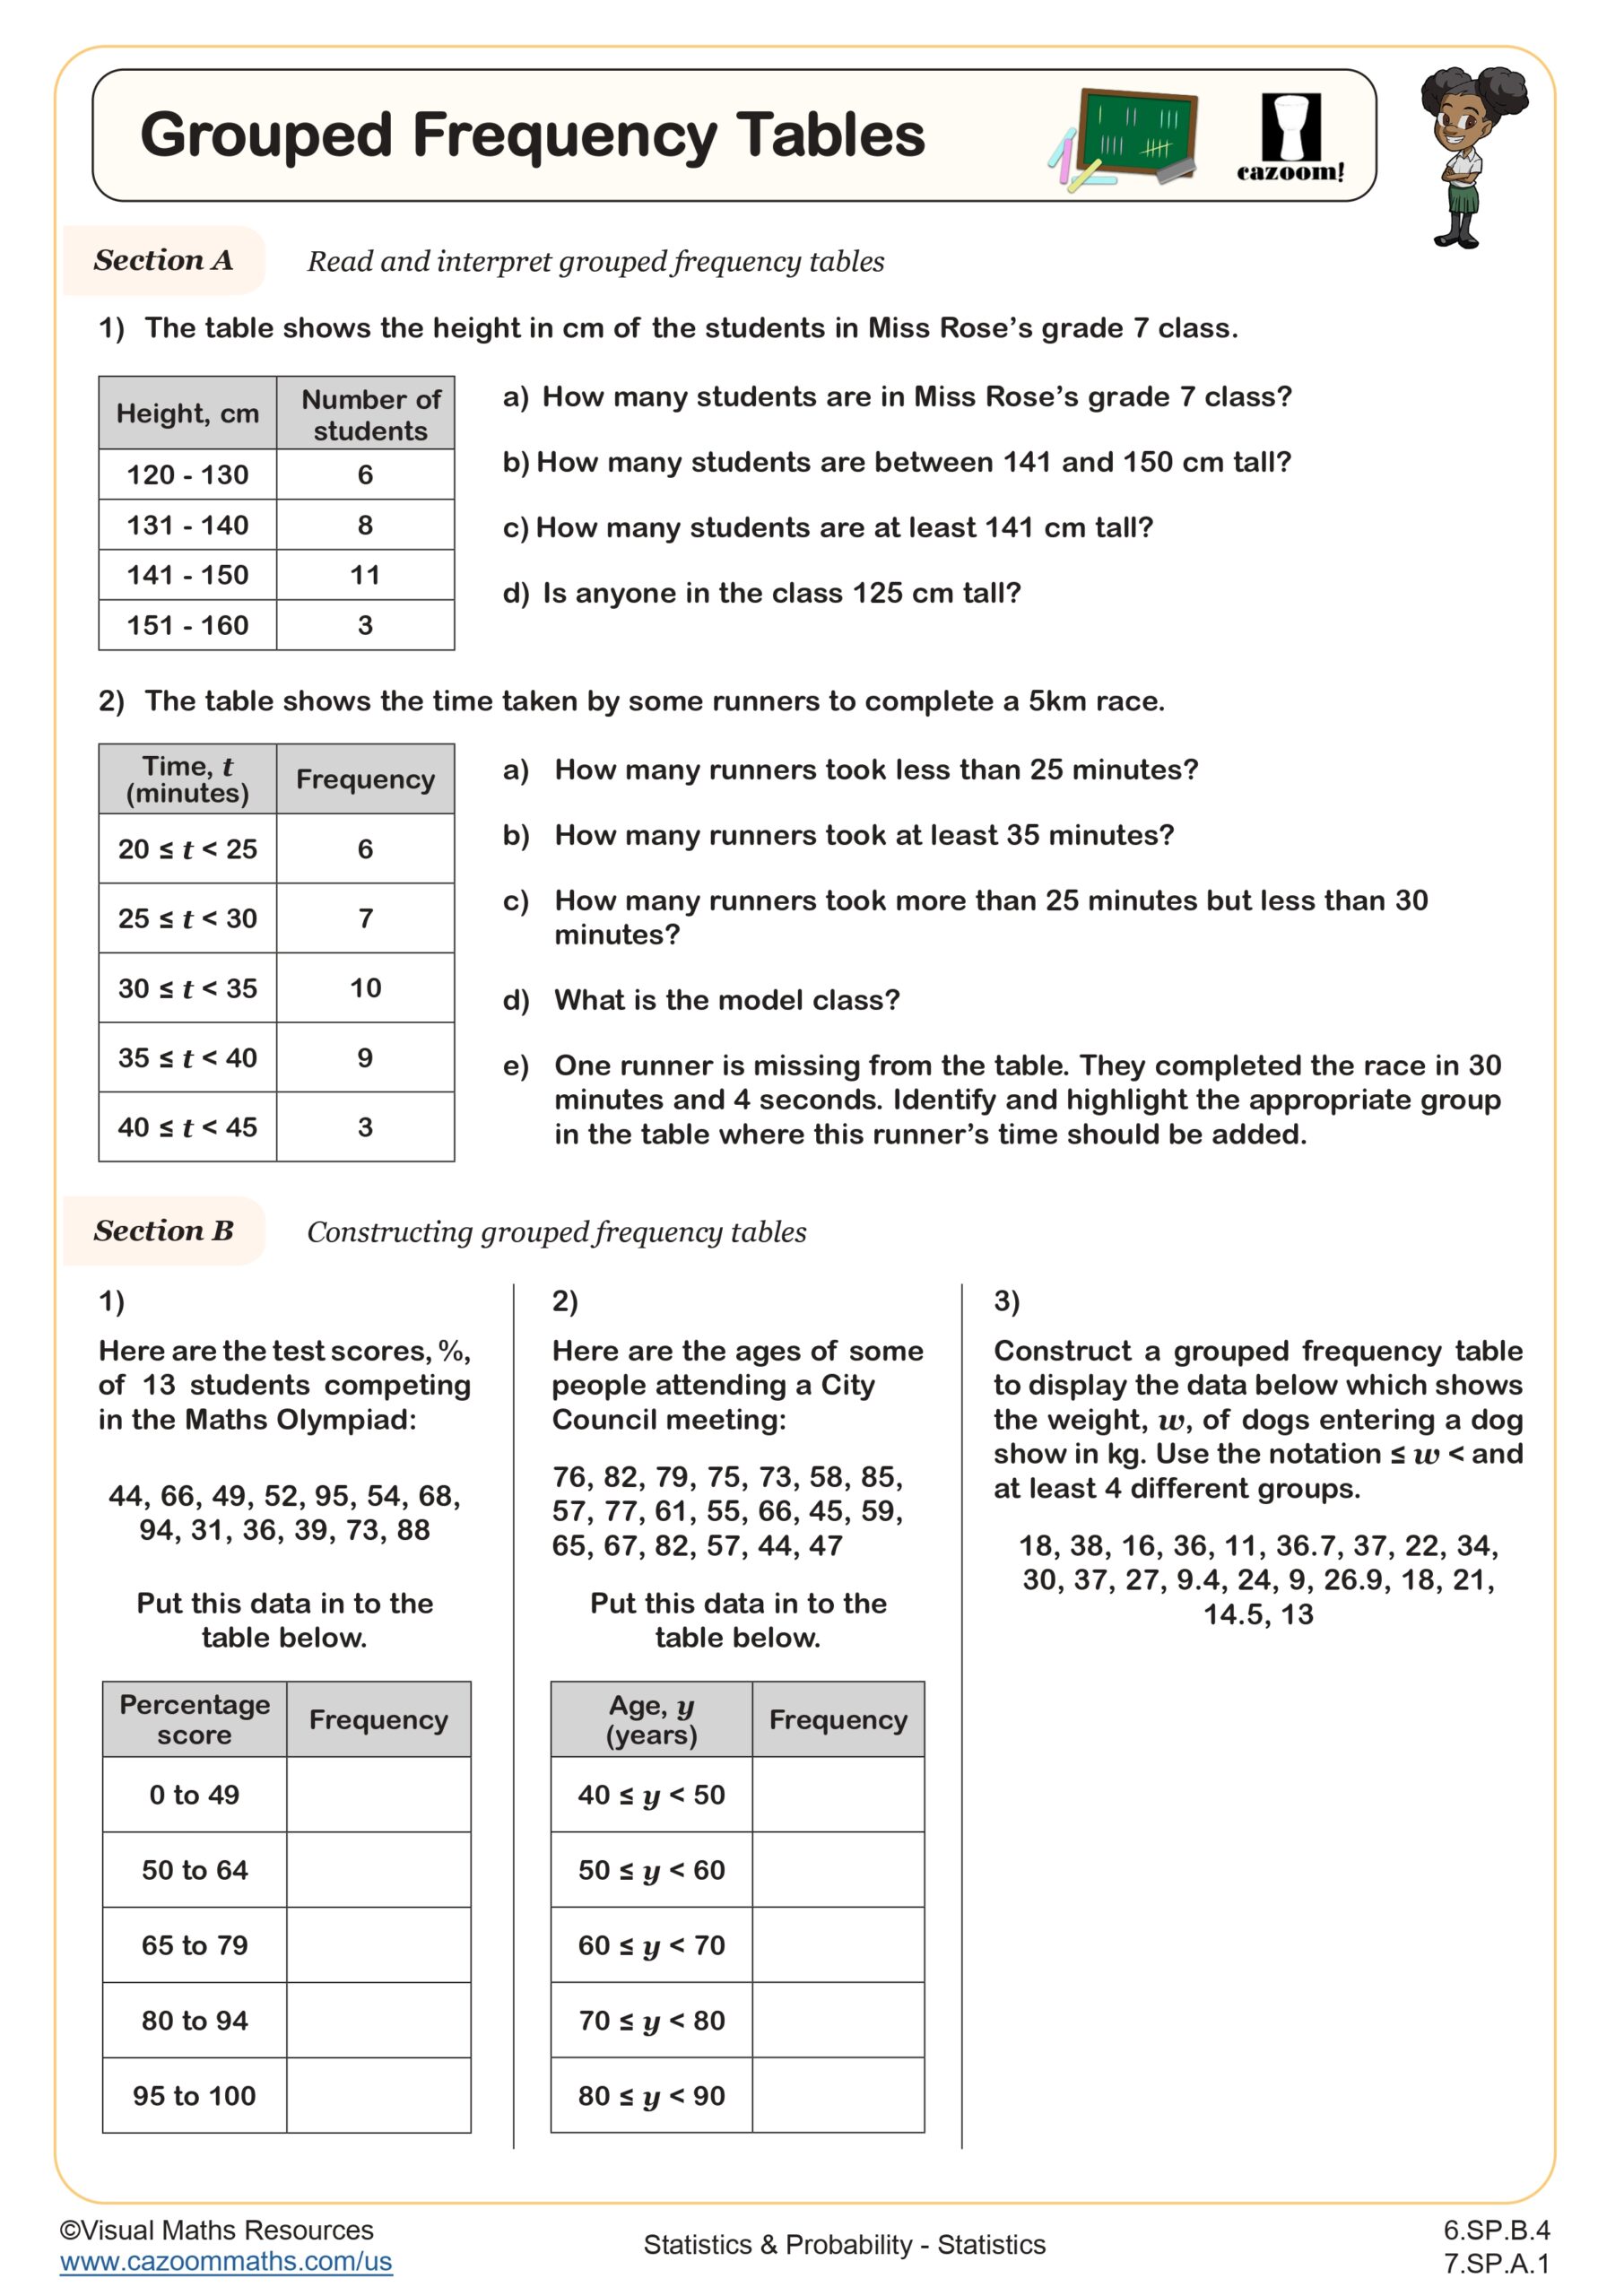
Grouped Frequency Tables
Grades: 6th Grade, 7th Grade
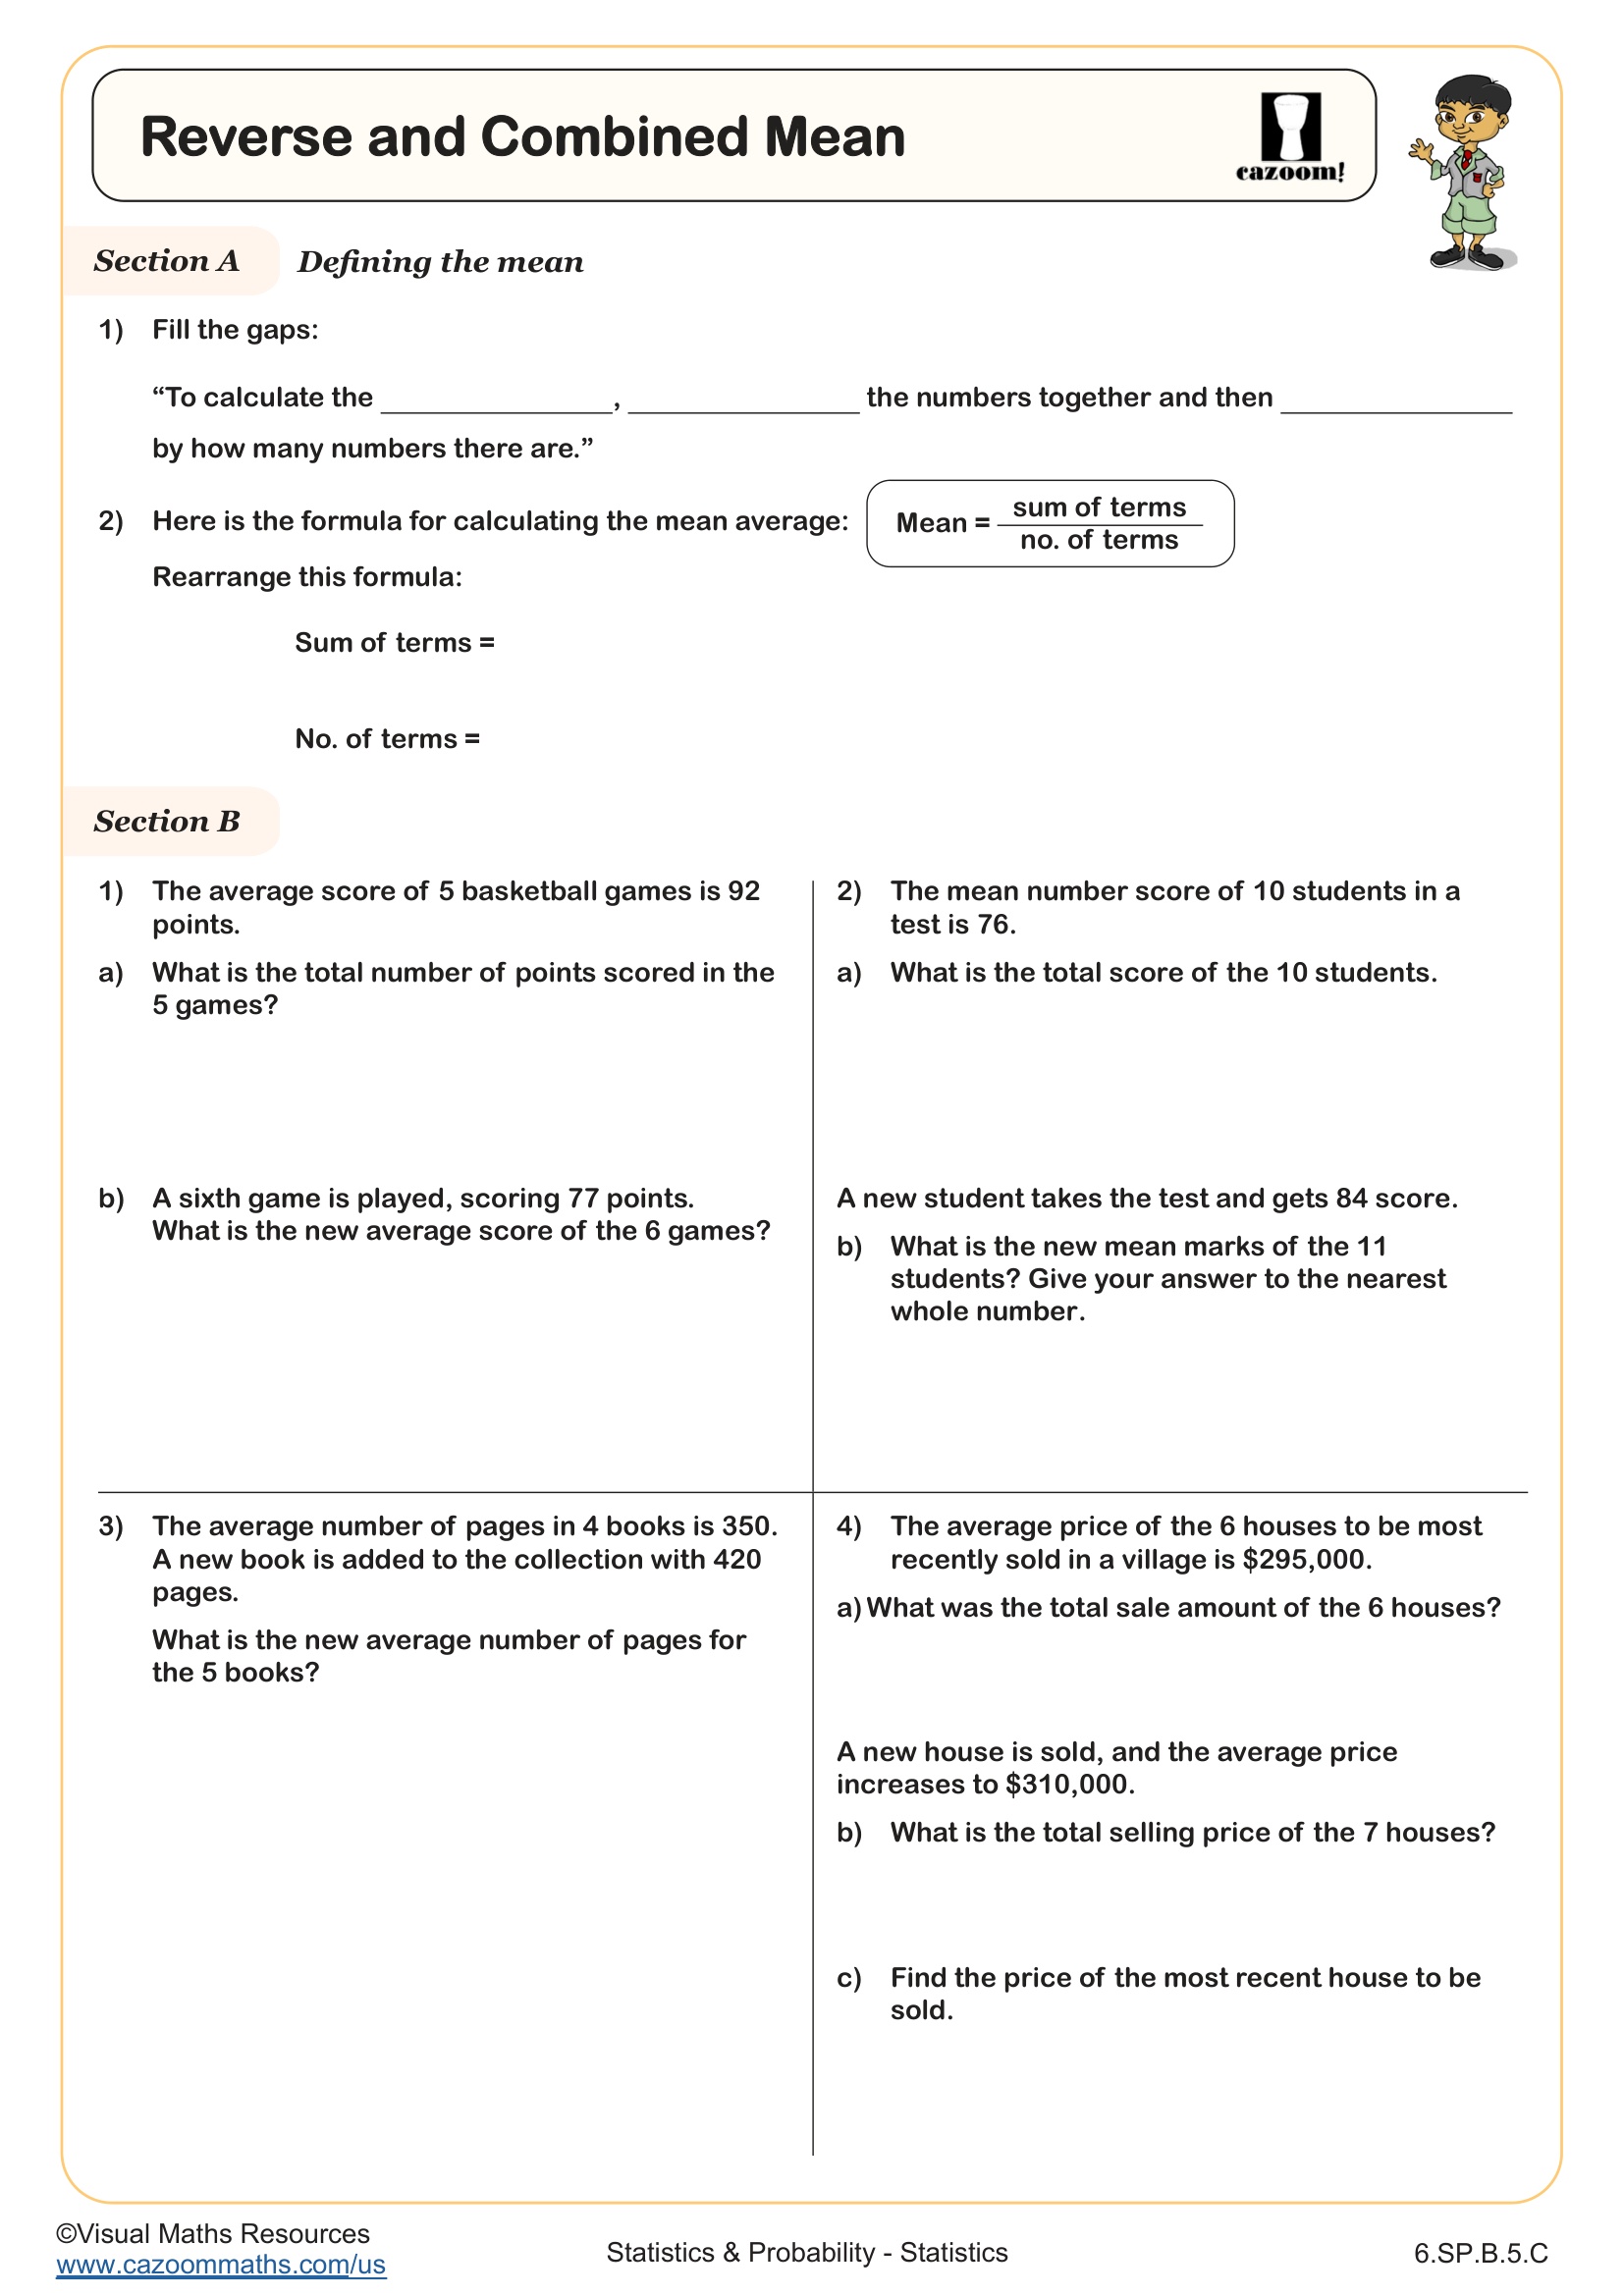
Reverse and Combined Mean
Grades: 6th Grade
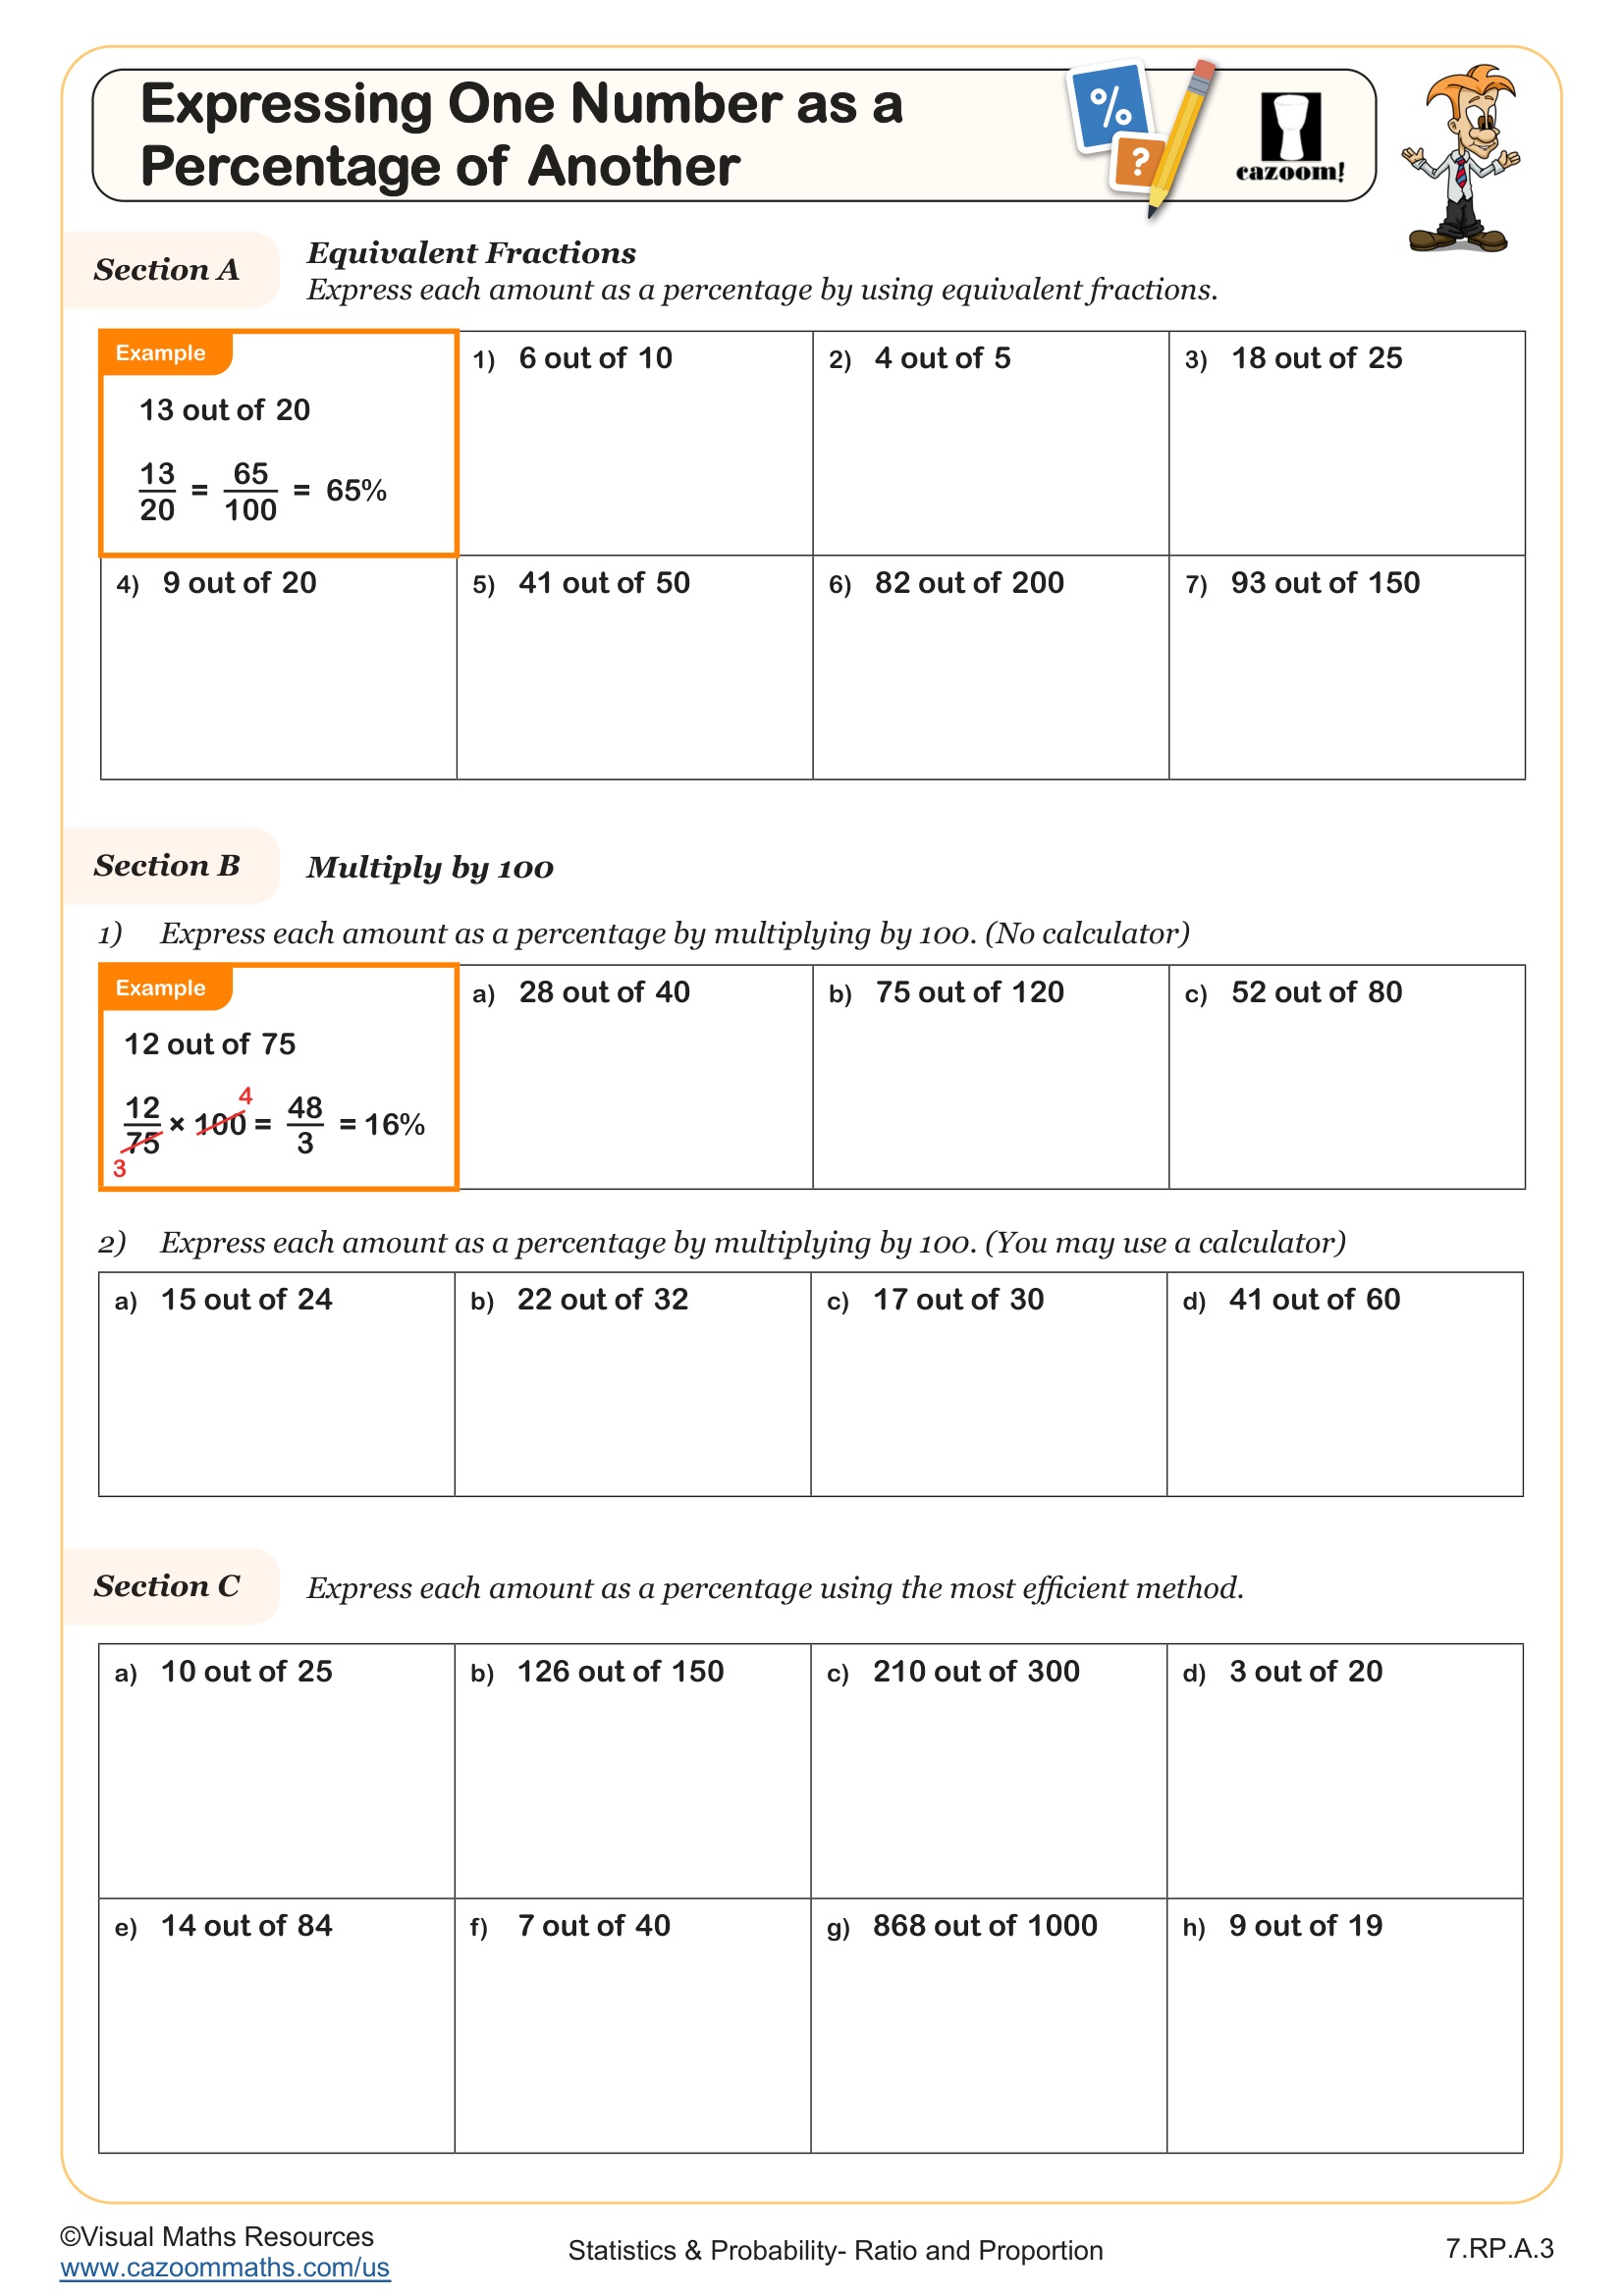
Express One Number as a Percentage of Another
Grades: 7th Grade
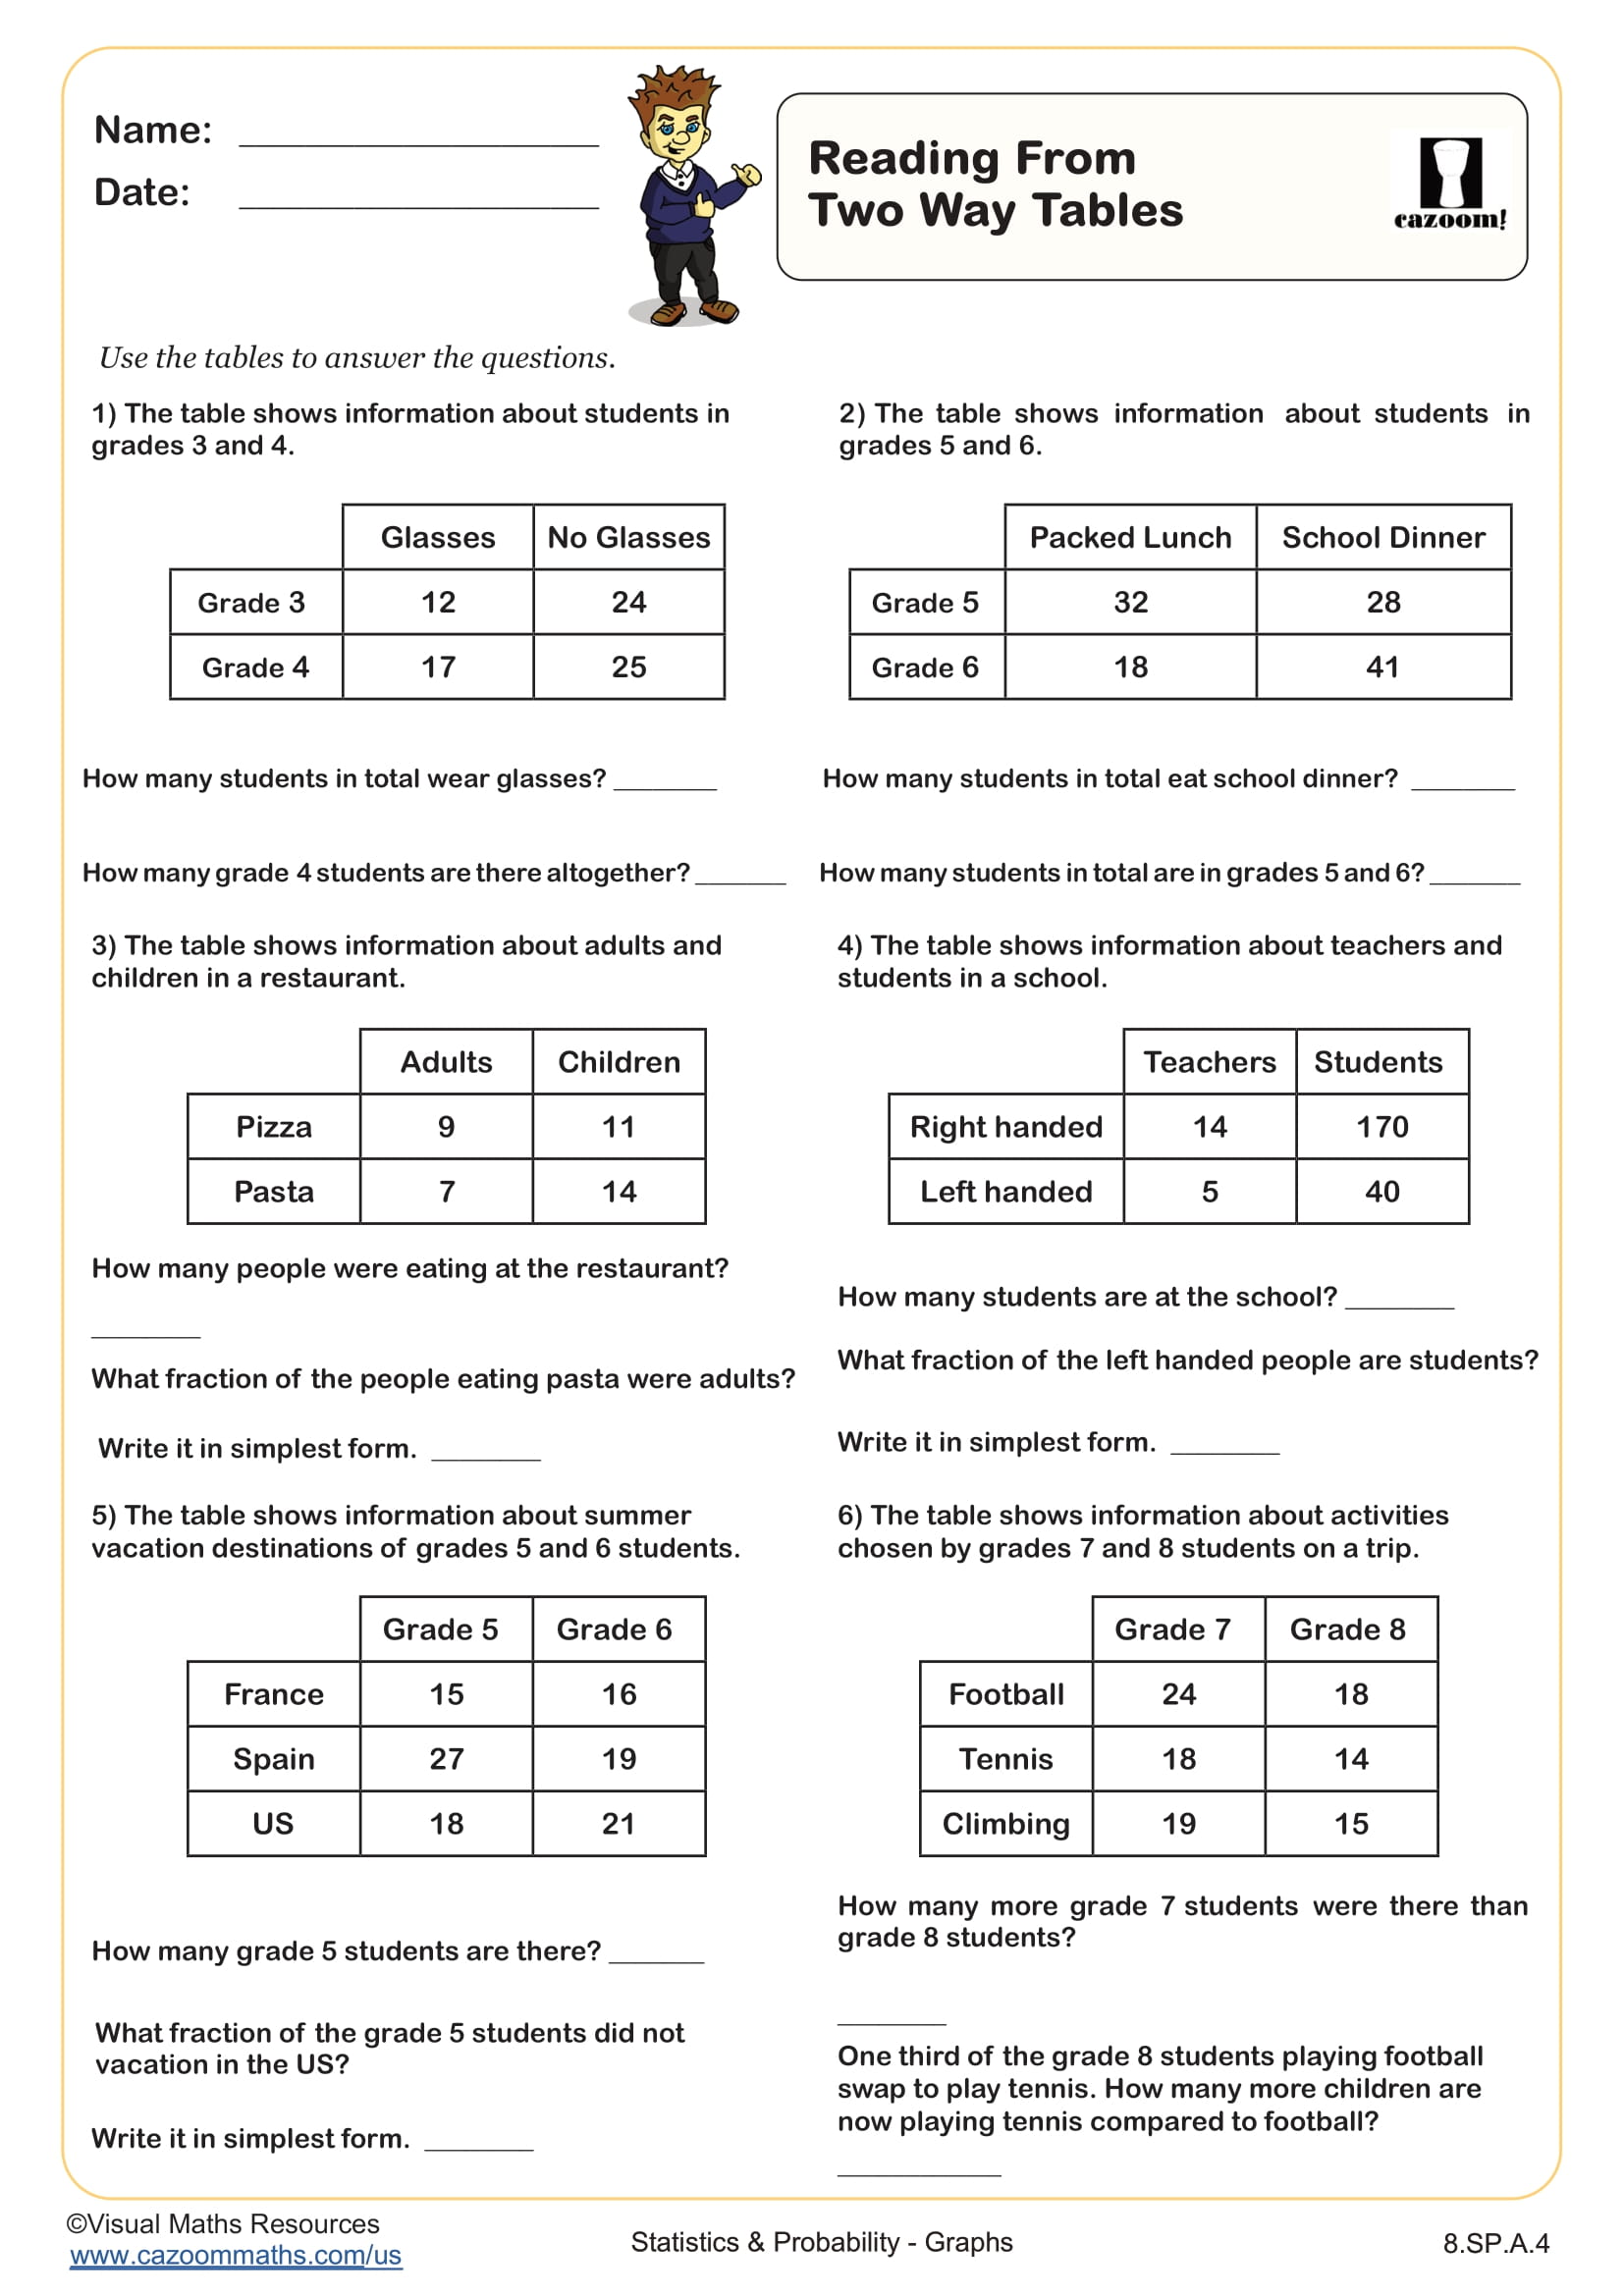
Reading from Two Way Tables
Grades: 8th Grade, IM 1
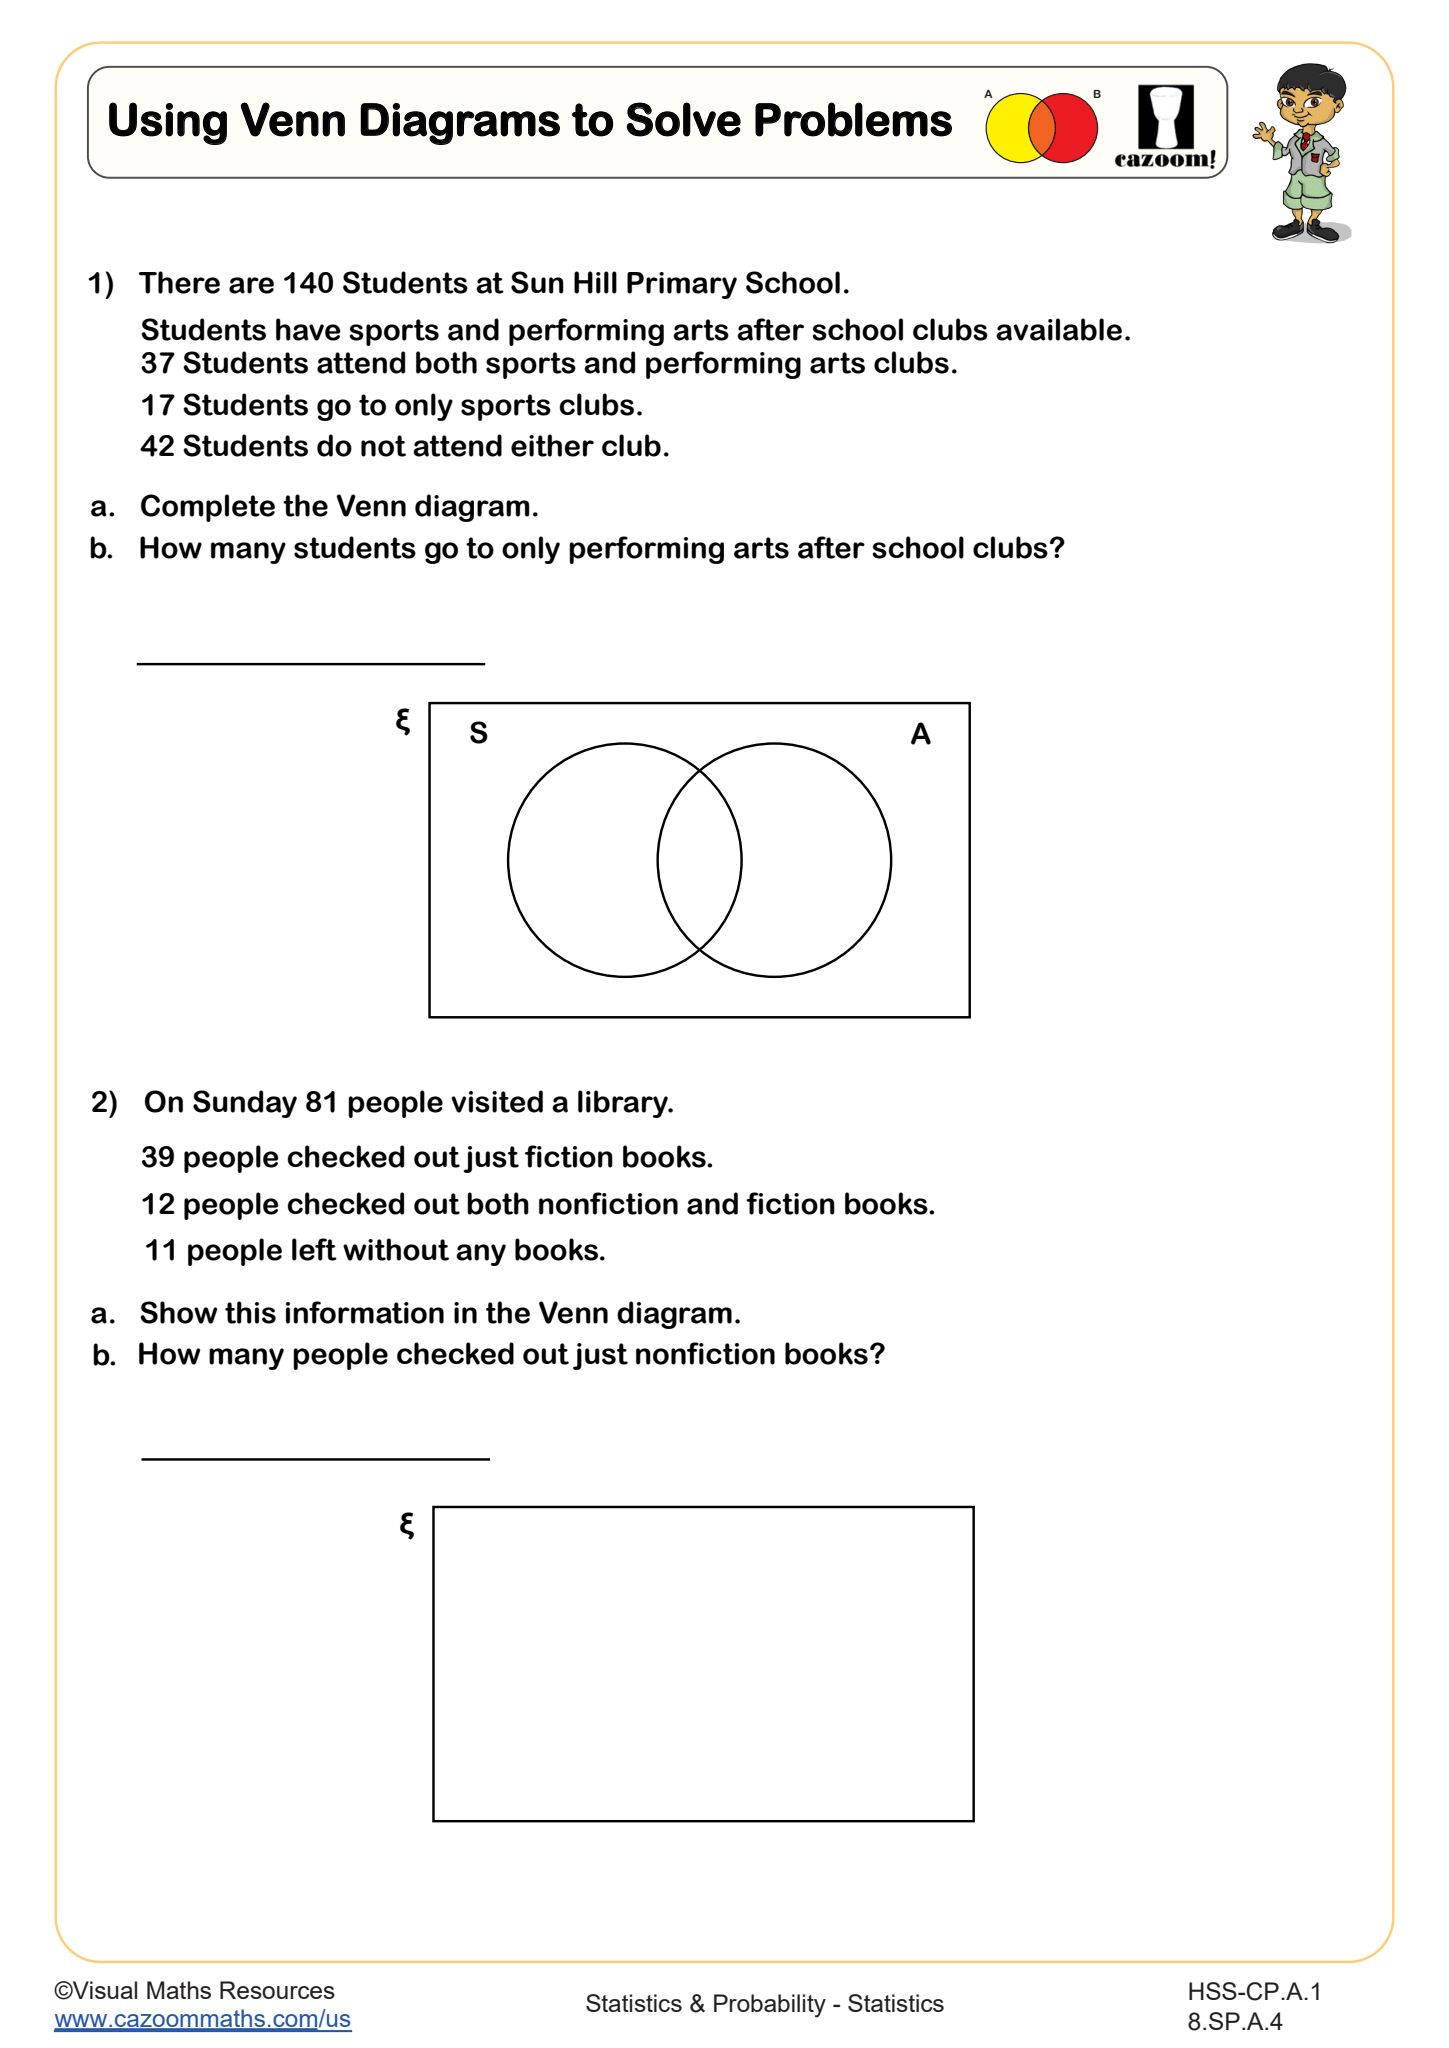
Using Venn Diagrams to Solve Problems
Grades: 8th Grade, Algebra I, IM 1
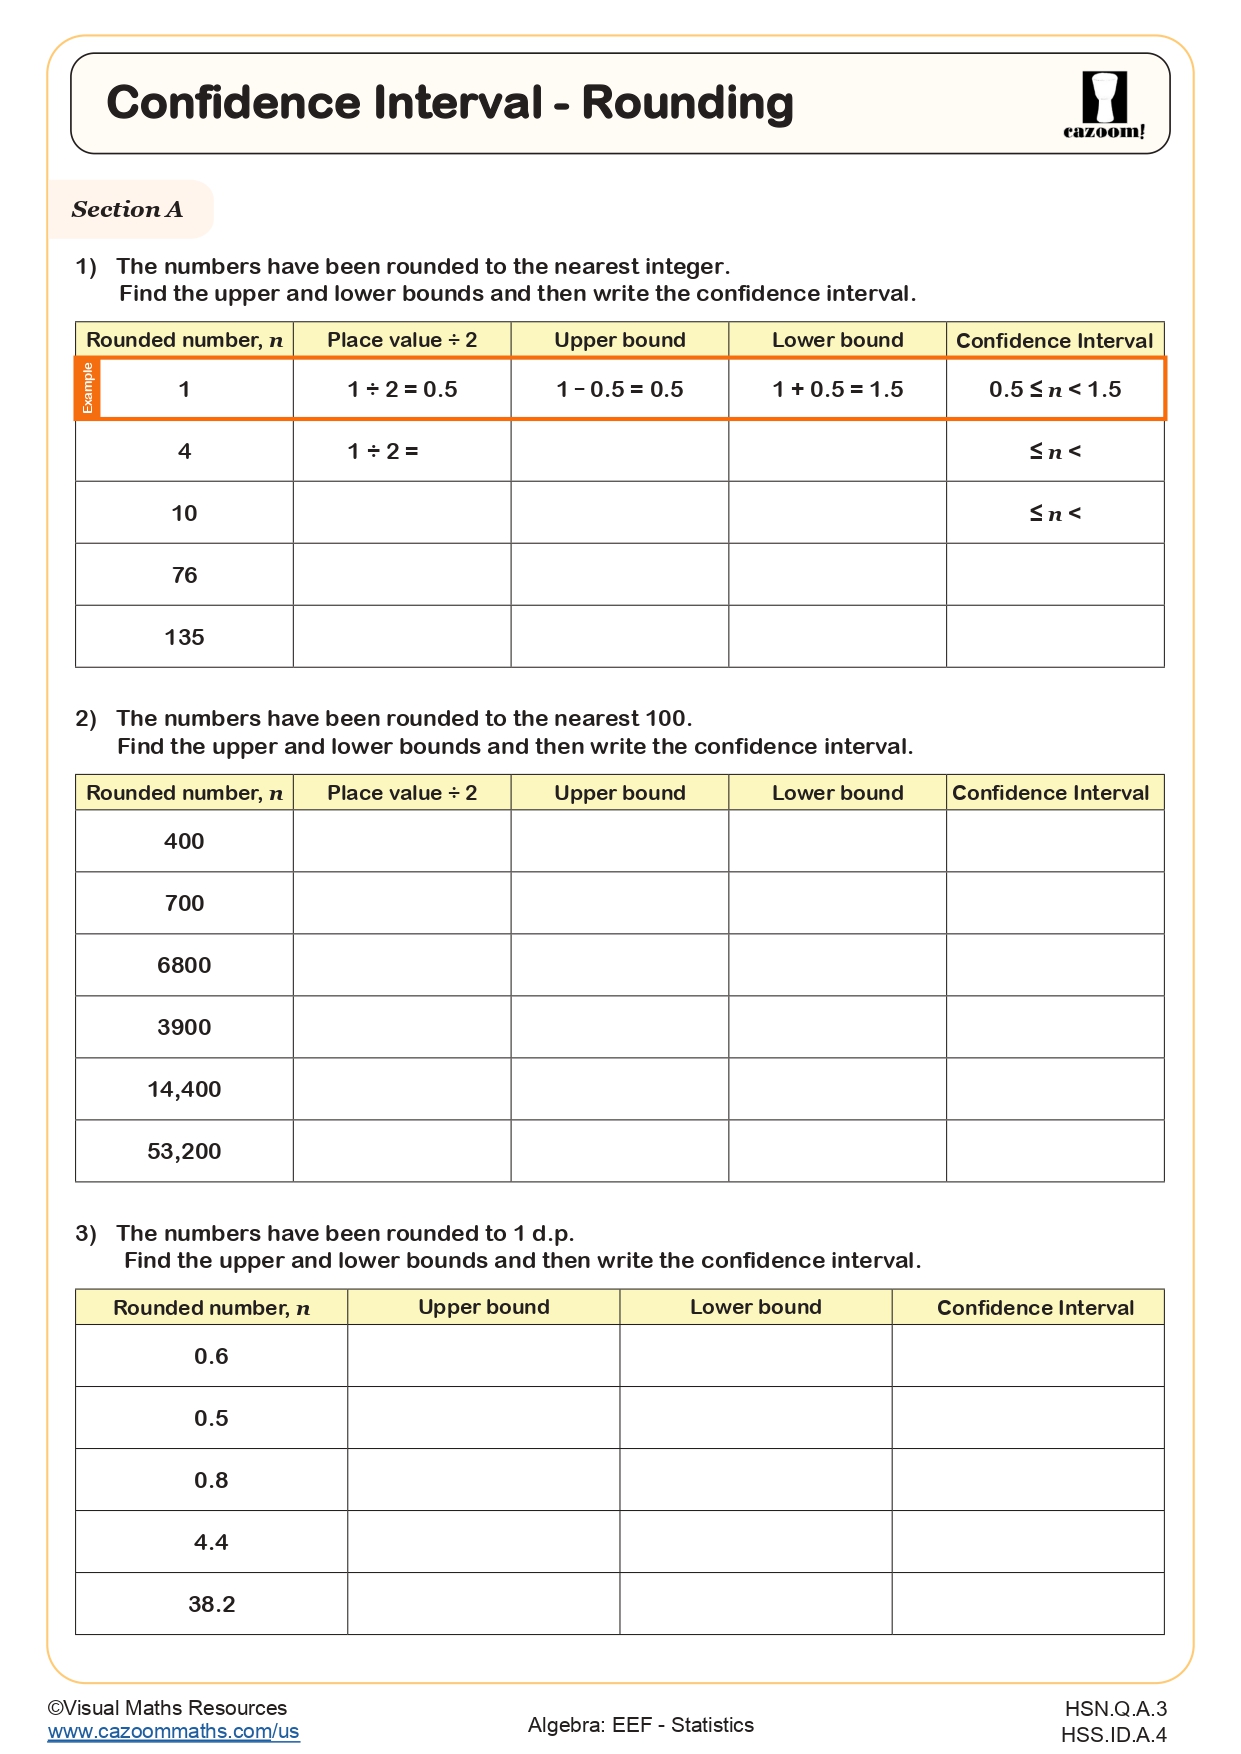
Confidence Interval - Rounding
Grades: Algebra II, IM 2
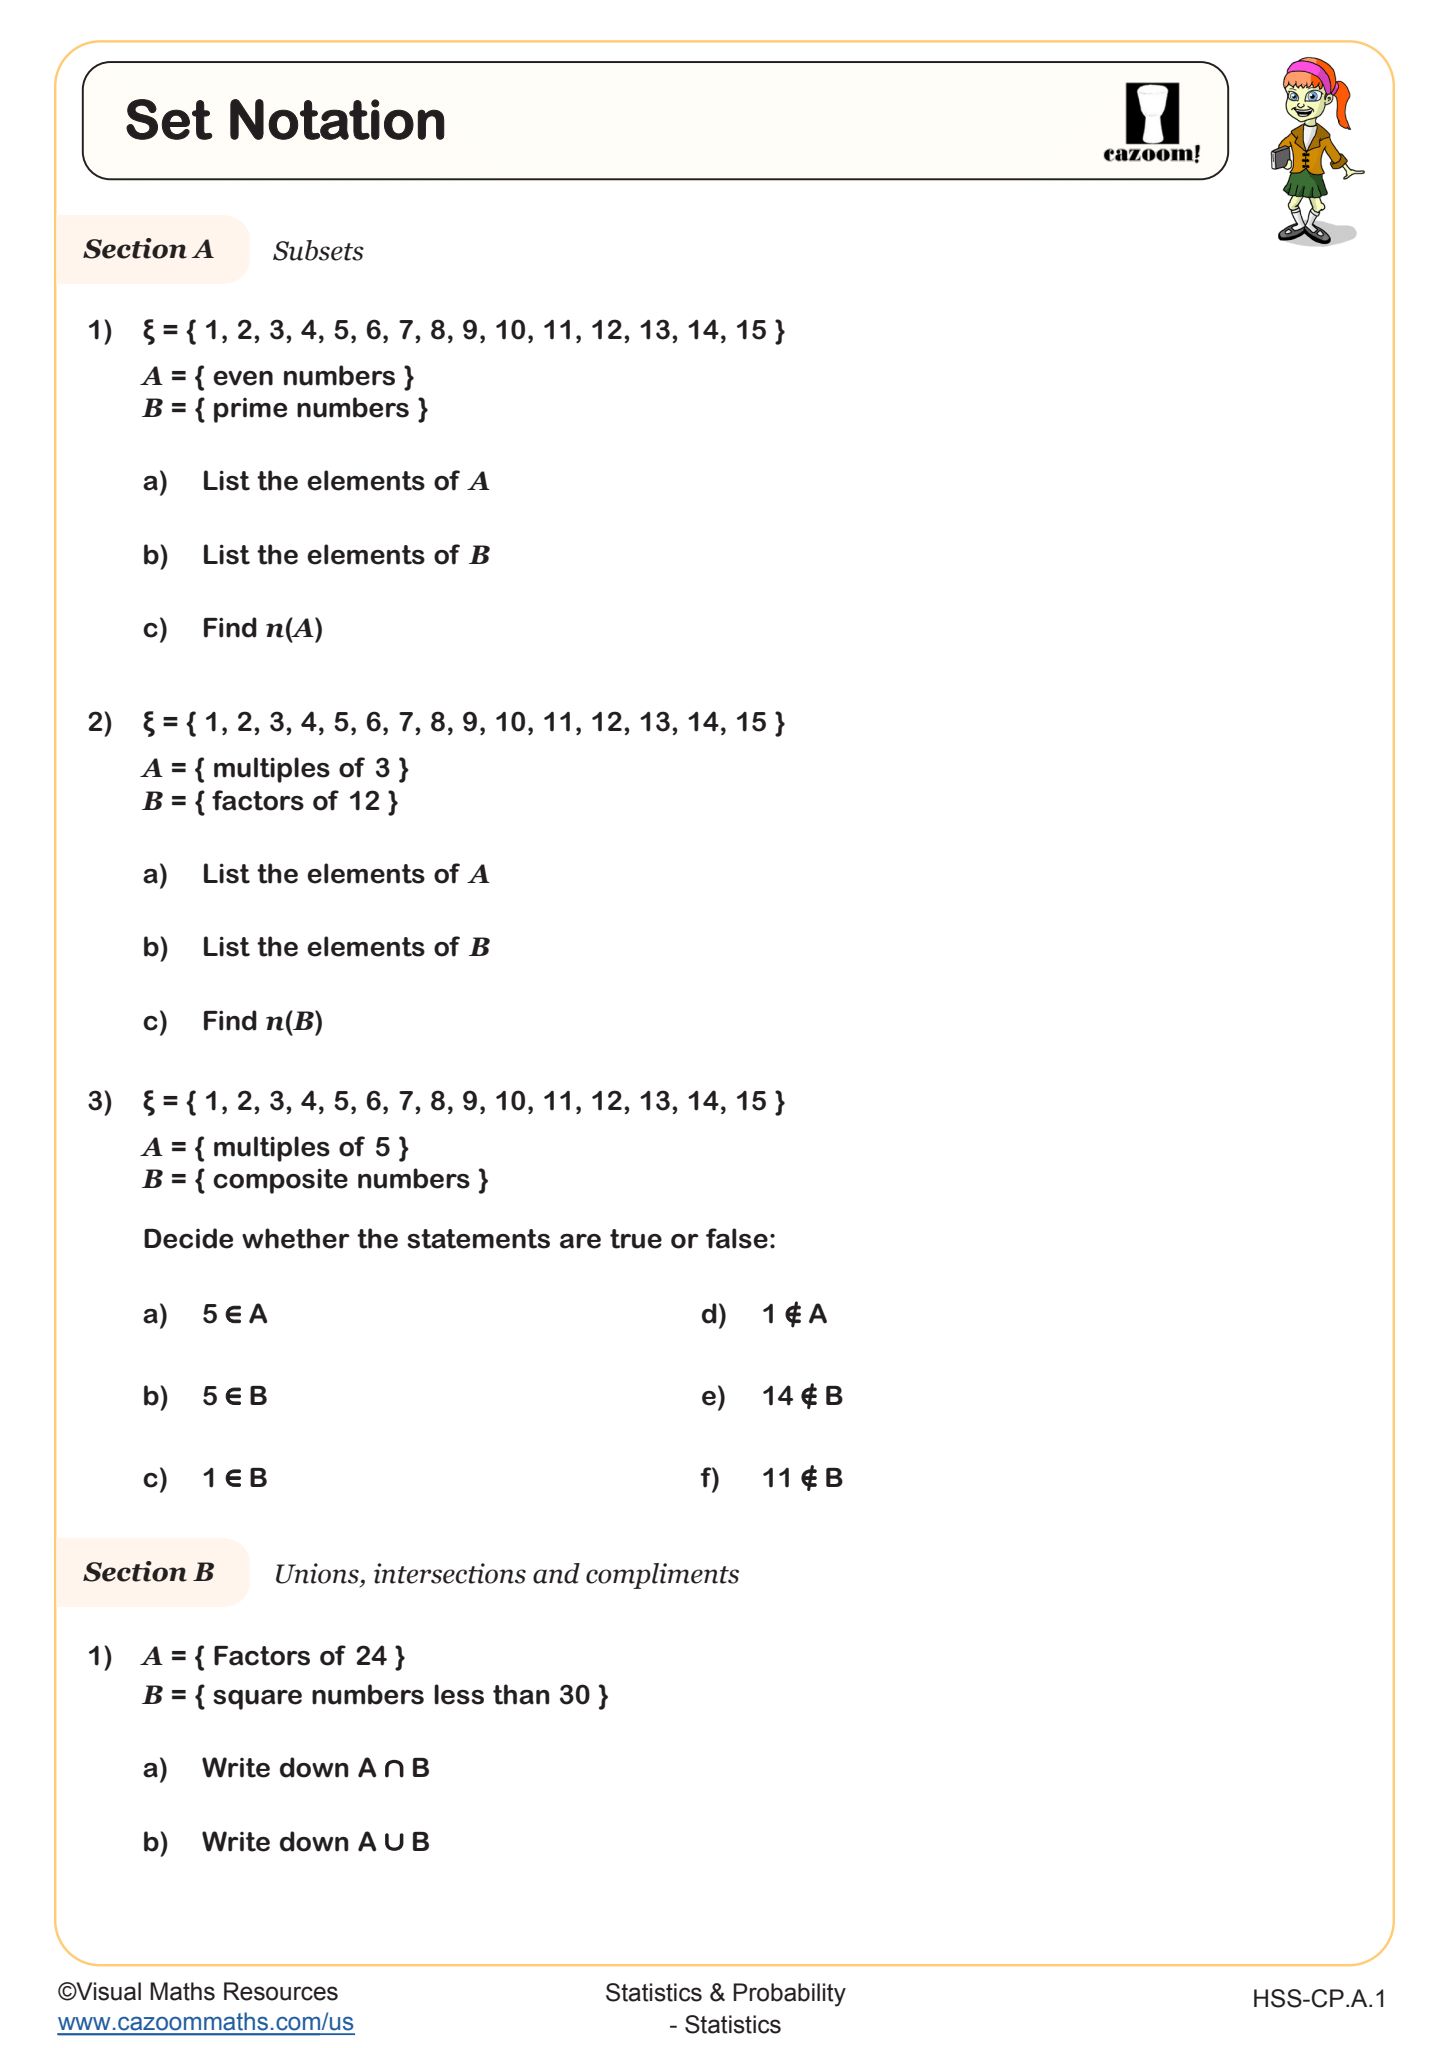
Set Notation
Grades: Algebra II, IM 2
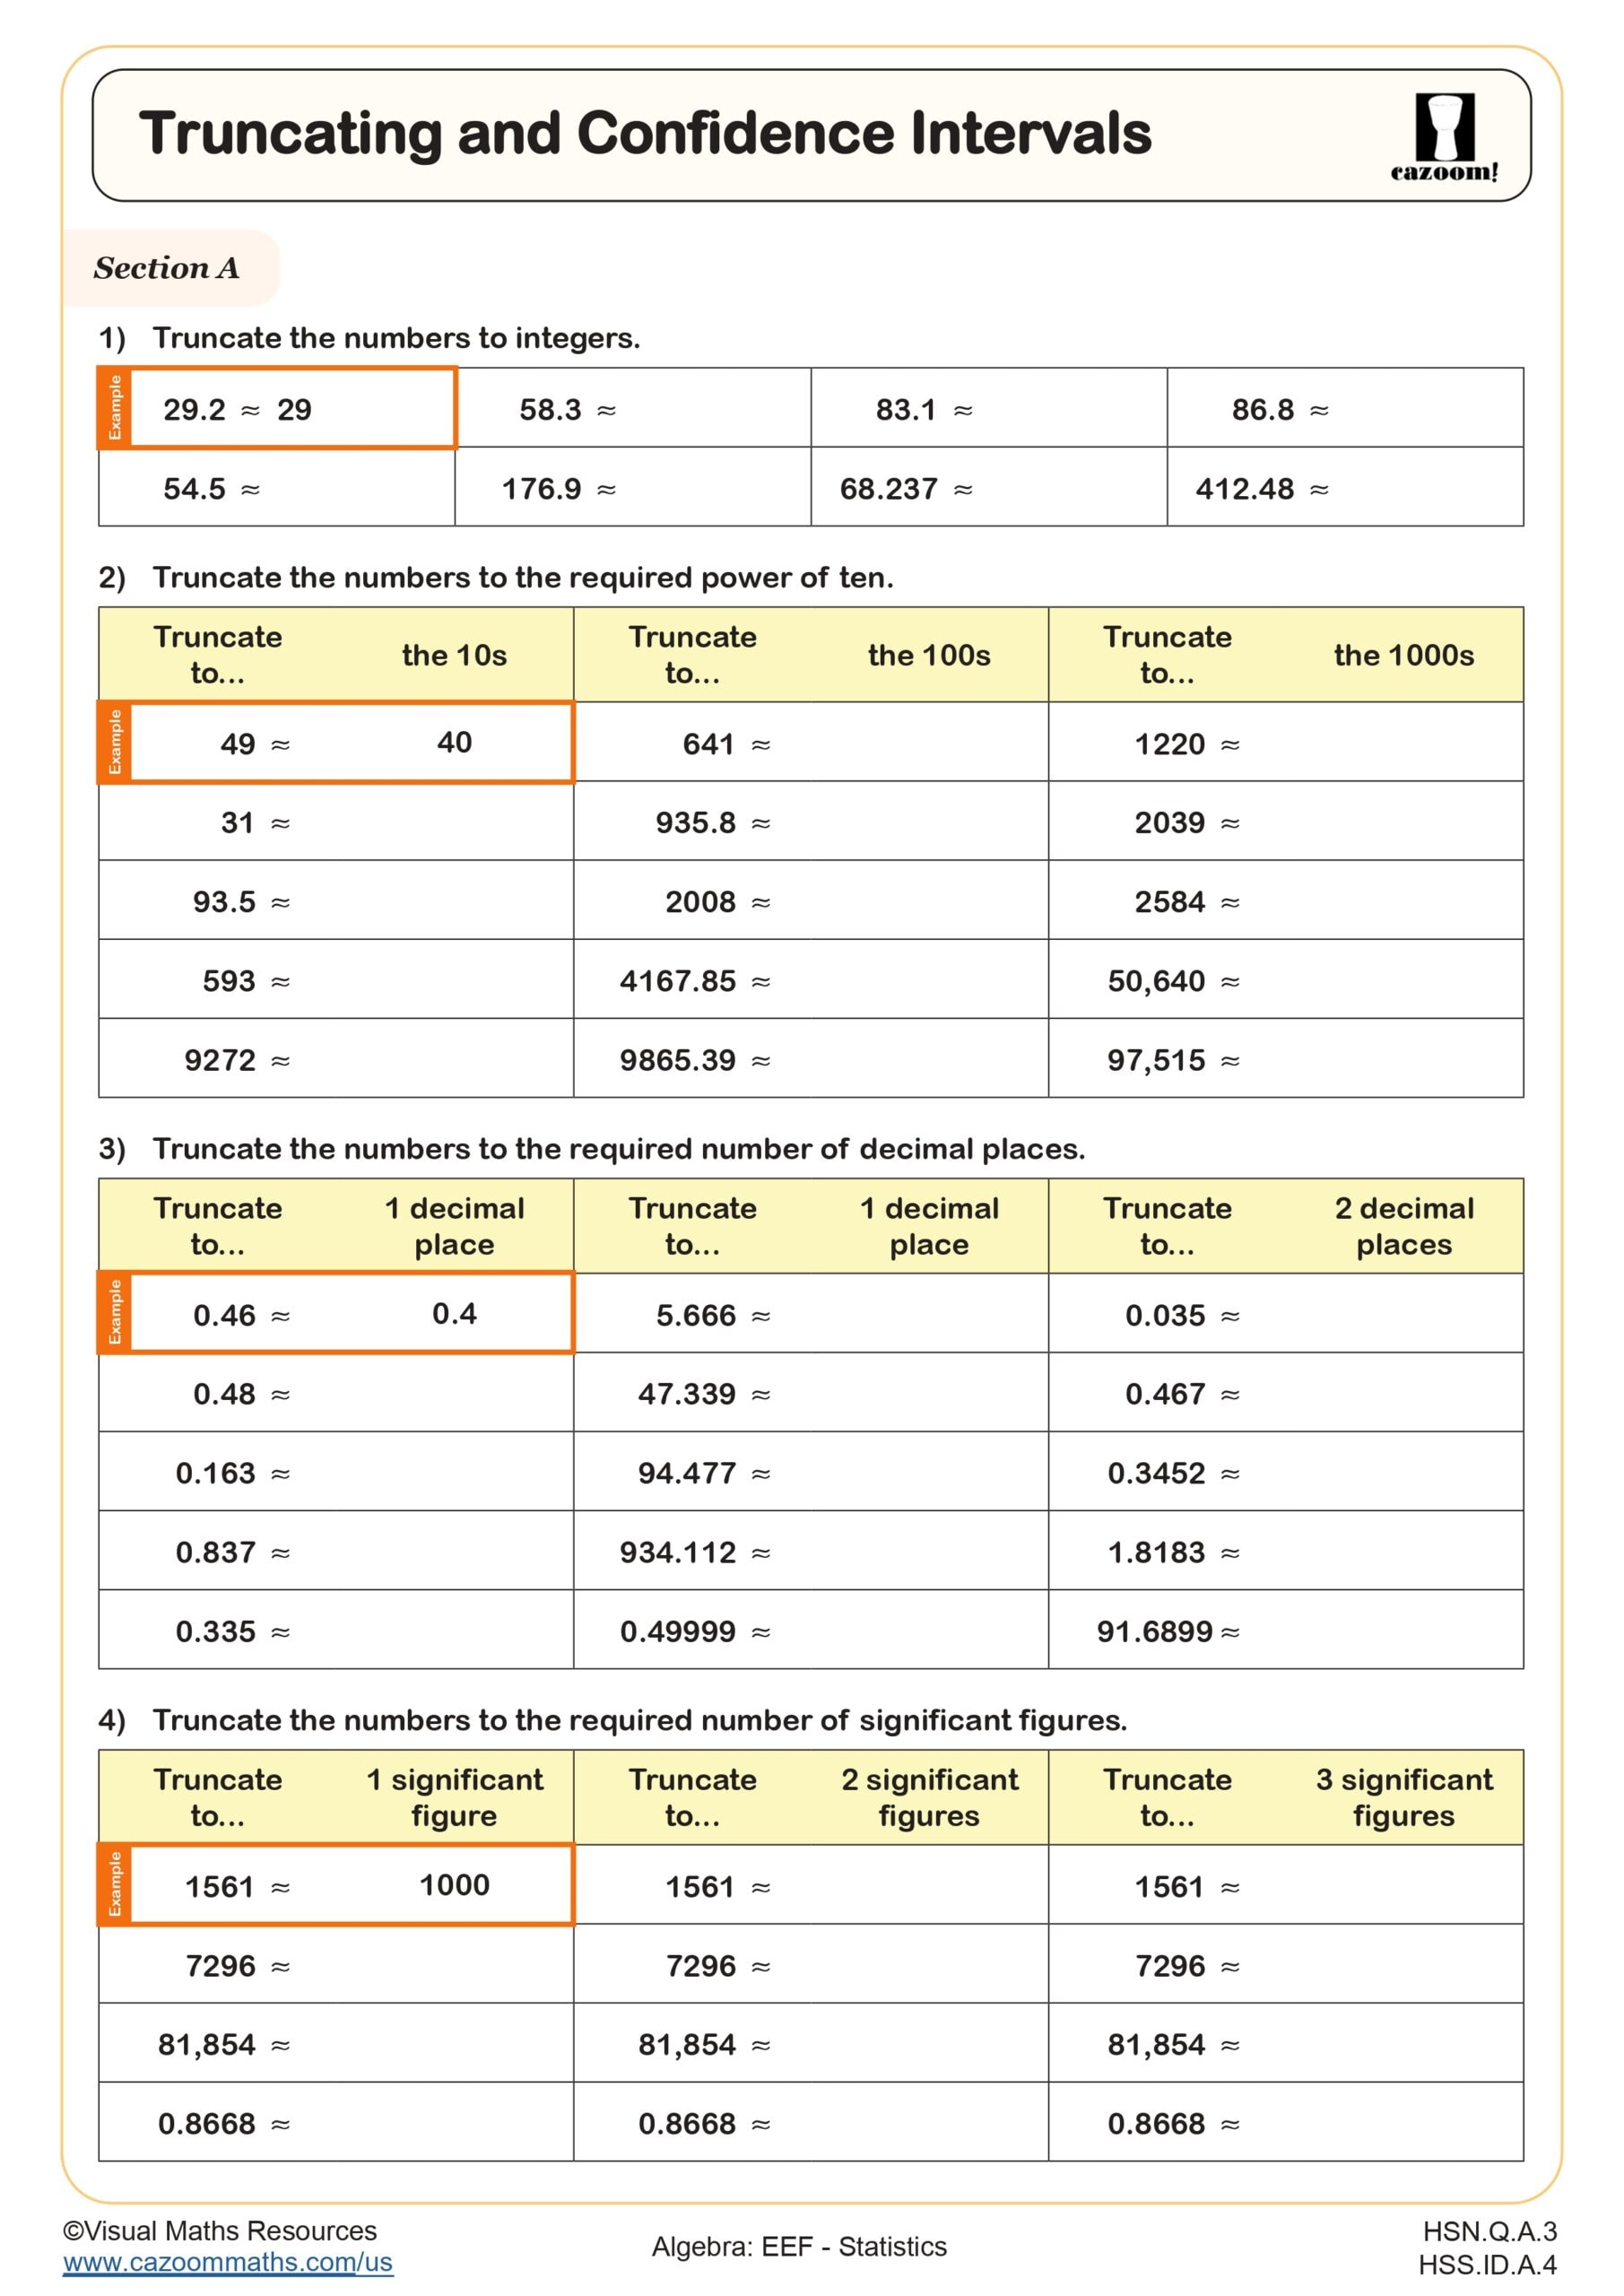
Truncating and Confidence Interval
Grades: Algebra II, IM 2
All worksheets are created by the team of experienced teachers at Cazoom Math.
What topics do statistics worksheets typically cover?
Statistics worksheets encompass fundamental data analysis concepts including measures of central tendency (mean, median, mode), data displays (bar graphs, histograms, box plots), probability calculations, and statistical interpretation. These align with Common Core State Standards for mathematics, particularly in grades 6-12 where statistical thinking becomes increasingly sophisticated.
Teachers frequently notice students confuse mean and median calculations, especially with outliers present in data sets. Many students also struggle with reading scaled graphs accurately, often misinterpreting intervals or overlooking axis labels. Grade 7 statistics worksheets pdf with answers particularly focus on these foundational misunderstandings while building toward more complex statistical reasoning required in later grades.
How do statistics concepts progress across different grade levels?
Elementary grades introduce basic data collection and simple graphing, while middle school expands to measures of central tendency and more complex data displays. High school statistics worksheets advance to probability distributions, correlation, and statistical inference concepts that prepare students for AP Statistics or college-level coursework.
The progression typically moves from concrete data manipulation in grades 3-5 to abstract statistical reasoning by grades 9-12. Teachers observe that students who master data interpretation skills in middle grades show stronger performance in advanced mathematics courses. The transition from descriptive statistics to inferential statistics around grade 9 often presents the steepest learning curve for most students.
Why do students find probability concepts particularly challenging?
Probability combines mathematical calculation with logical reasoning, requiring students to think beyond computational procedures to understand likelihood and chance. Many students apply arithmetic operations incorrectly to probability situations, such as adding probabilities when they should multiply for independent events.
Classroom observations reveal that students often confuse theoretical probability with experimental results, expecting perfect matches between calculated probabilities and actual outcomes. Statistics worksheets with answers help teachers identify these misconceptions early by providing immediate feedback on probability calculations. Visual models and real-world contexts, such as weather forecasting or sports statistics, help students develop stronger intuitive understanding of probabilistic thinking.
How can teachers maximize the effectiveness of statistics worksheets with answer key resources?
Teachers achieve better results when they use statistics worksheets with answer key materials as diagnostic tools rather than just practice exercises. Reviewing common incorrect responses helps identify specific conceptual gaps that need targeted instruction before moving to more complex topics.
Effective implementation involves having students explain their reasoning for statistical conclusions, not just provide numerical answers. Teachers report that students benefit from comparing their work against provided solutions while discussing alternative problem-solving approaches. Using statistics worksheets with answers pdf format allows for easy distribution and collection, while answer keys enable peer checking activities that build mathematical communication skills alongside statistical understanding.
What Should Students Know Before Learning Statistics?
Before starting with statistics worksheets, students should:
• Be confident in basic operations (add, subtract, multiply, divide)
• Understand how to read and draw tables and charts
• Be able to organize data in simple groups
• Recognize number patterns and use logical reasoning
These basic math skills help students better understand how to work with data and solve real-world math problems.