Mean, Median, and Mode Worksheets
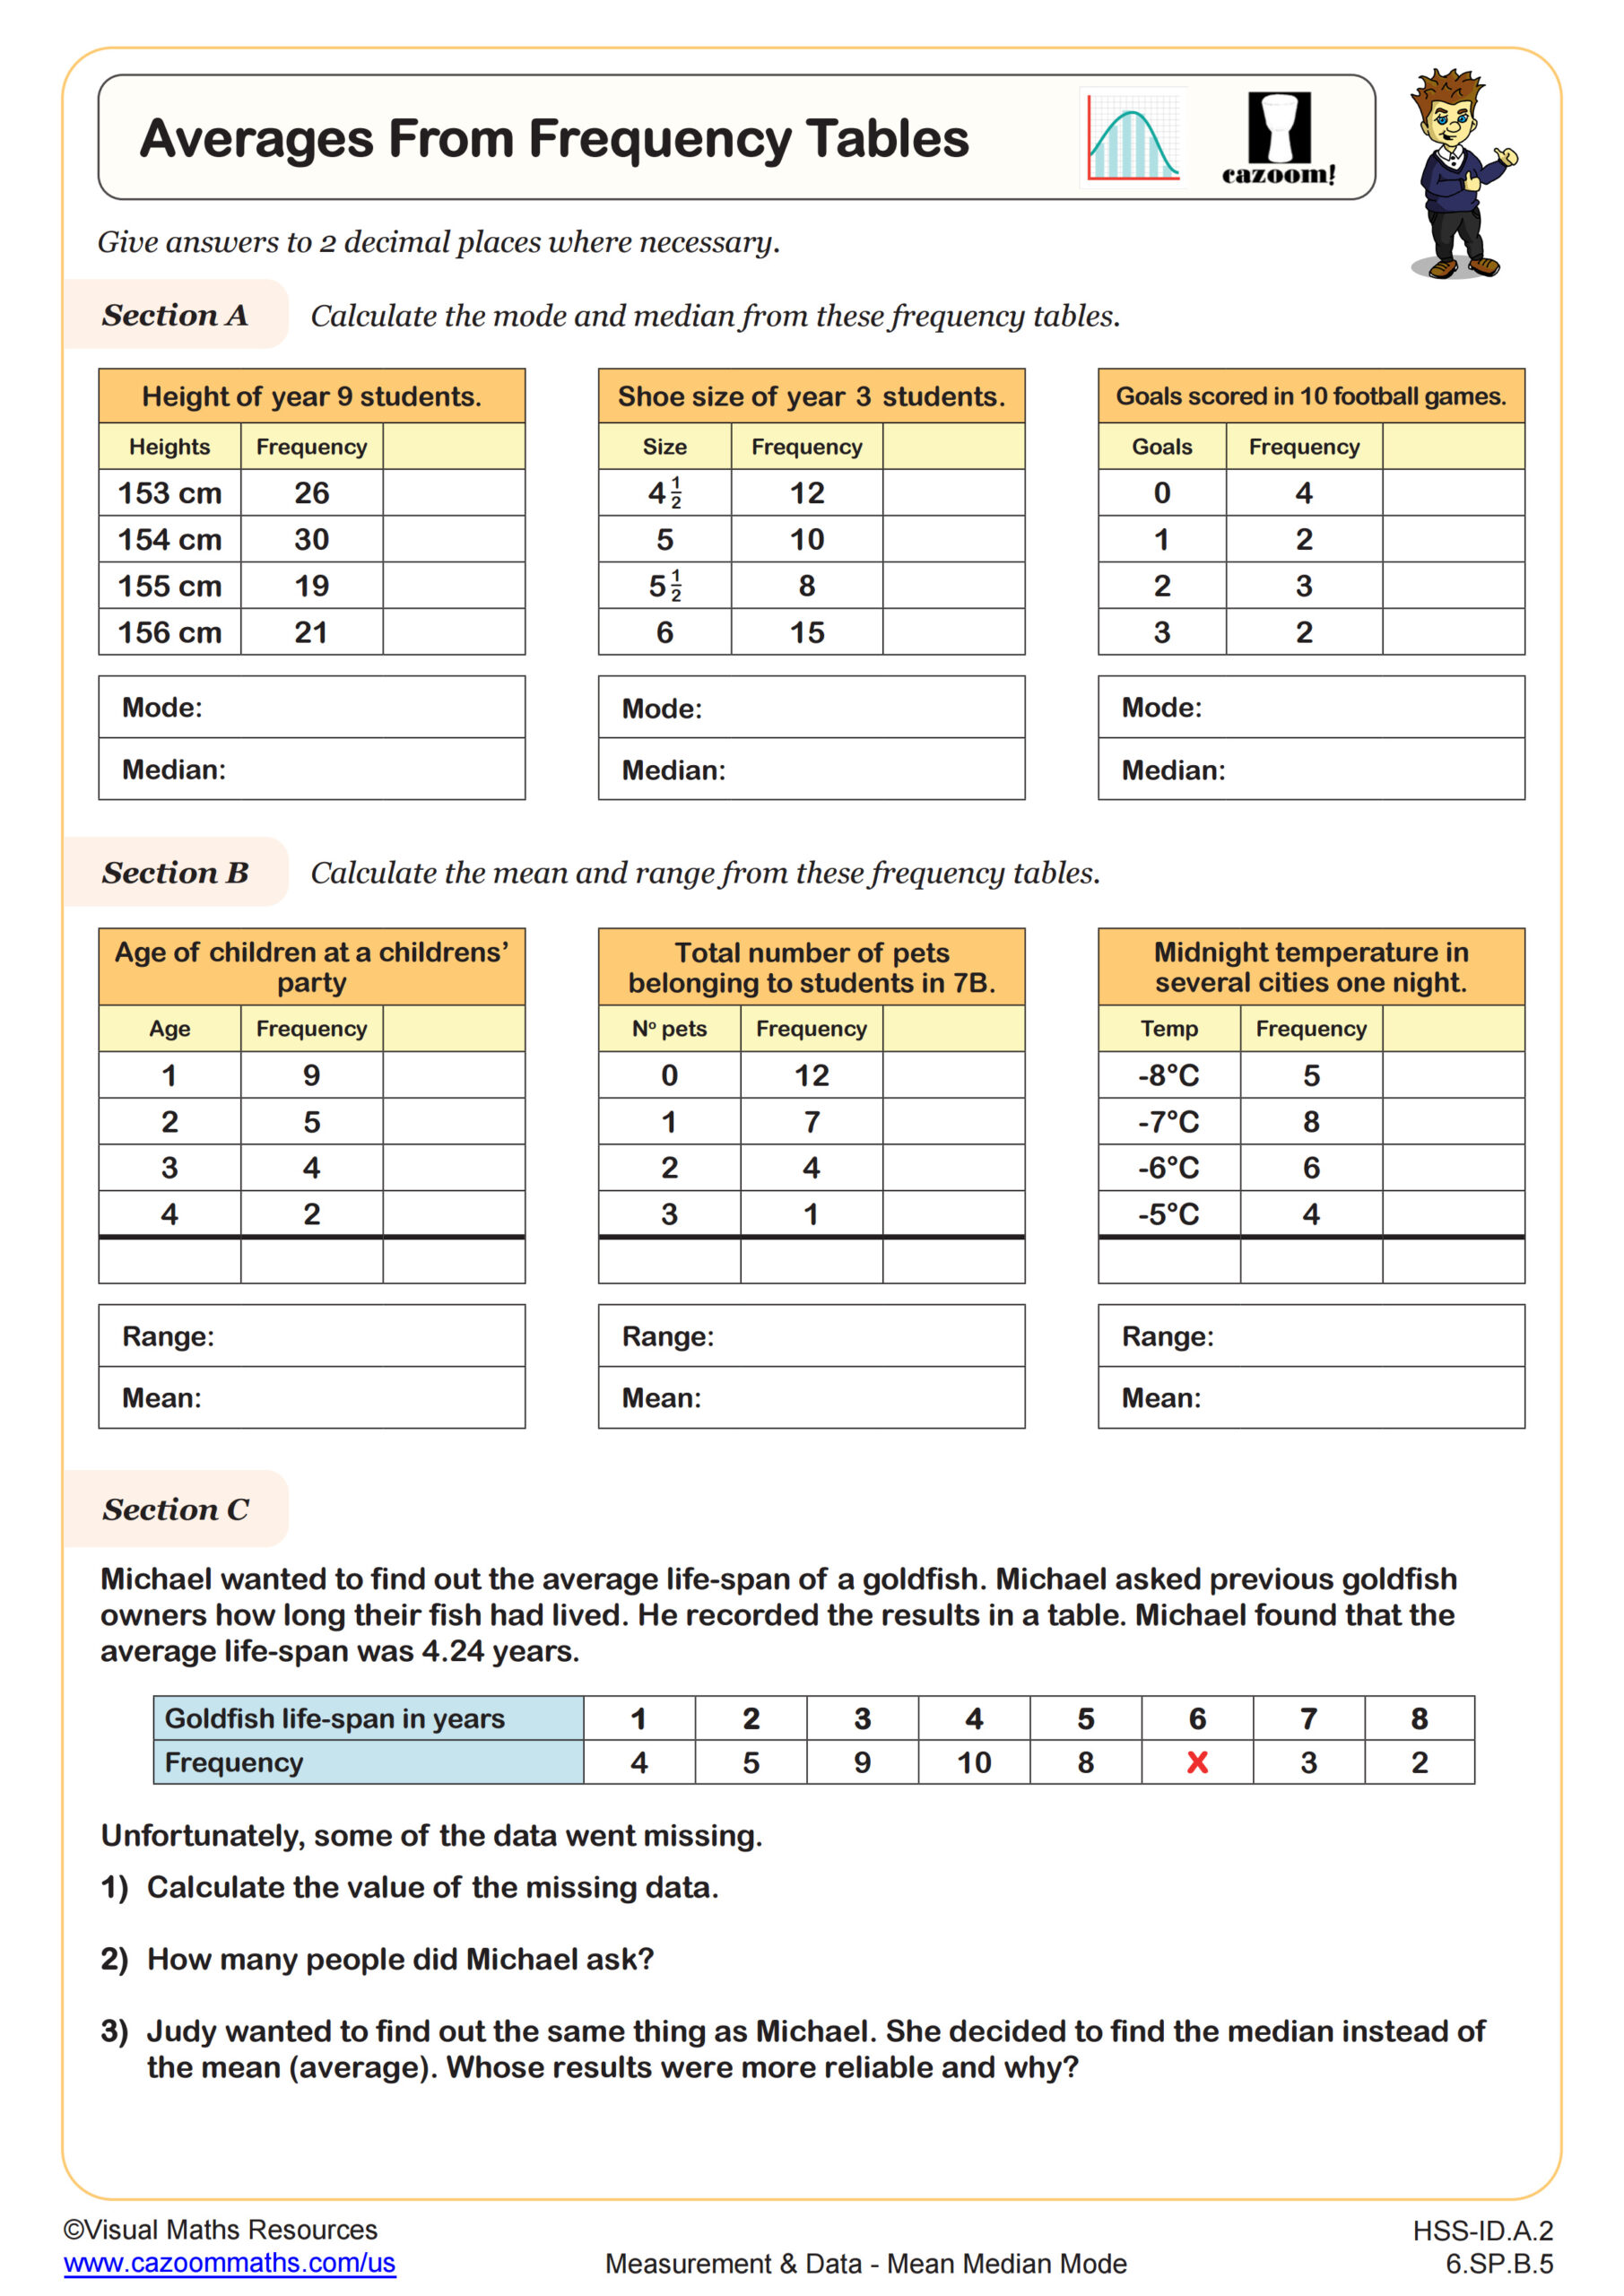
Averages from Frequency Tables
Grades: 6th Grade, Algebra I
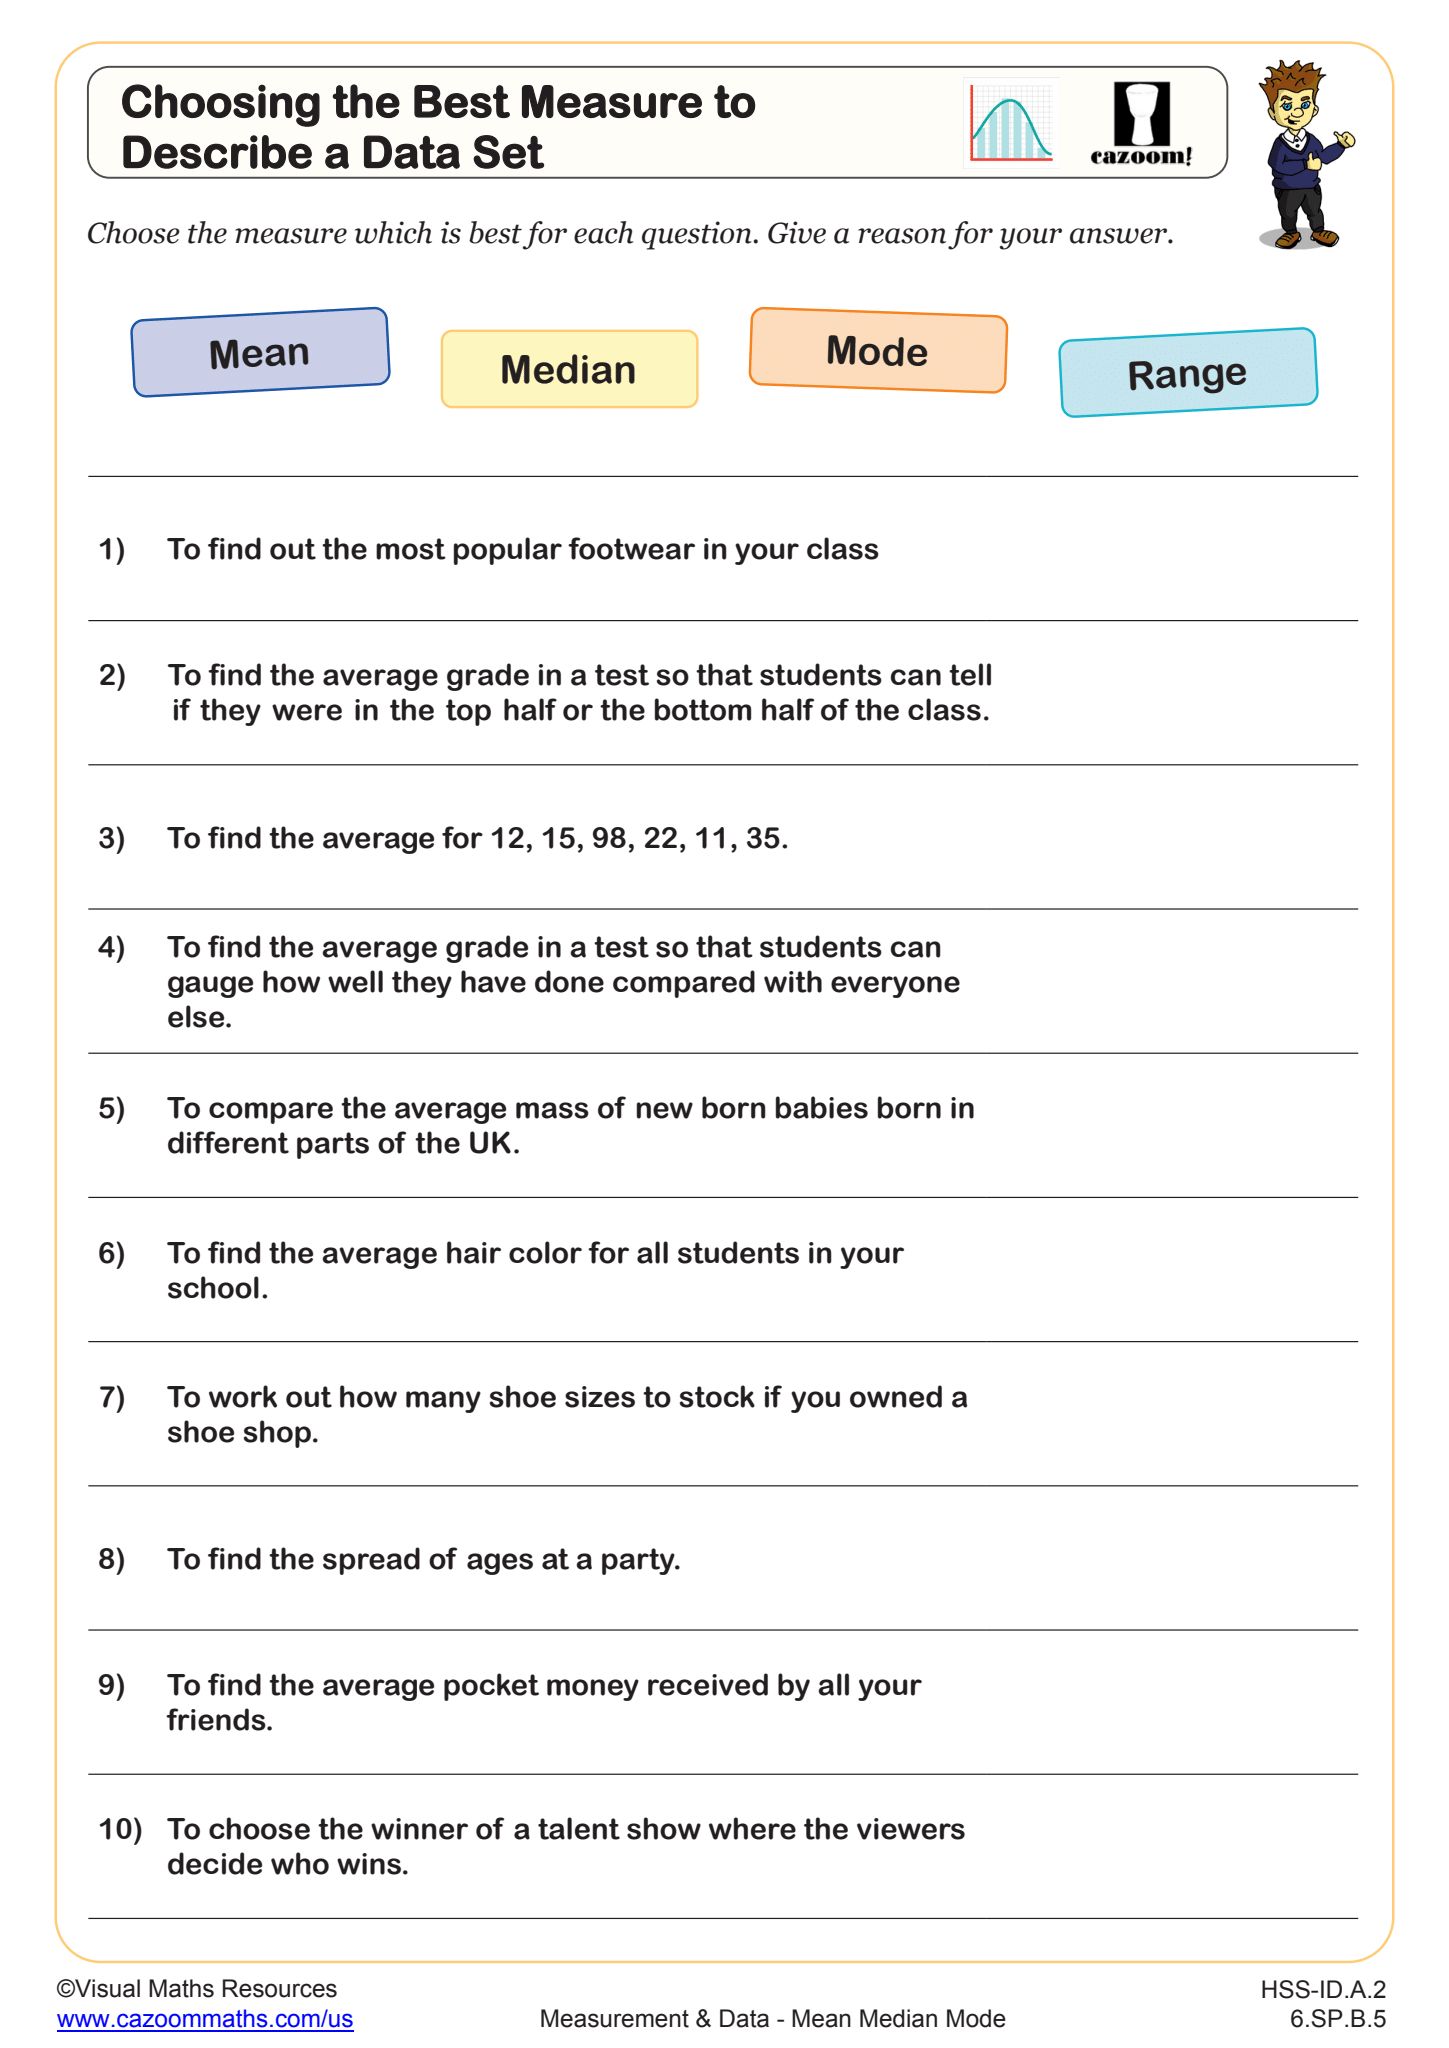
Choosing the Best Measure to Describe a Data Set
Grades: 6th Grade, Algebra I
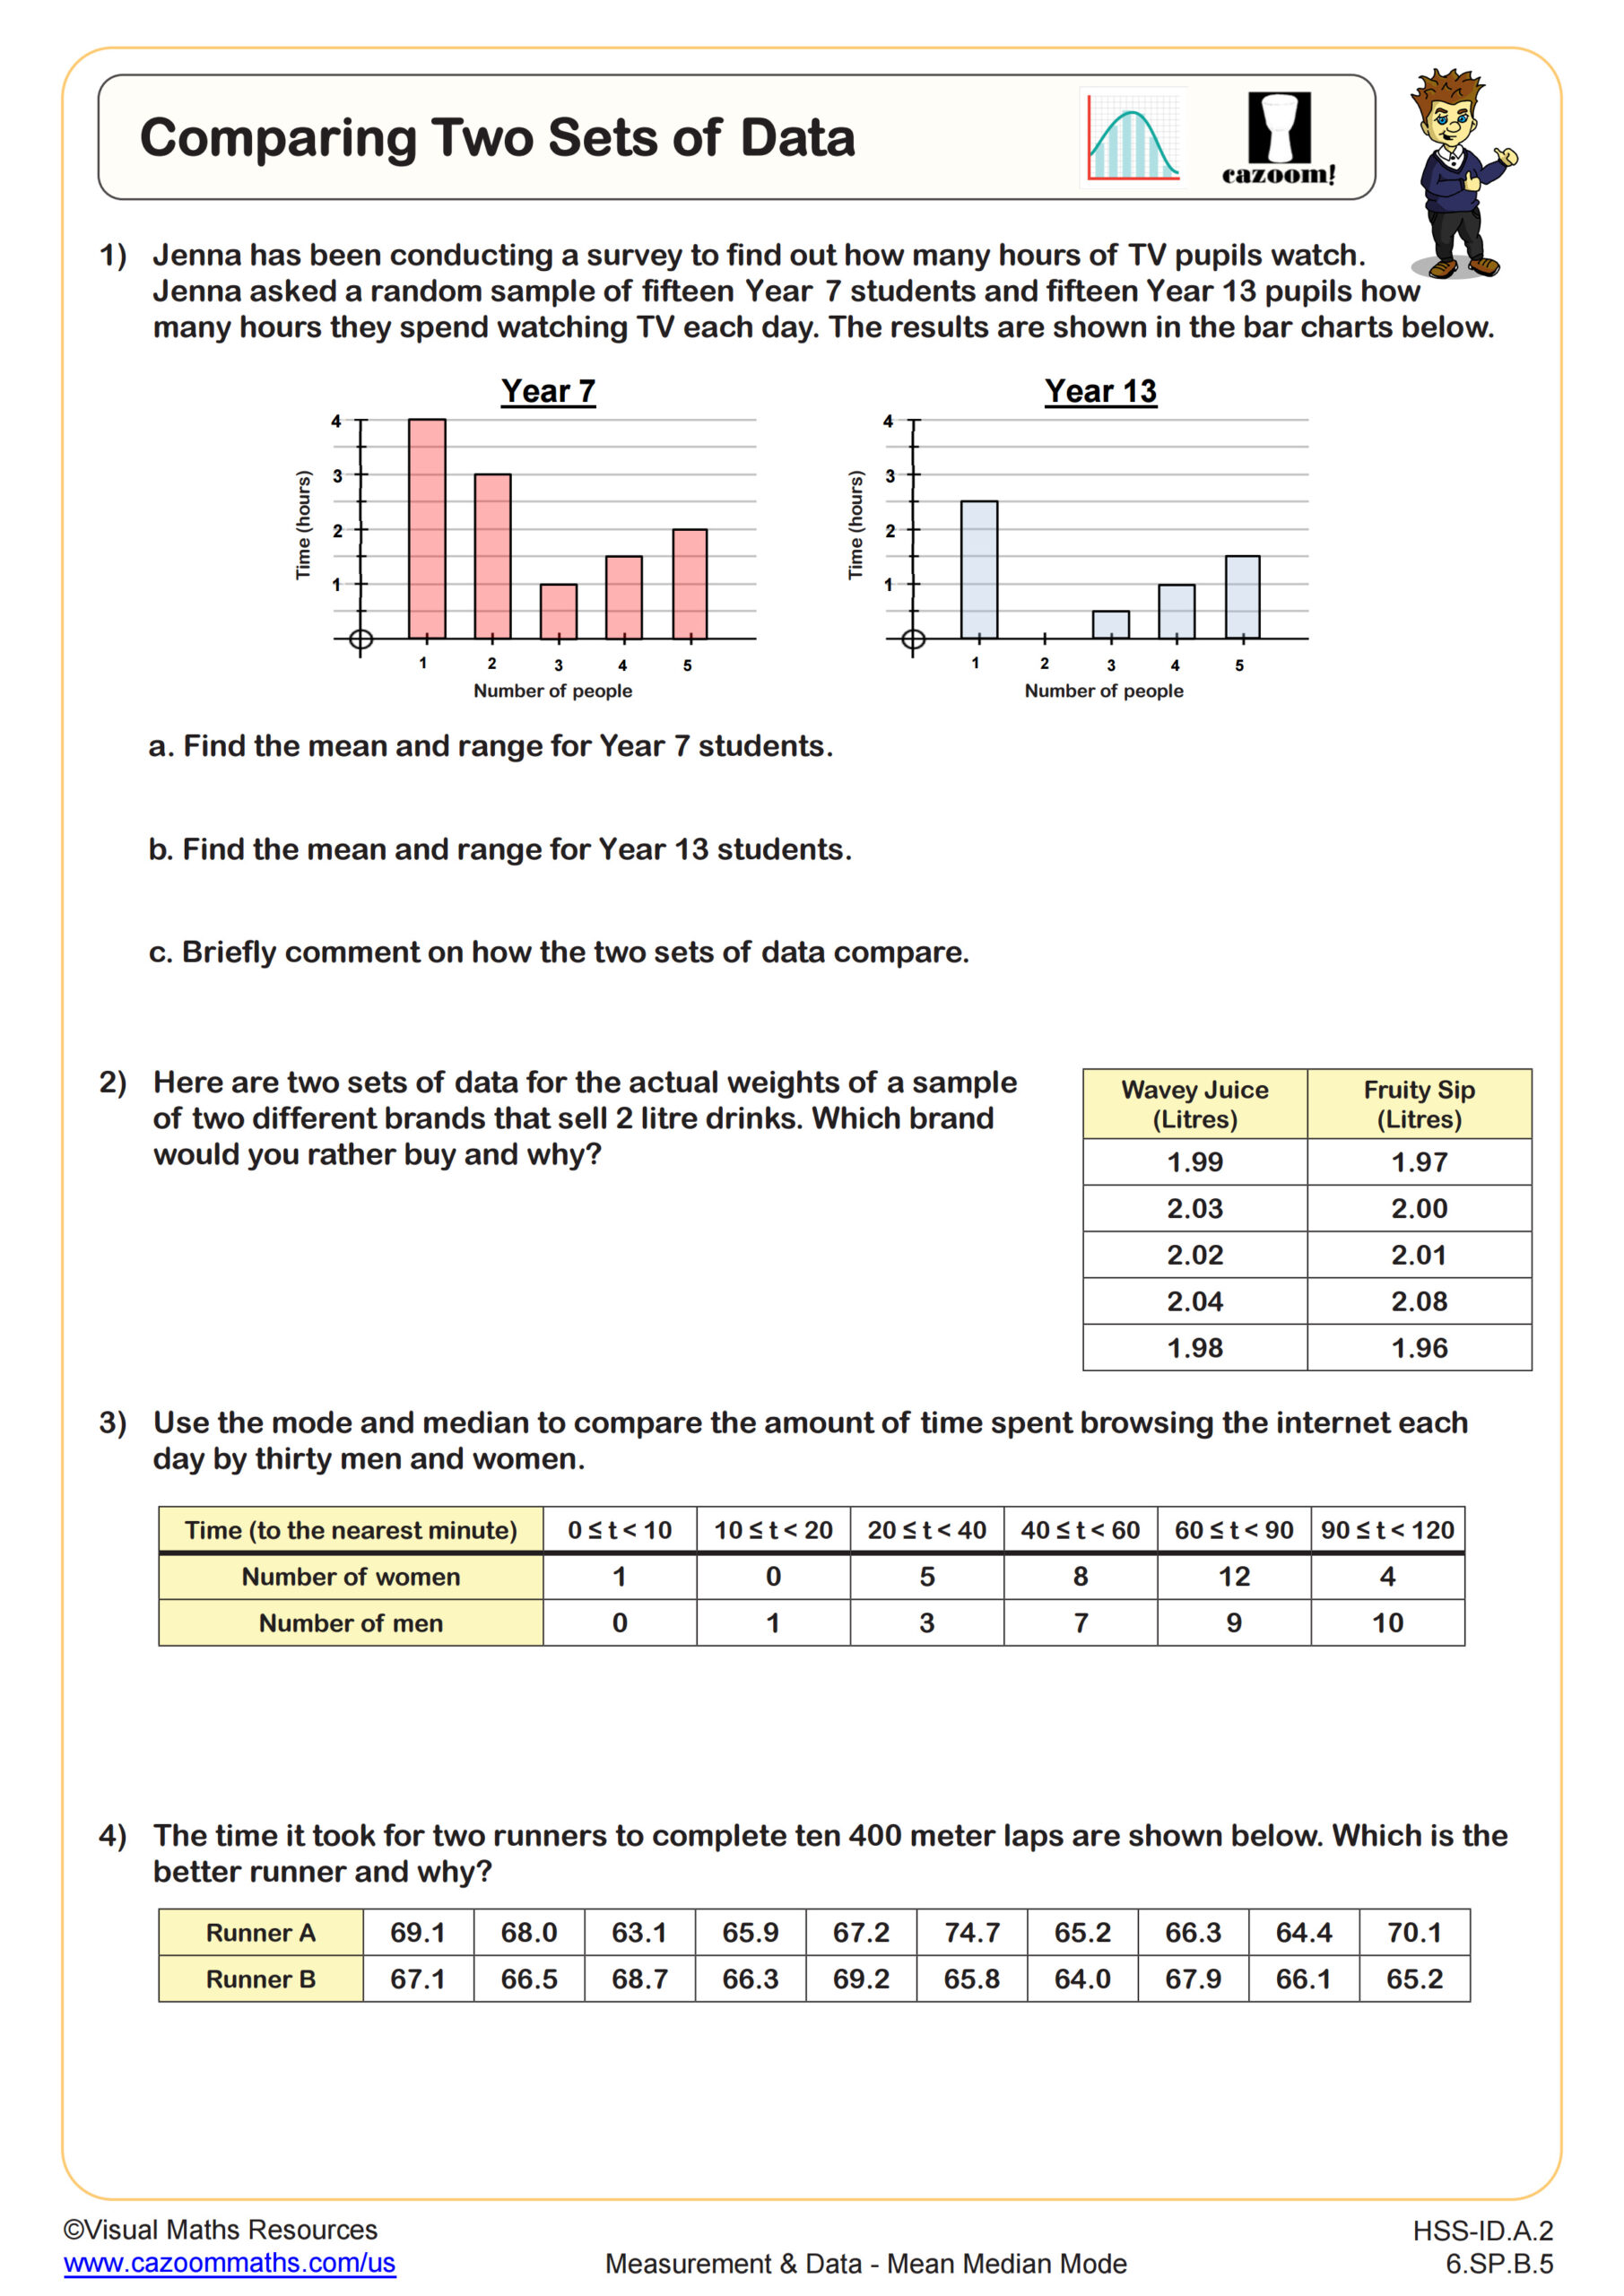
Comparing Two Sets of Data
Grades: 6th Grade, Algebra I
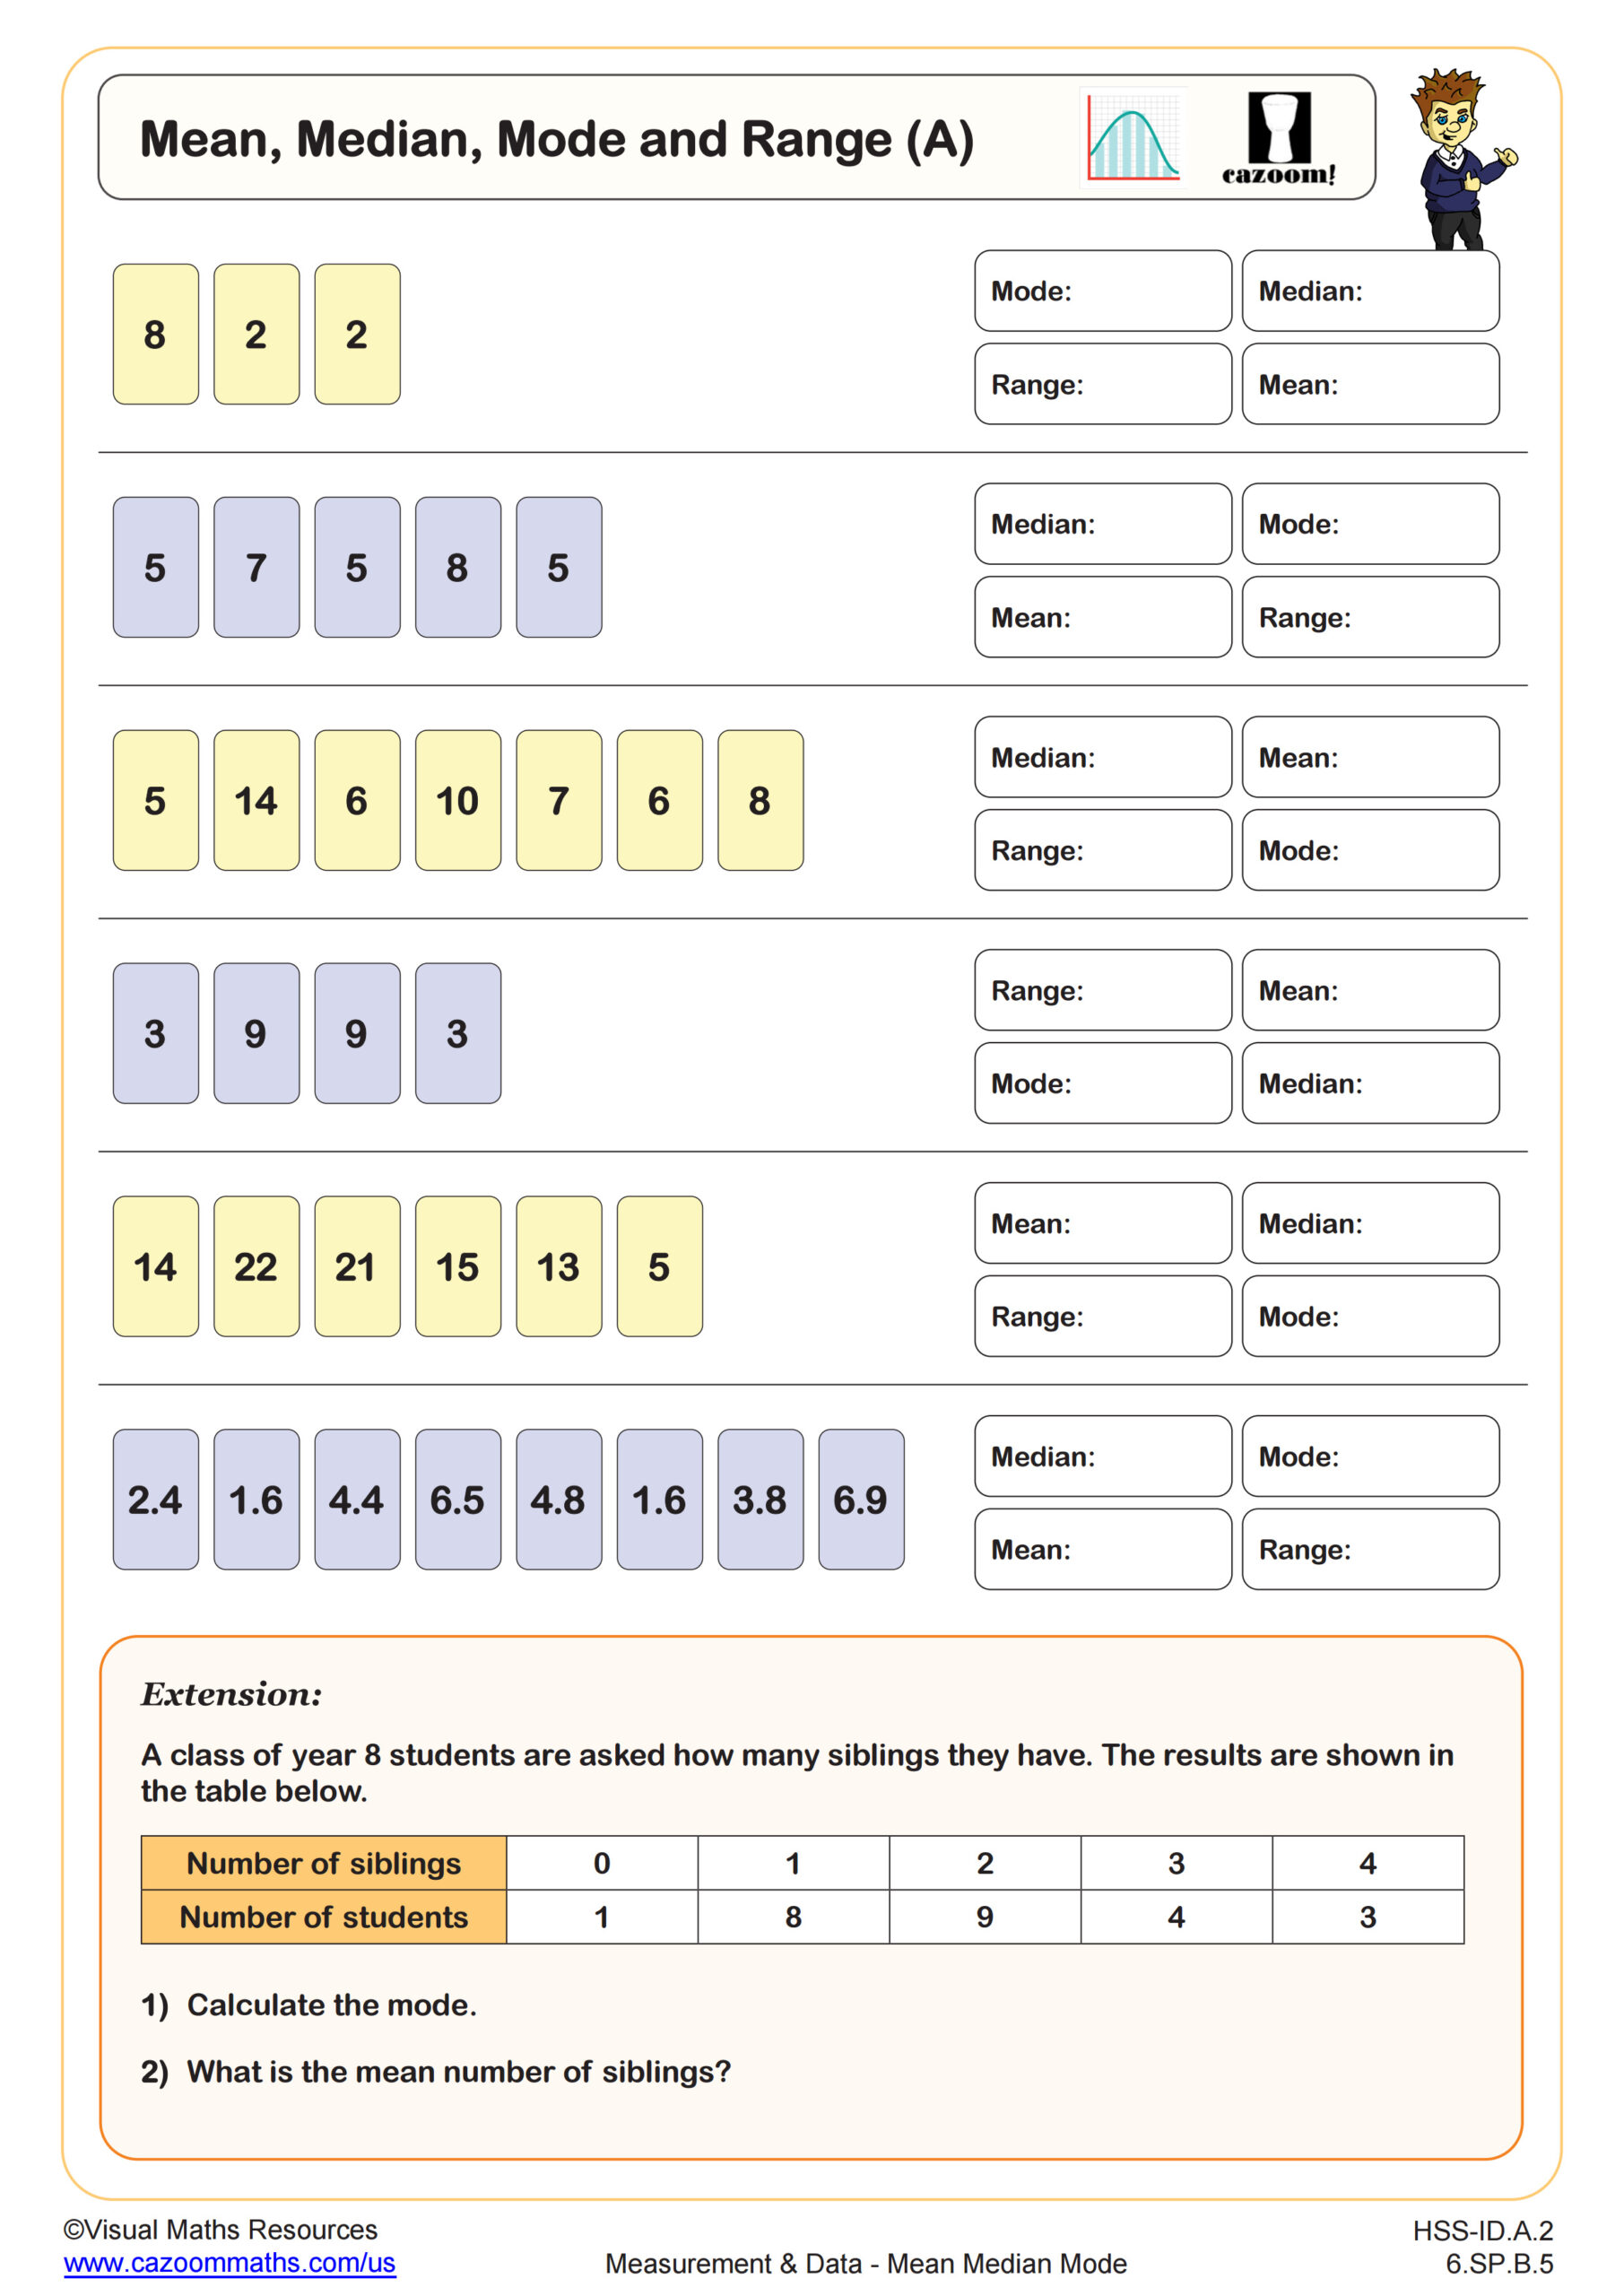
Mean, Median, Mode and Range (A)
Grades: 6th Grade, Algebra I
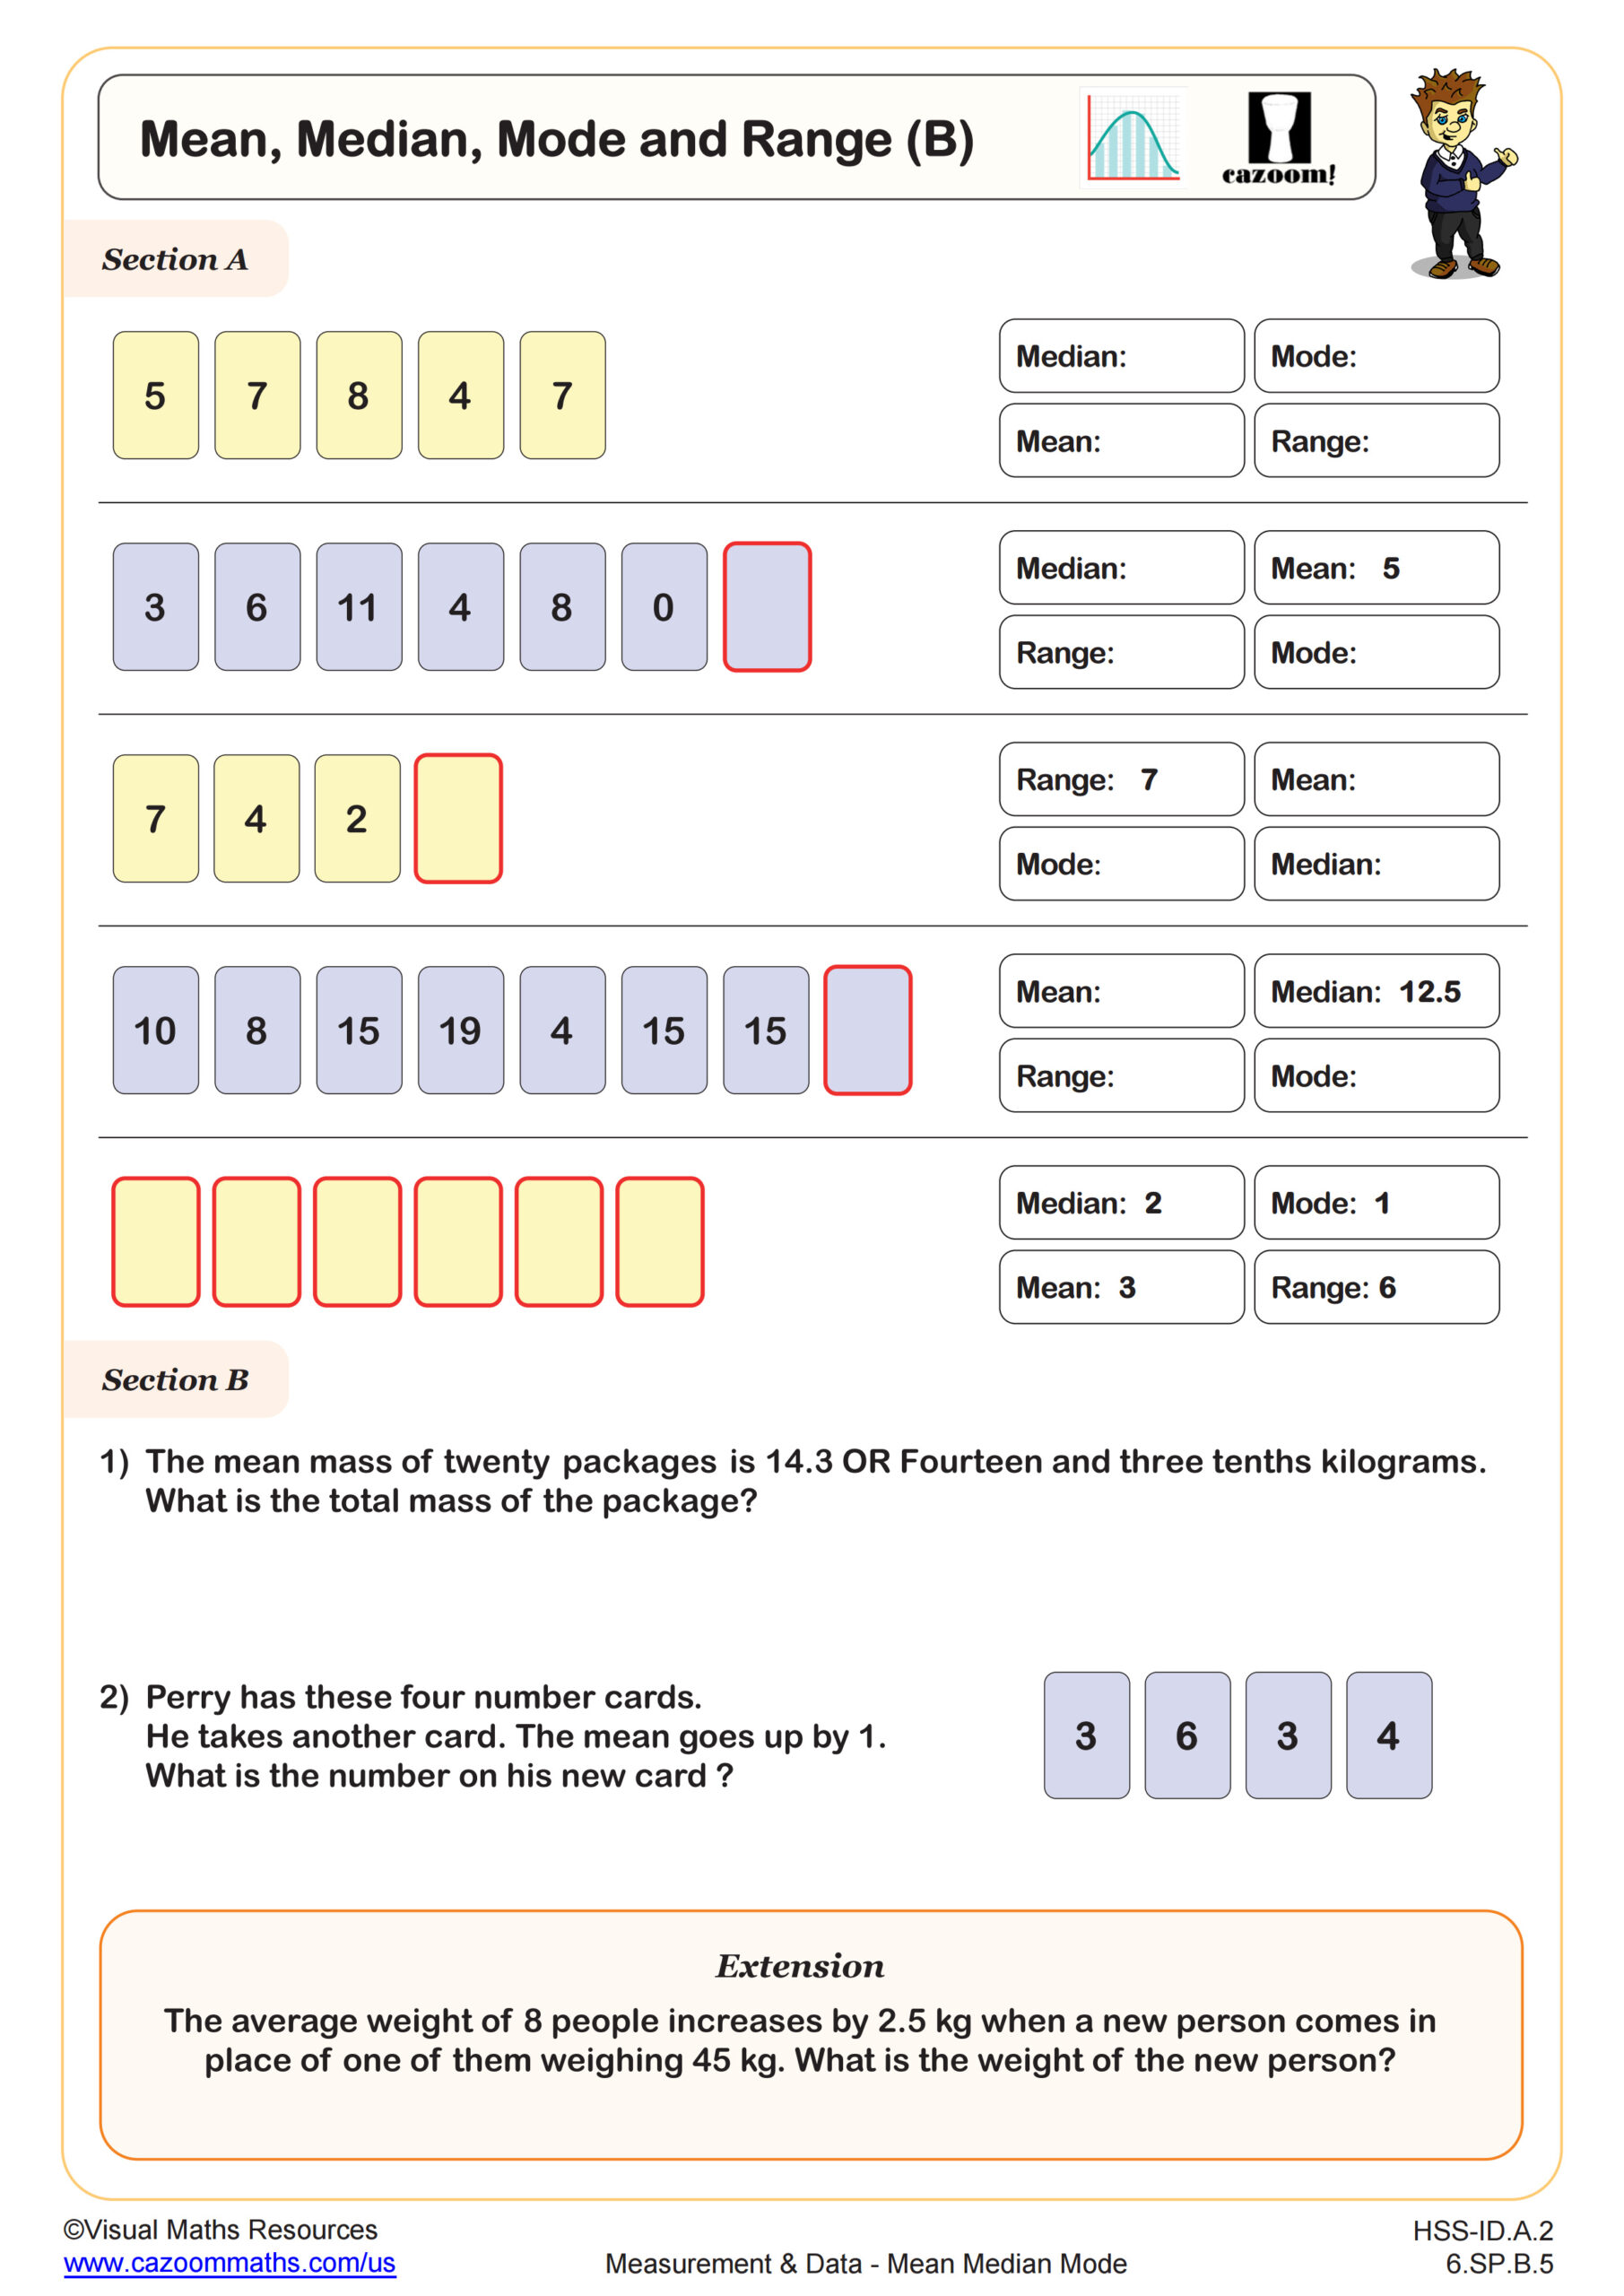
Mean, Median, Mode and Range (B)
Grades: 6th Grade, Algebra I
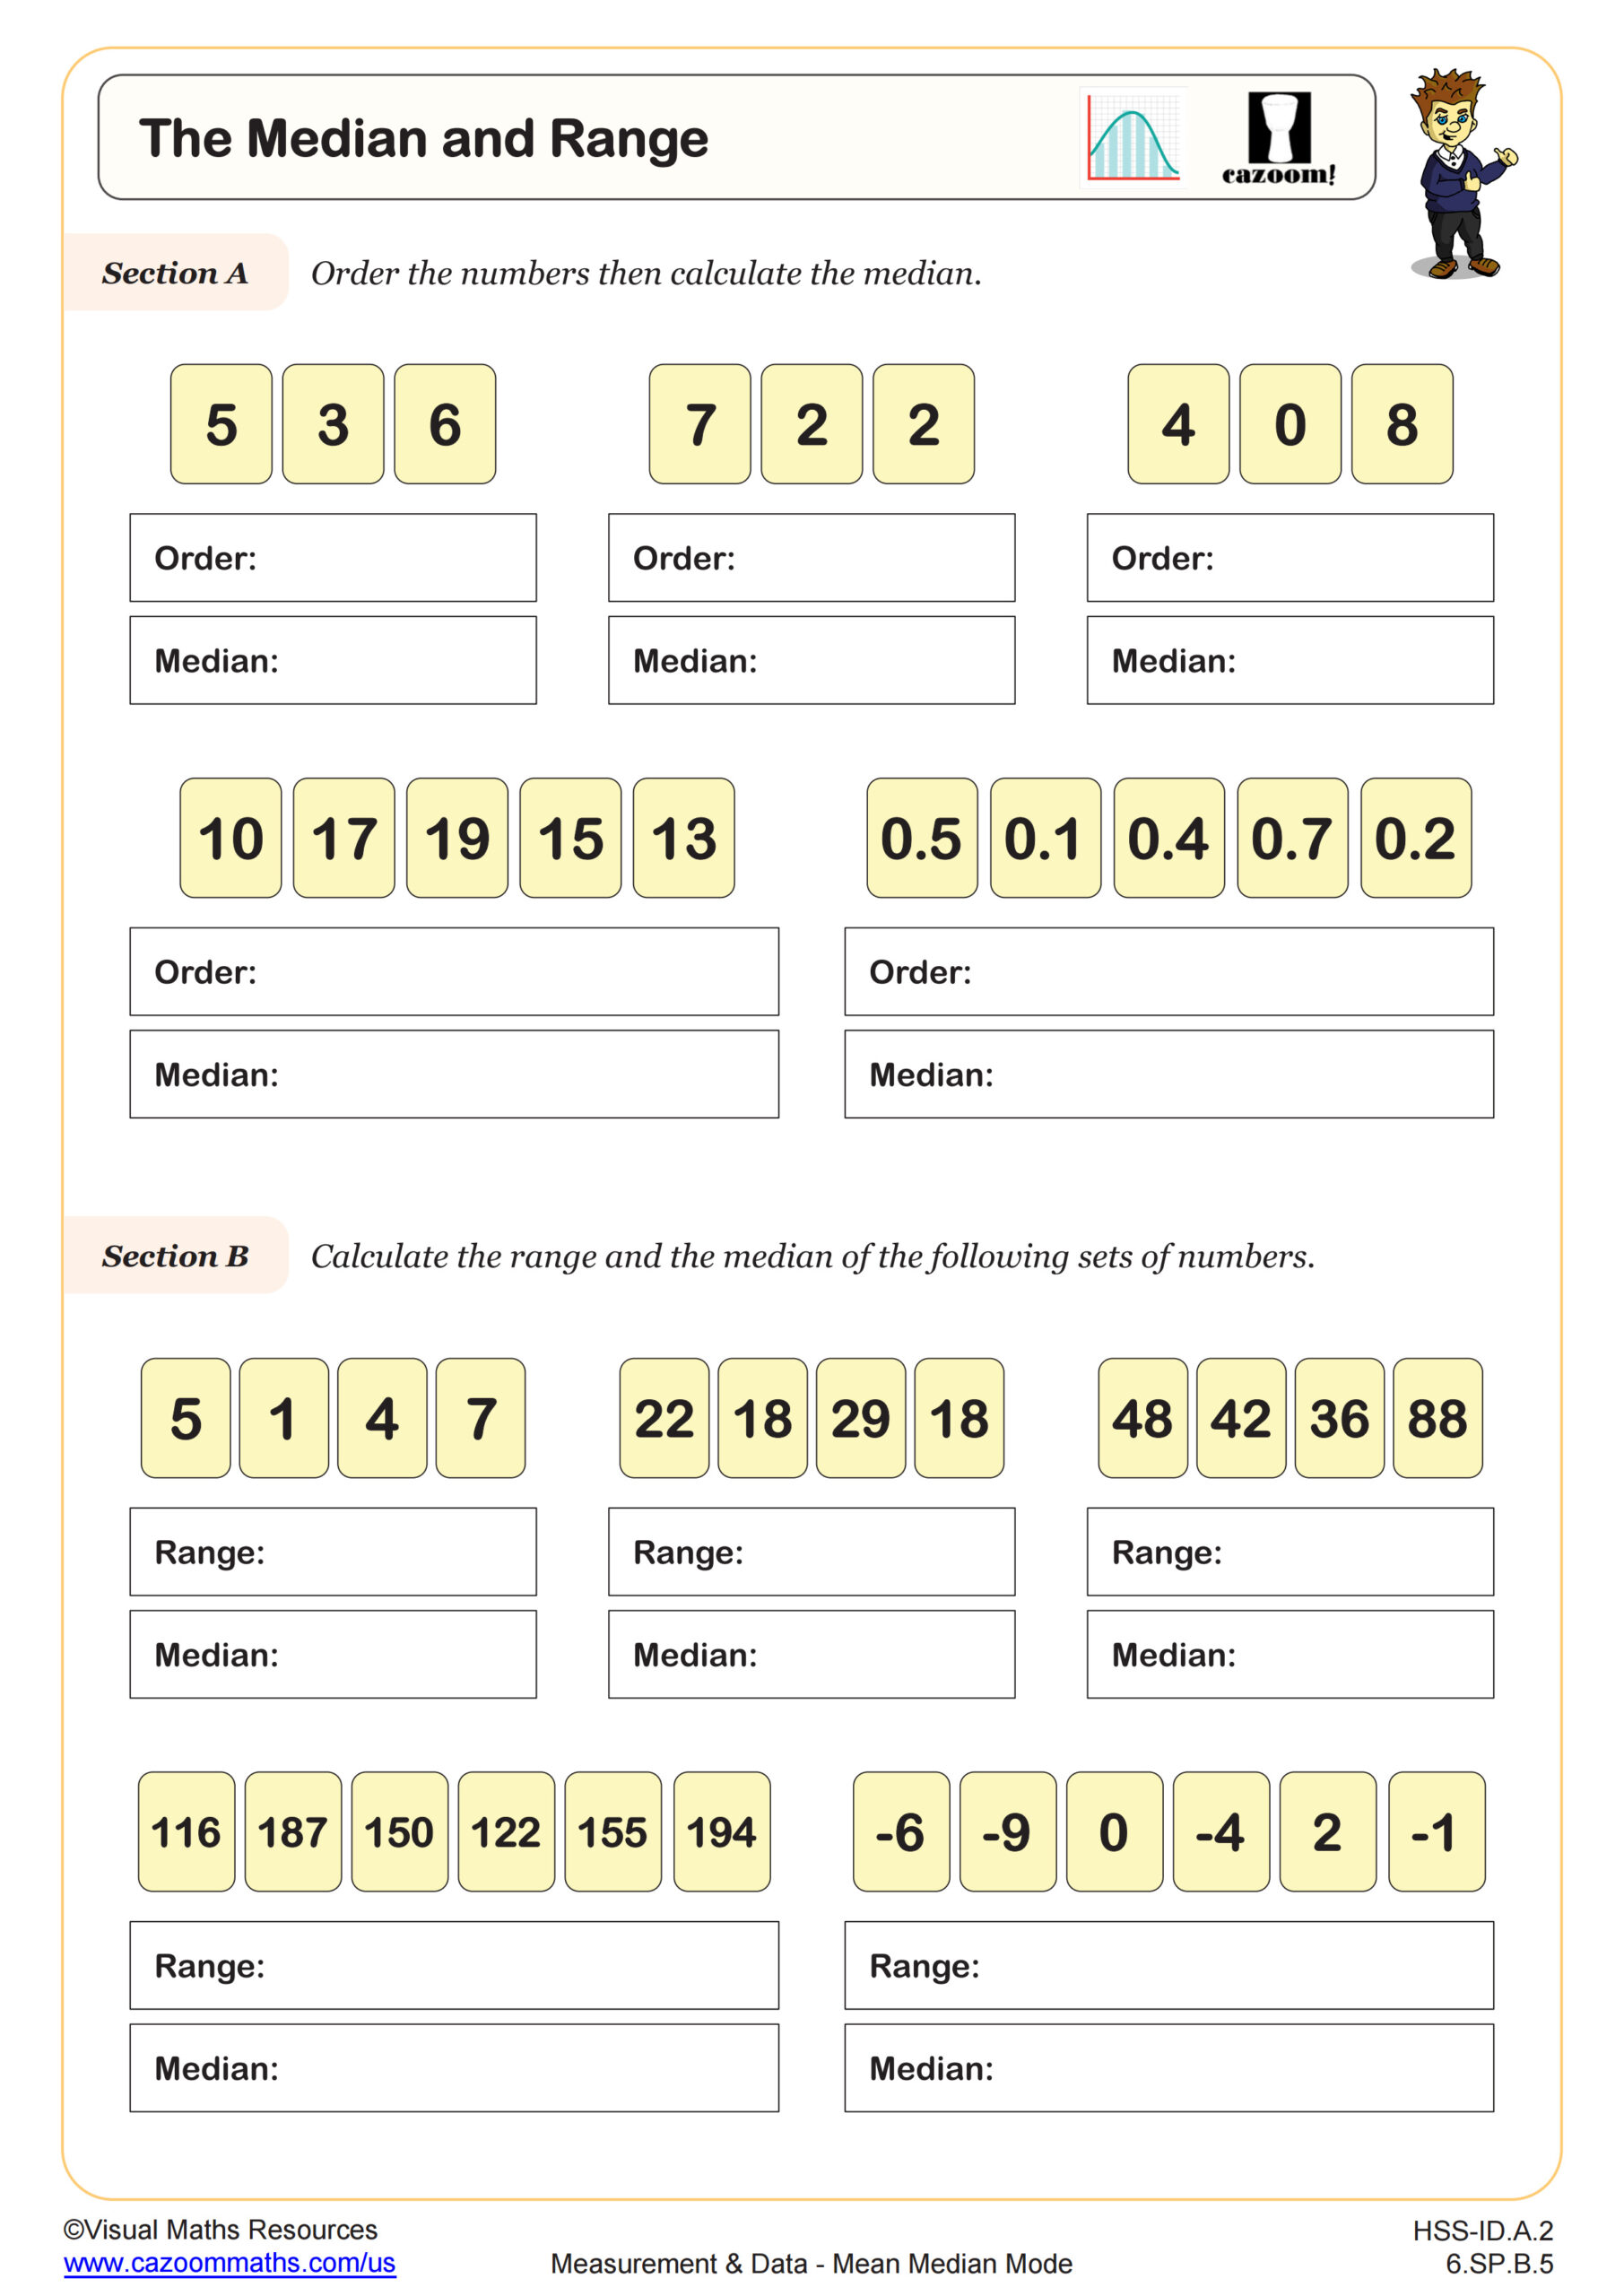
Median and Range
Grades: 6th Grade, Algebra I
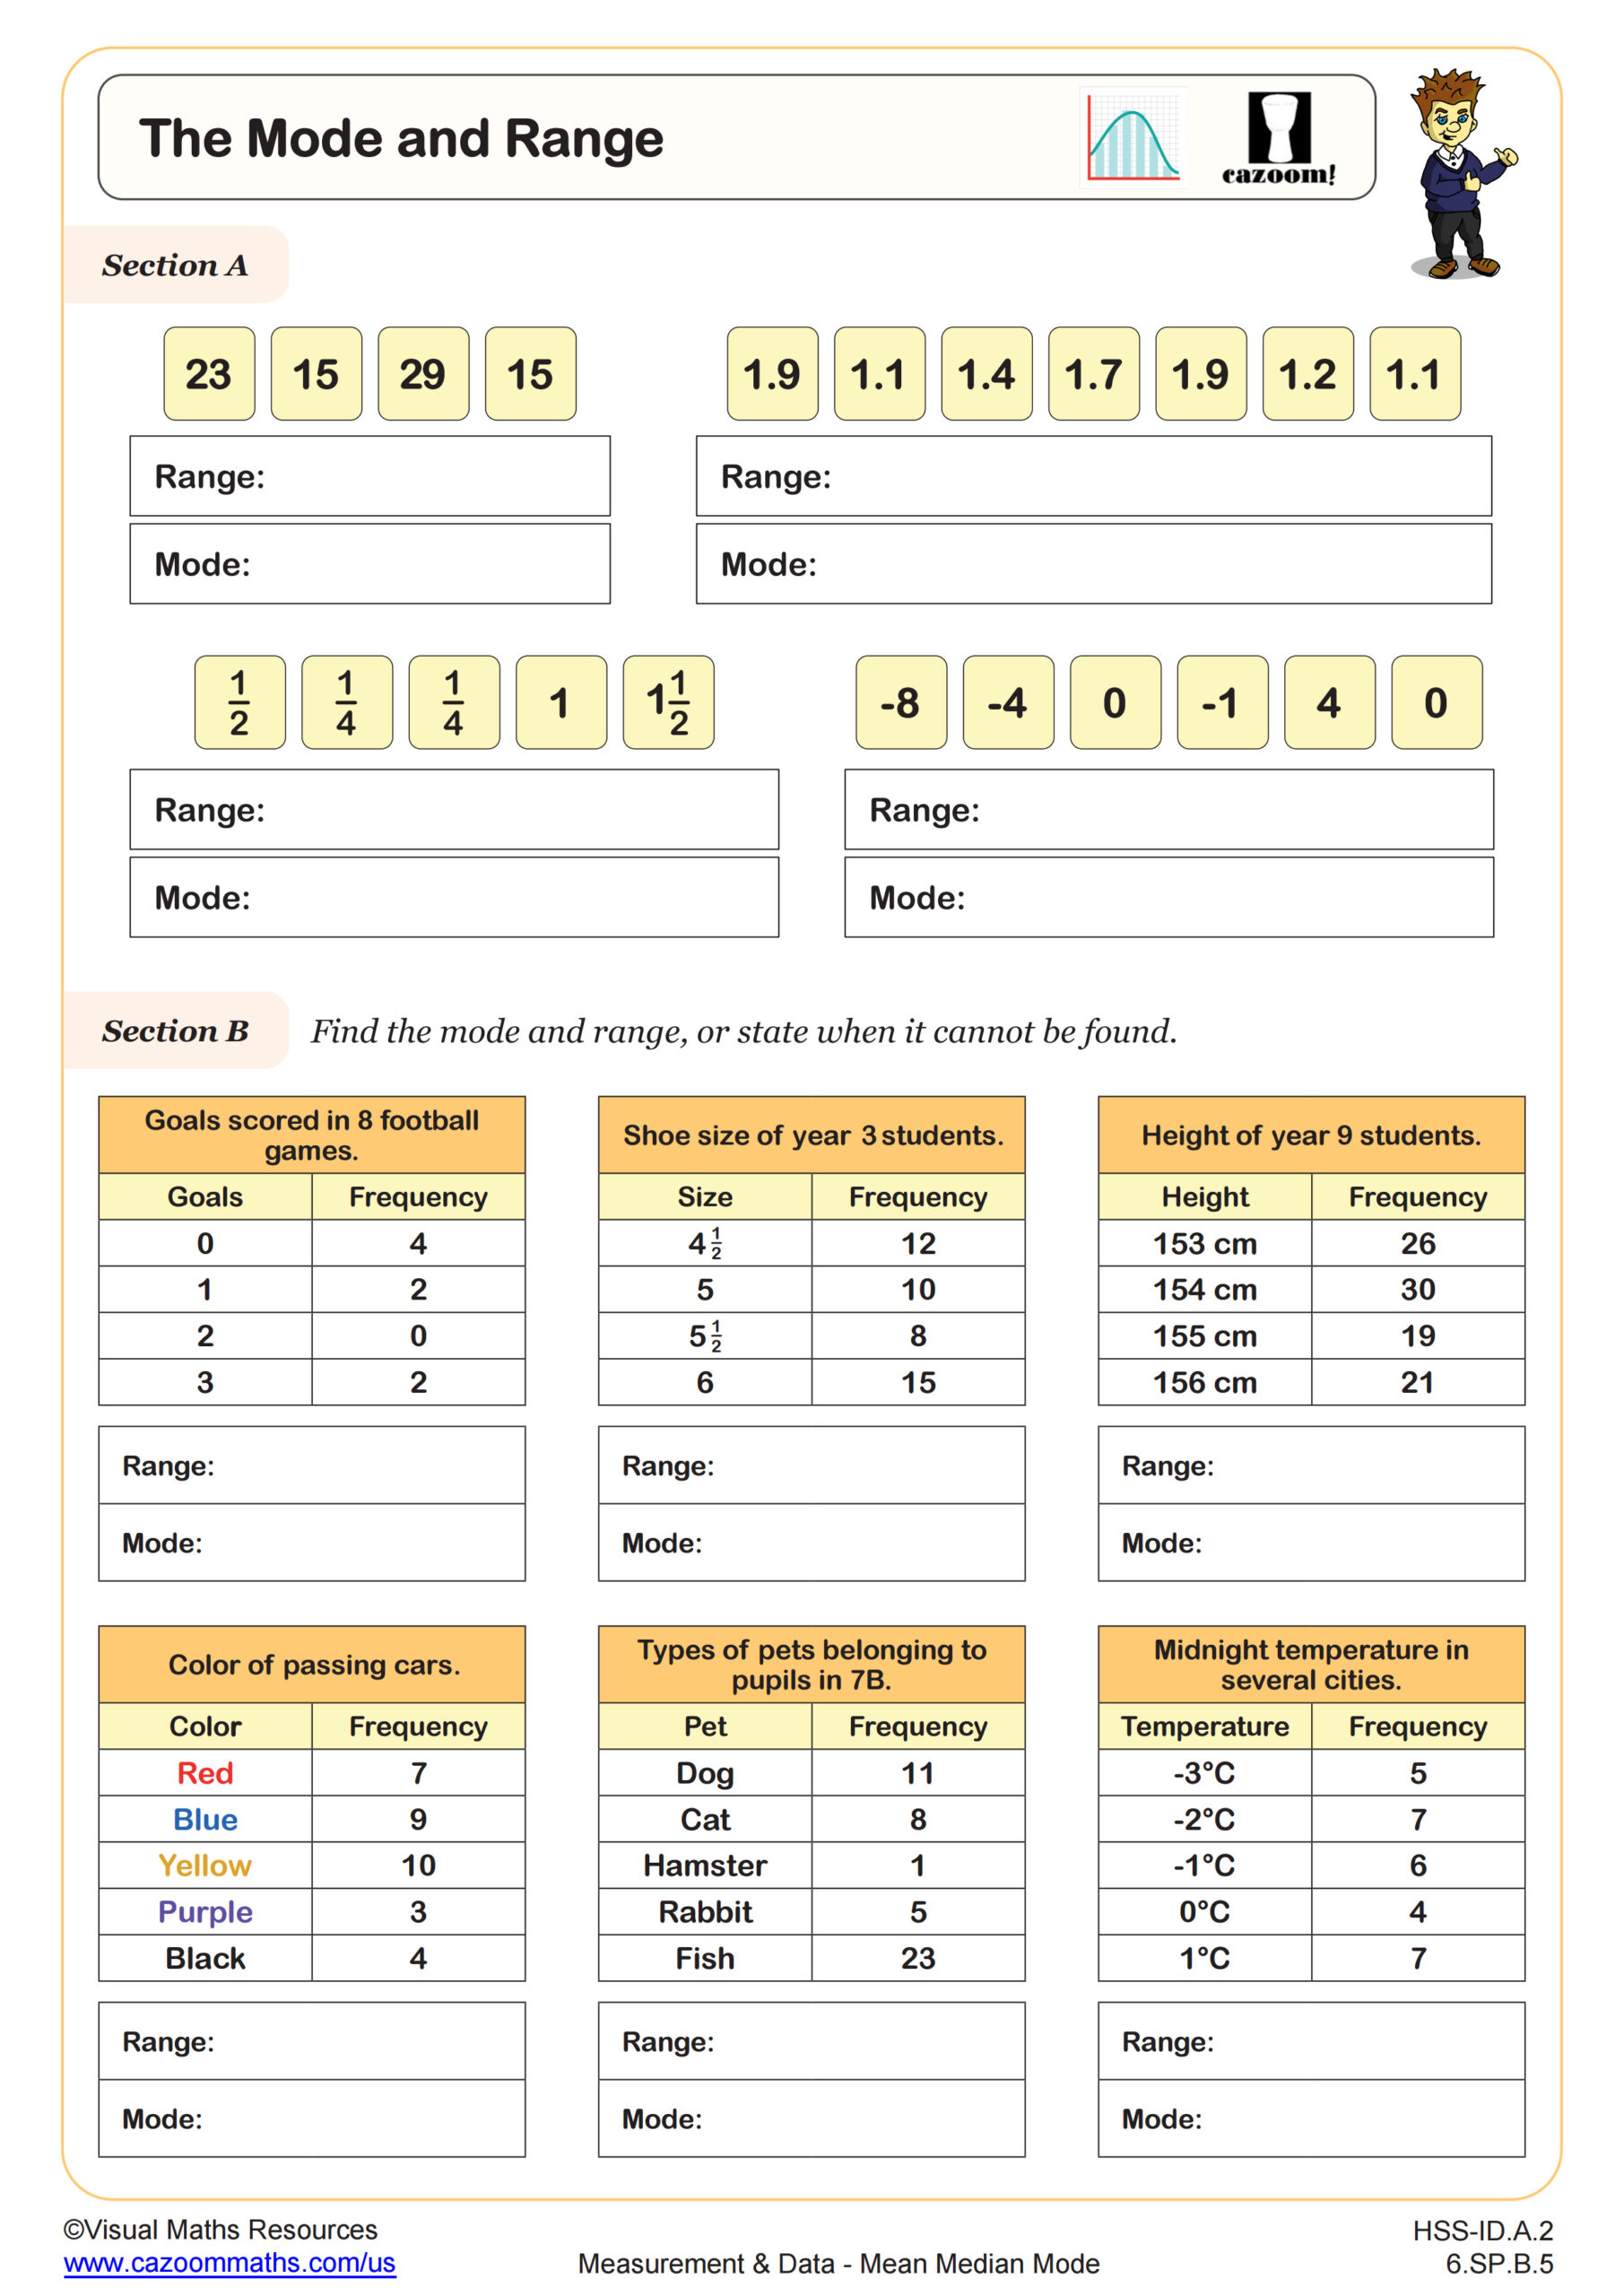
Mode and Range
Grades: 6th Grade, Algebra I
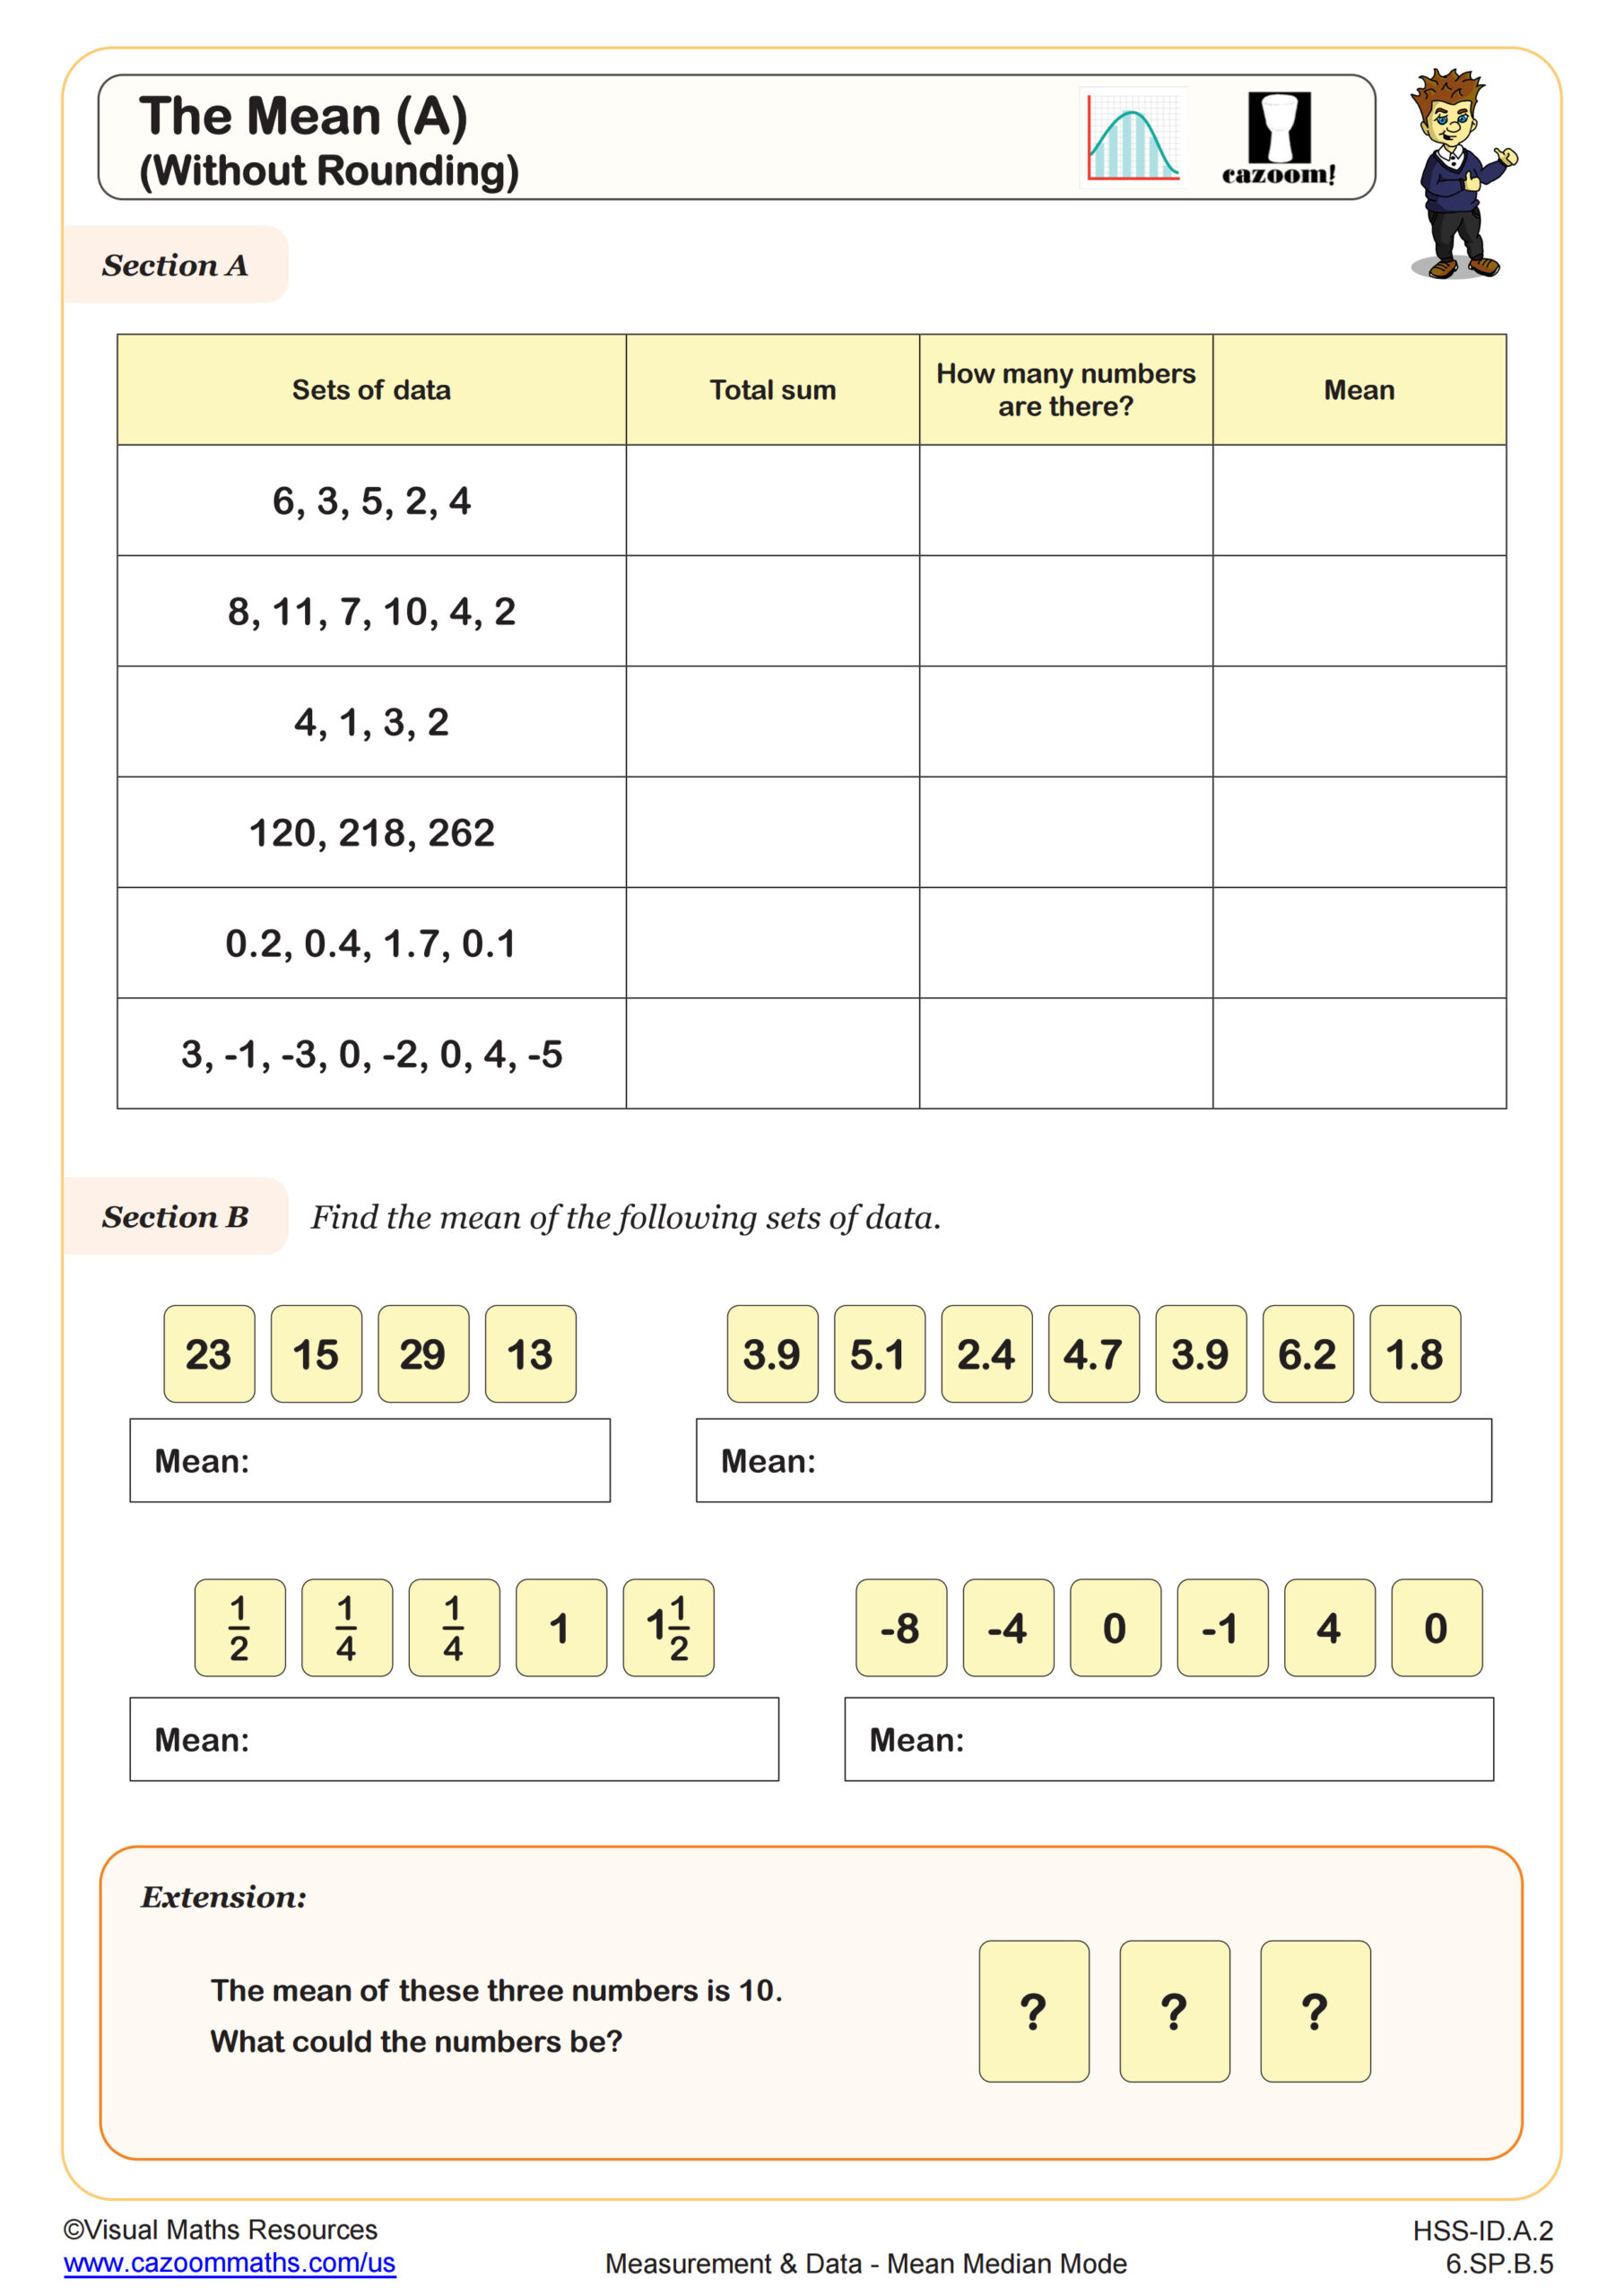
The Mean (A)
Grades: 6th Grade, Algebra I
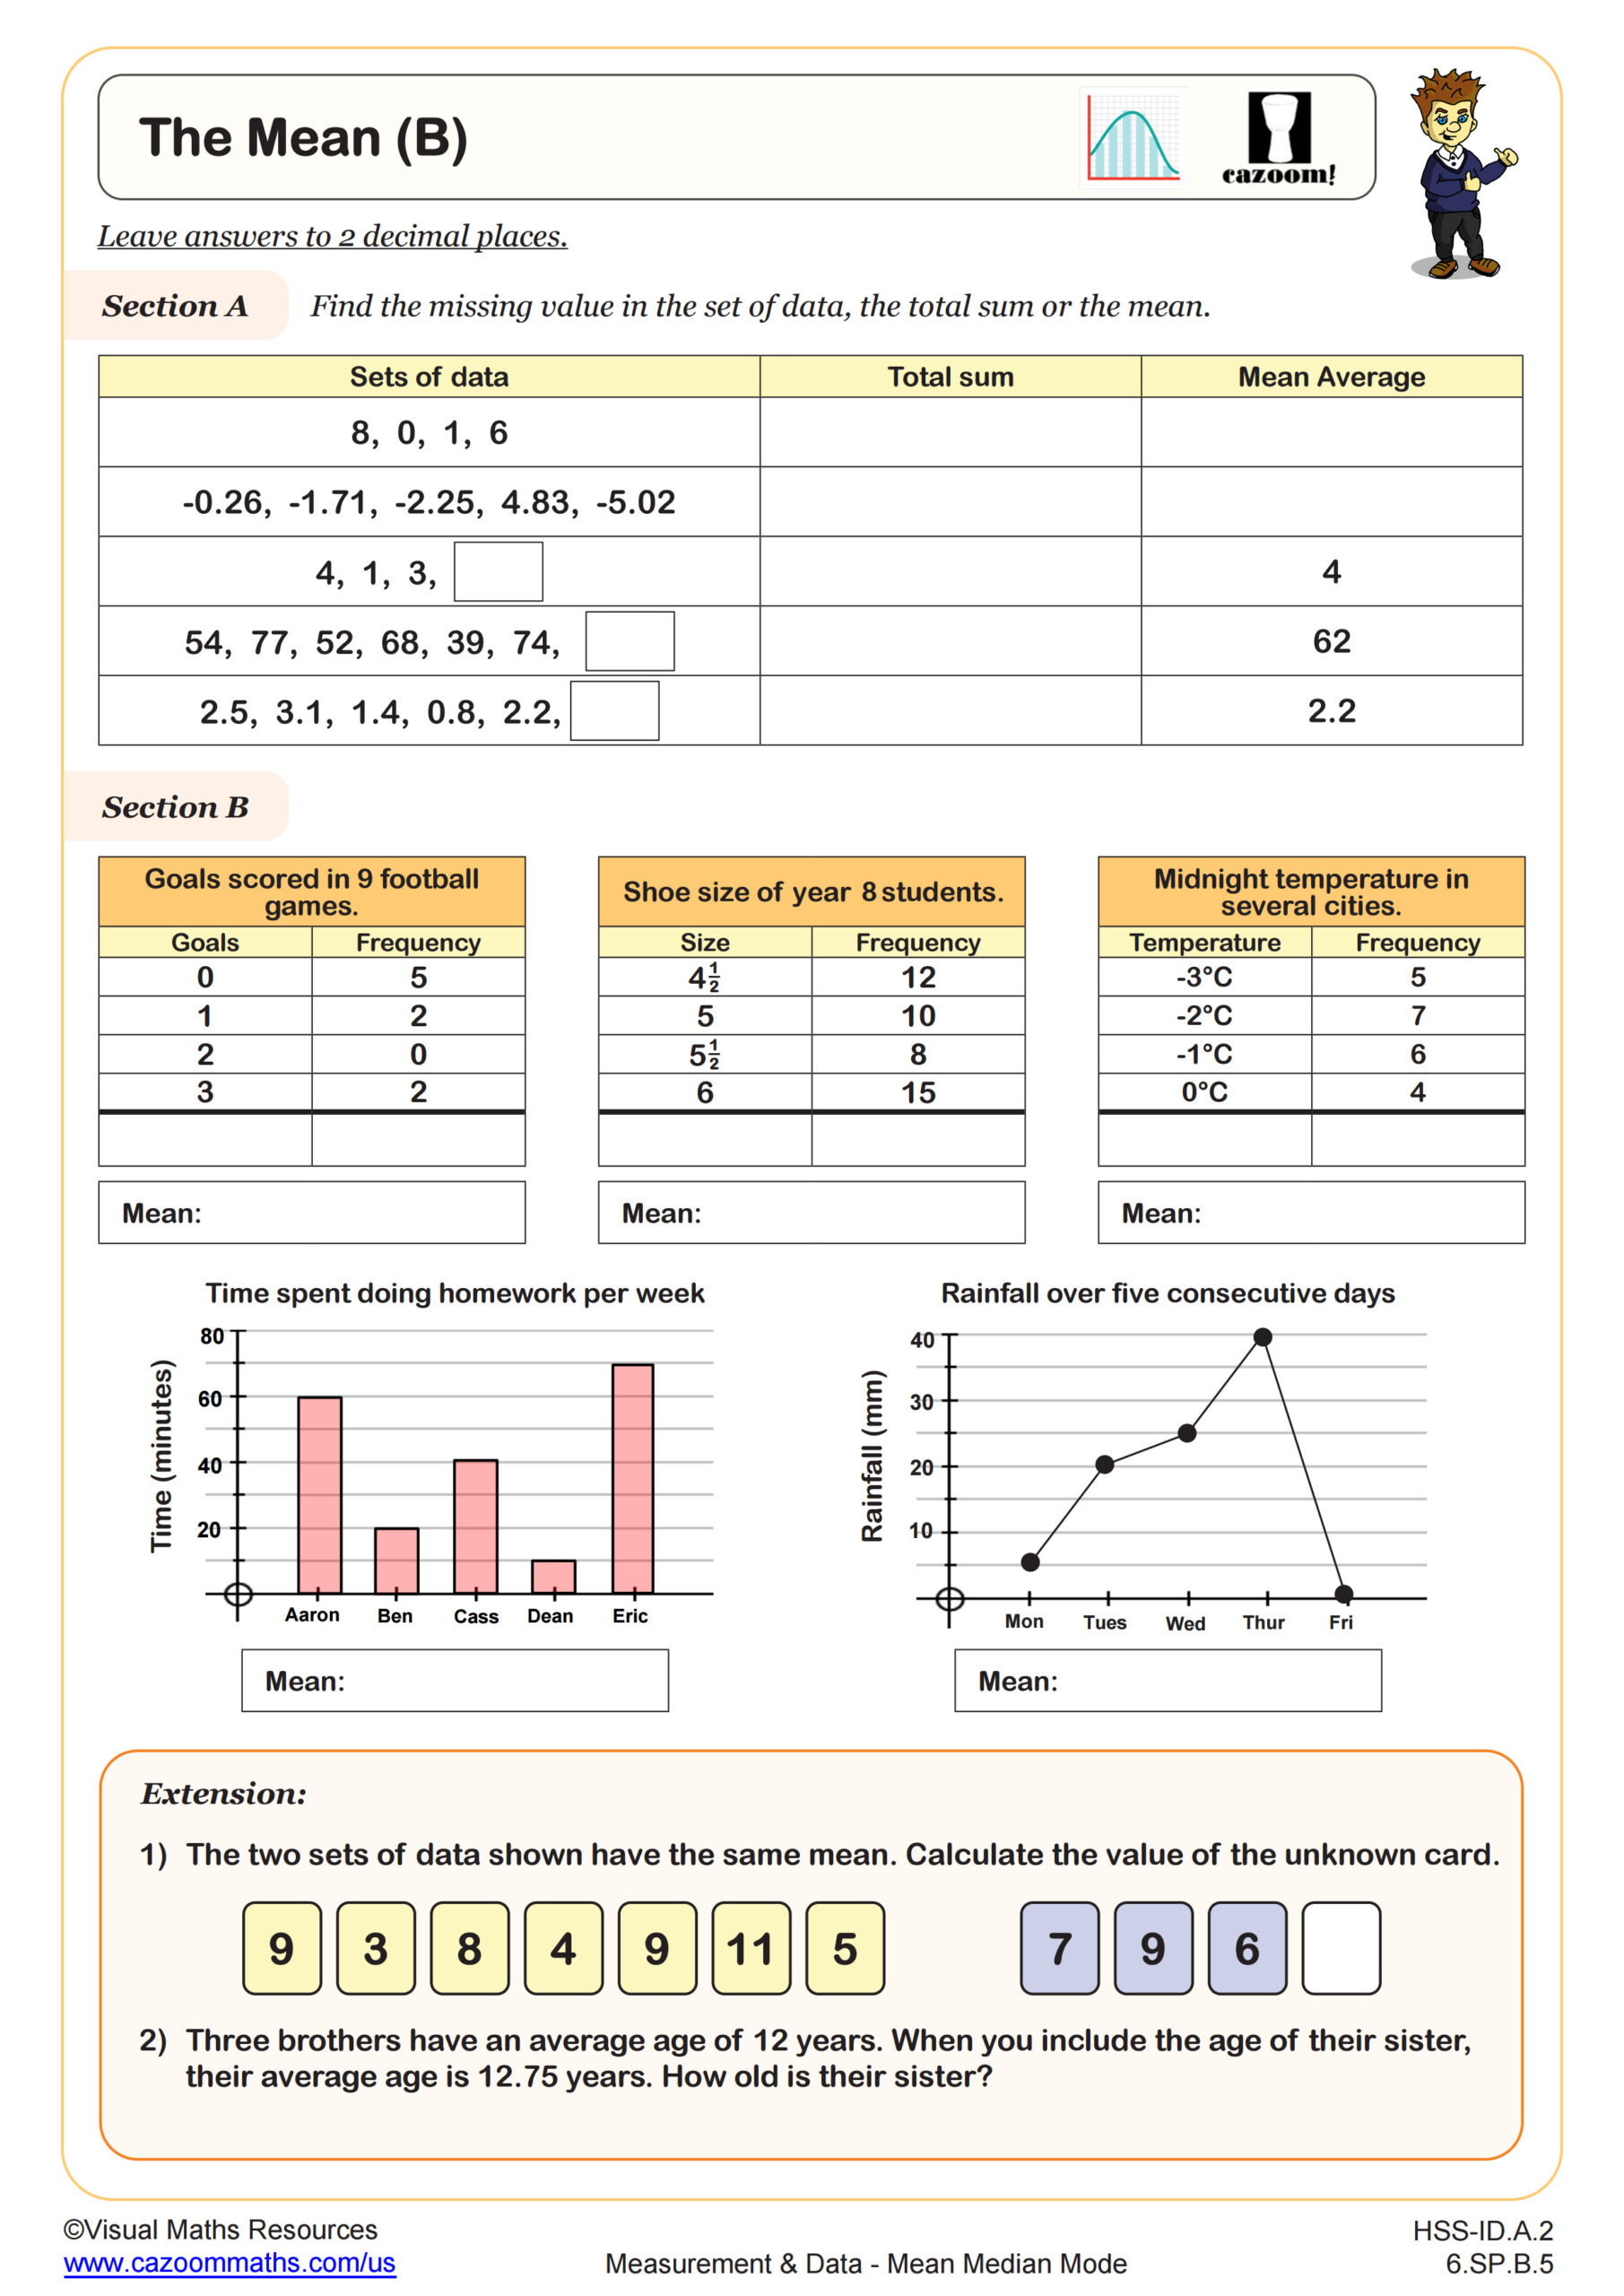
The Mean (B)
Grades: 6th Grade, Algebra I
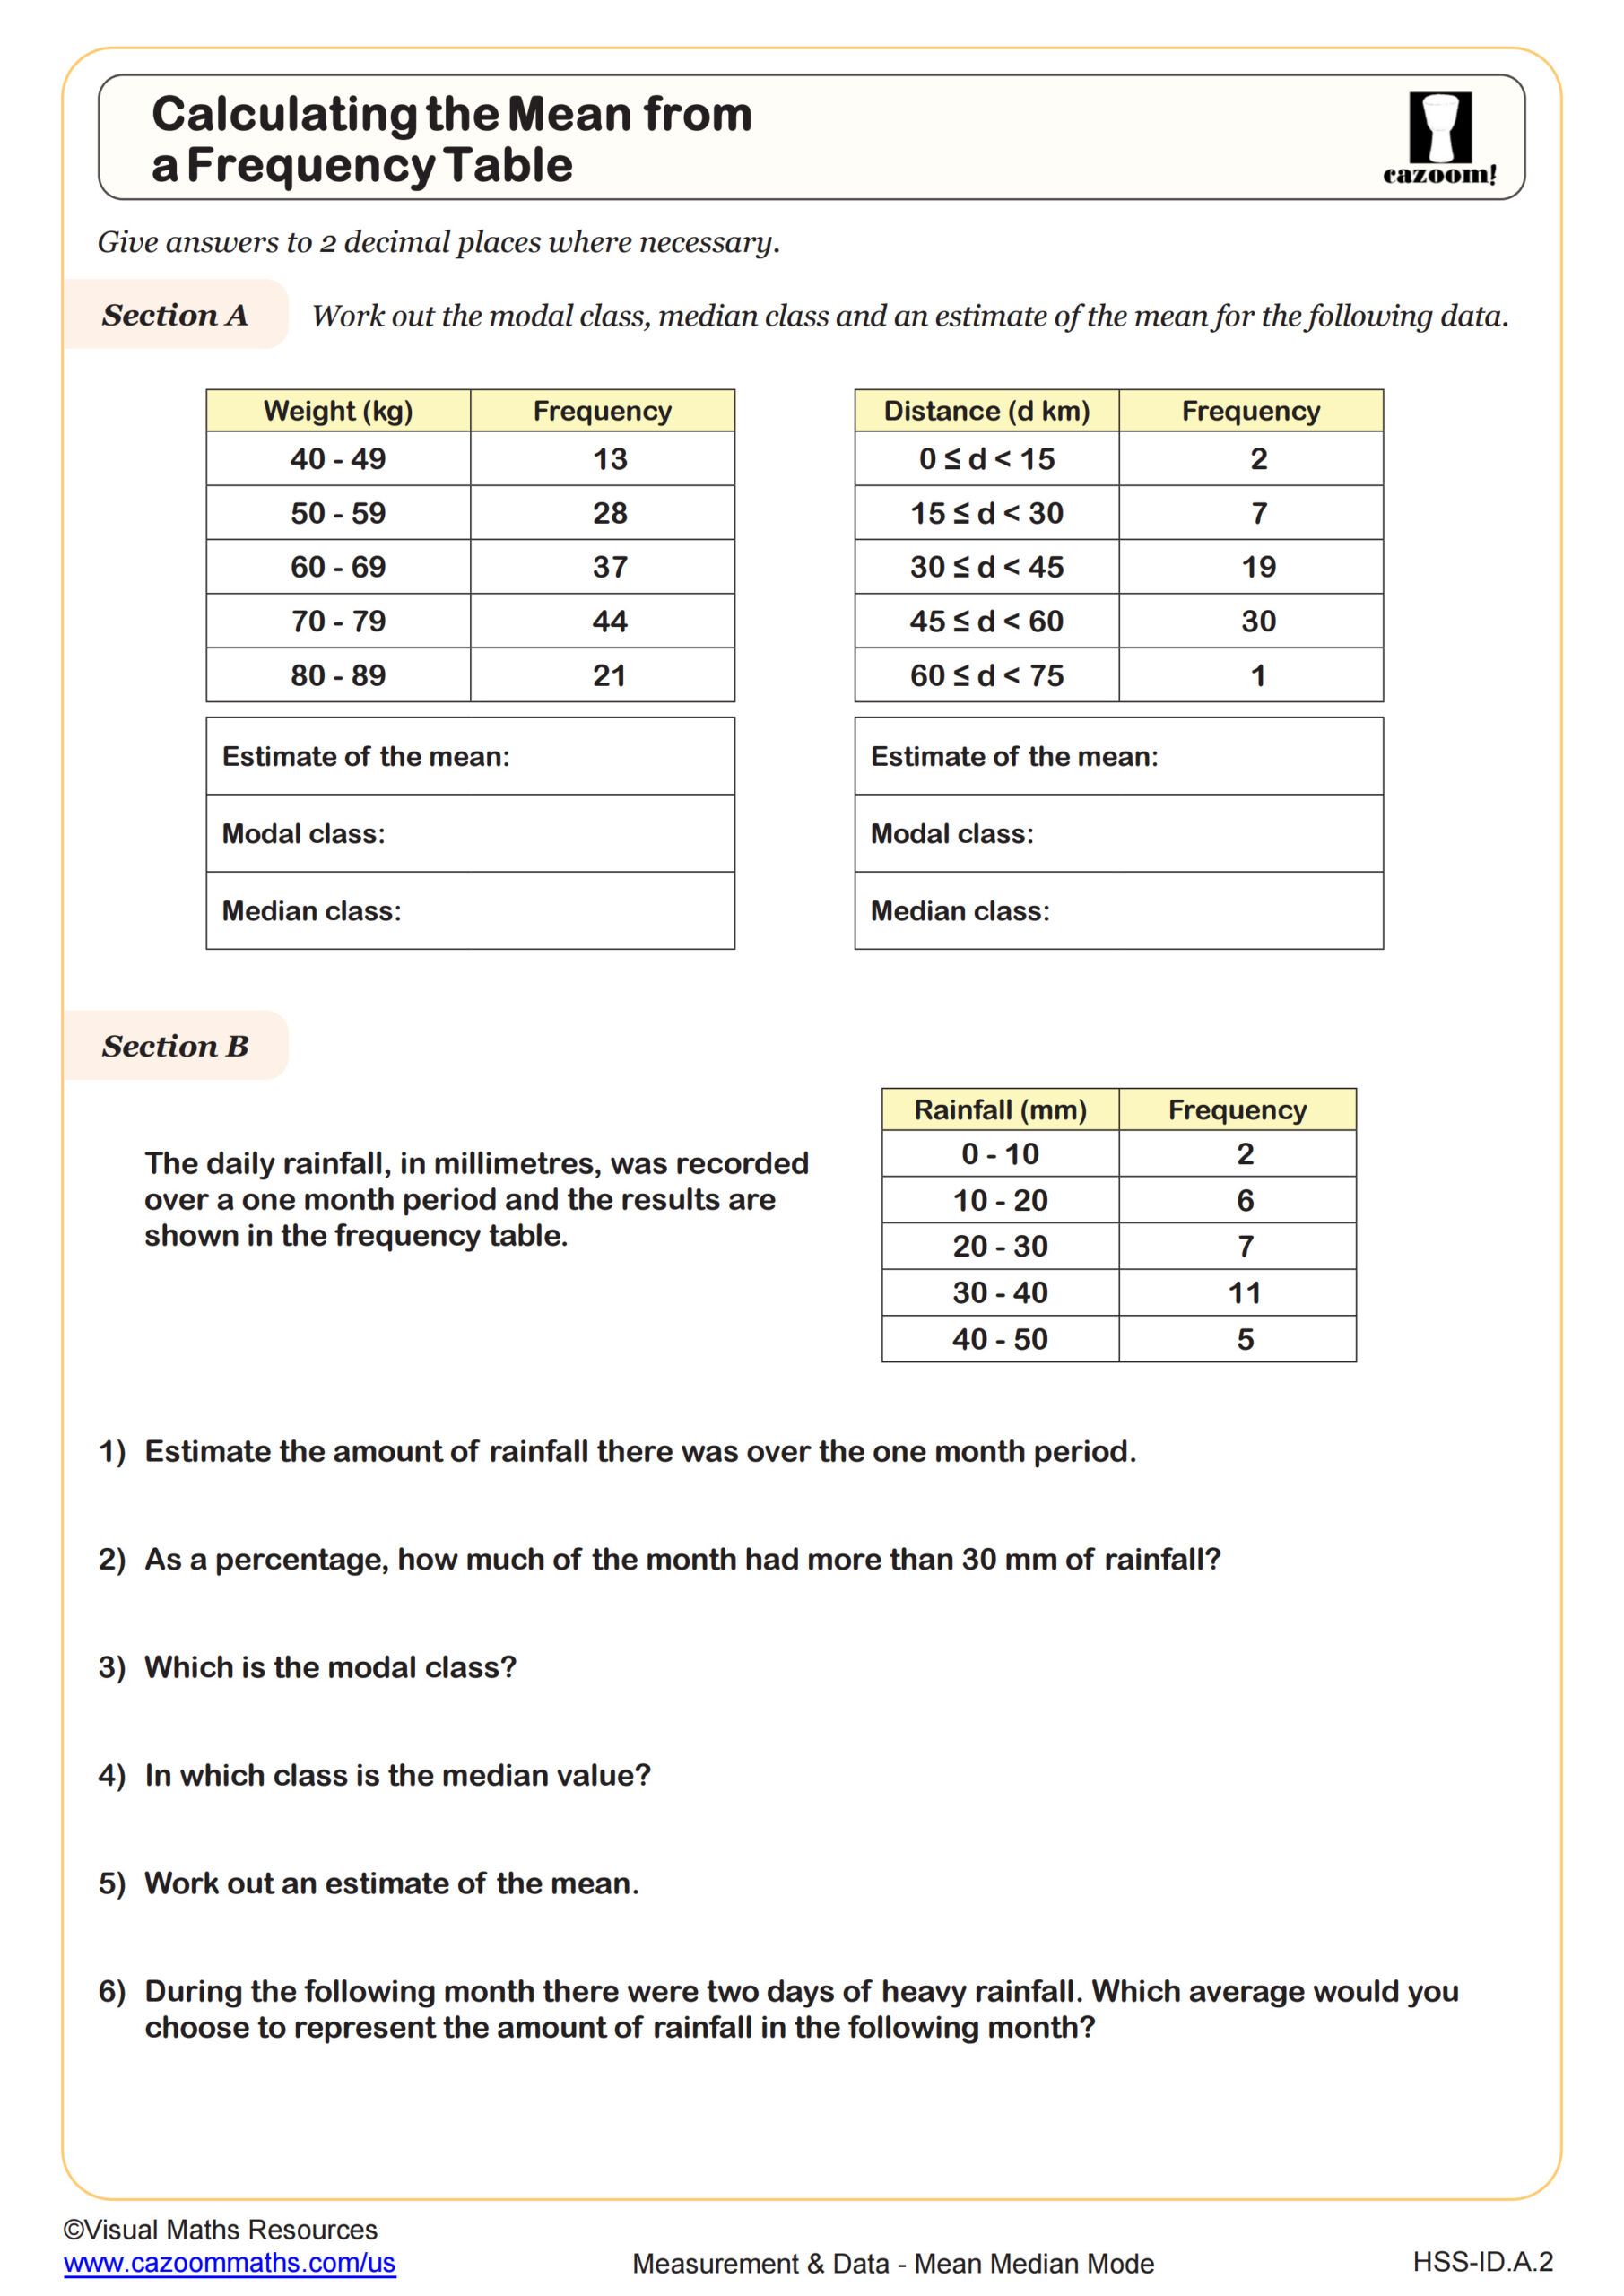
Calculating the Mean from a Frequency Table
Grades: Algebra I
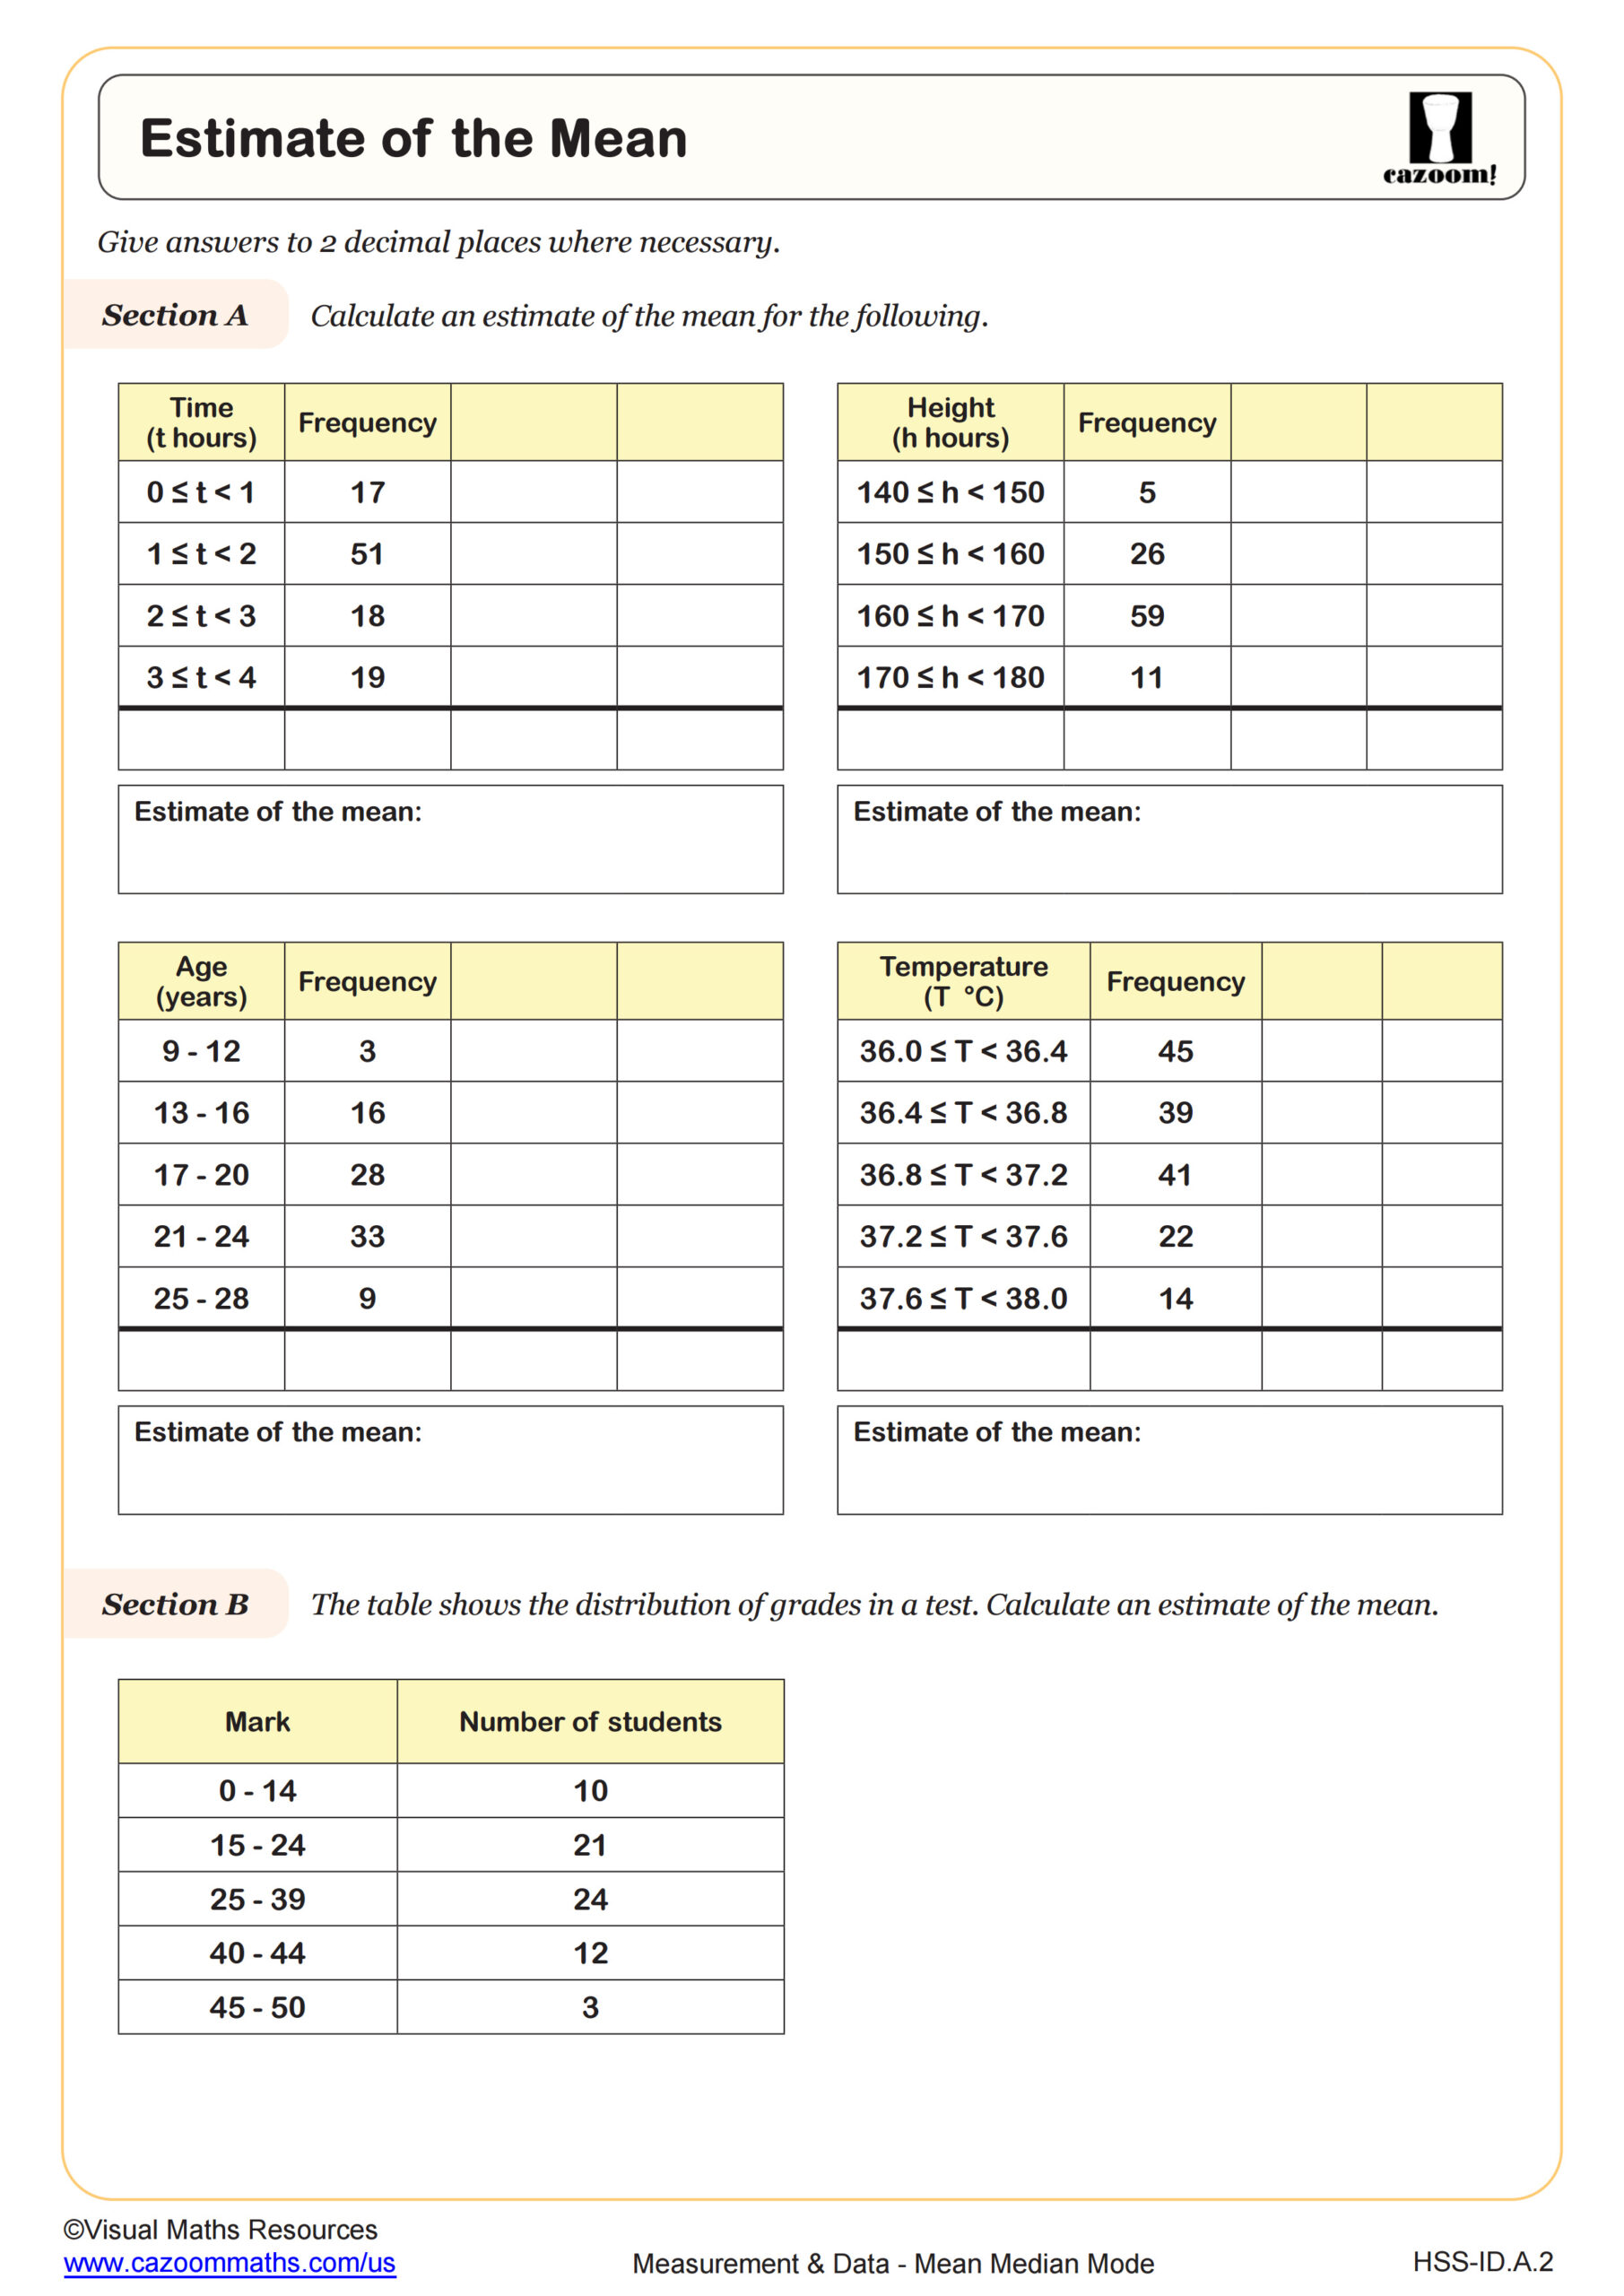
Estimating the Mean
Grades: Algebra I
All worksheets are created by the team of experienced teachers at Cazoom Math.
What Topics Do Mean Median Mode Worksheets Cover?
Mean median mode worksheets typically cover calculating arithmetic mean (average), finding median in ordered datasets, identifying mode in frequency distributions, and determining range. These align with Common Core standards 6.SP.3 and extend through high school statistics courses. Many worksheets combine all four measures, requiring students to organize data and apply multiple calculation methods.
Teachers notice students often confuse the procedures, especially when switching between odd and even-numbered datasets for median calculations. The most effective worksheets progress from simple whole numbers to decimals, then introduce real-world contexts like test scores, temperatures, and survey data to reinforce the practical applications of these statistical measures.
Which Grade Levels Use These Statistics Worksheets?
Mean median mode concepts typically begin in 6th grade with basic calculations and extend through high school statistics courses. Middle school students start with simple datasets and whole numbers, while high school students work with larger datasets, decimals, and grouped data. Advanced students may encounter weighted averages and analyze which measure best represents specific data distributions.
Teachers find that 7th and 8th grade students benefit most from mixed practice sheets that require identifying when to use each measure. High school students often revisit these concepts before tackling more complex statistical analysis, making review worksheets particularly valuable for reinforcing foundational skills before standardized tests.
How Do Students Learn to Choose Between Mean vs Median?
Students learn to distinguish between mean vs median by analyzing how outliers affect each measure and understanding when each best represents a dataset. Mean works well for normally distributed data, while median better represents skewed distributions or data with extreme values. Worksheets often include scenarios where students must justify their choice of measure.
Teachers observe that students initially default to calculating mean for every problem until they encounter datasets with obvious outliers. Effective practice problems include salary data, house prices, or test scores where extreme values make median more meaningful than mean, helping students develop critical thinking about appropriate statistical measures.
How Can Teachers Use These Worksheets Most Effectively?
Teachers maximize worksheet effectiveness by starting with guided practice before assigning independent work, emphasizing organization of data as the crucial first step. Many educators use a gradual release model, working through examples together before students tackle problems independently. The answer keys allow for immediate error correction and discussion of common mistakes.
Experienced teachers recommend having students explain their reasoning for each calculation step, not just provide final answers. This approach helps identify conceptual gaps versus computational errors. Many teachers also assign different worksheet sections to small groups, then have students teach their assigned concept to classmates, reinforcing understanding through peer instruction.