Stem-and-Leaf Diagrams Math Worksheets
All worksheets are created by the team of experienced teachers at Cazoom Math.
What should students focus on when using a stem and leaf plot worksheet?
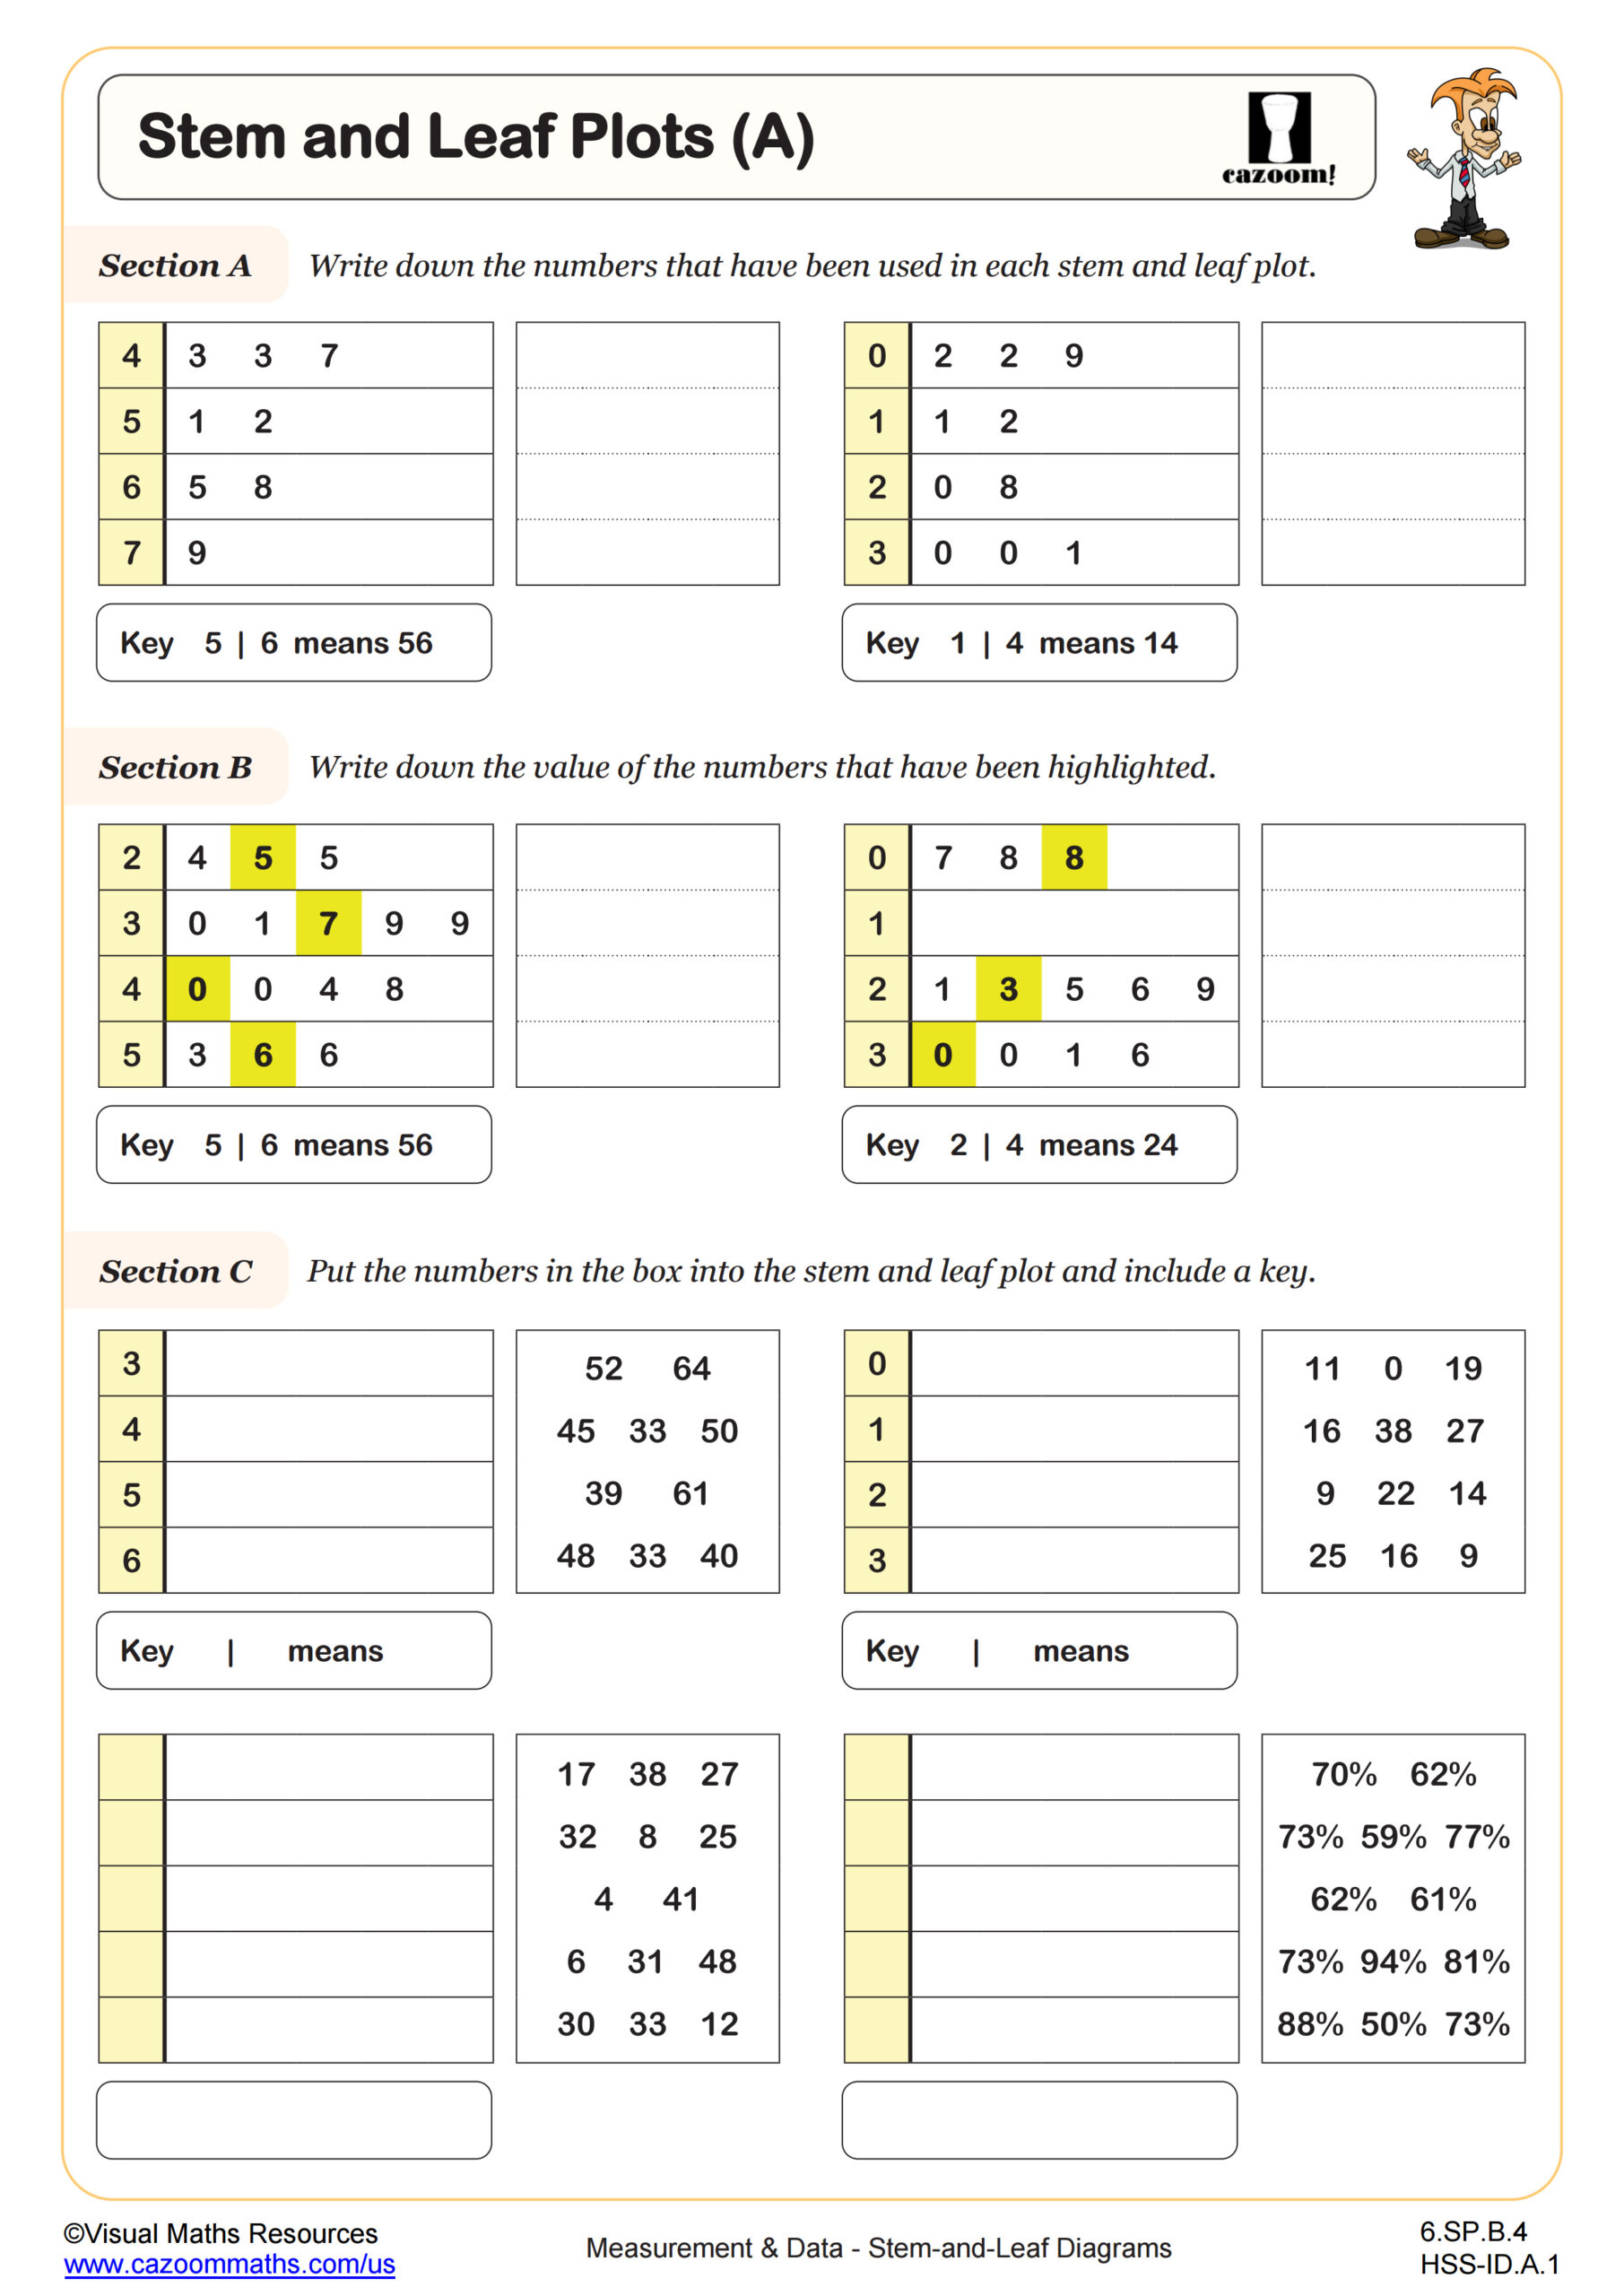
Students should concentrate on correctly separating tens and units digits when creating their plots, ensuring stems are listed in ascending order, and understanding that leaves must also be arranged from smallest to largest within each row. This aligns with Common Core standards for data representation across middle and high school levels.
Teachers notice that students frequently write complete two-digit numbers as leaves instead of single digits, or forget to include a key explaining their stem-and-leaf organization. Regular practice with stem leaf plot worksheet problems helps students avoid these misconceptions while building confidence in data interpretation skills needed for more advanced statistical concepts.
Which grade levels benefit most from stem and leaf worksheets?
Middle school students in grades 6-8 typically encounter stem-and-leaf plots as their introduction to statistical displays, though the concept extends through high school statistics courses. Grade 6 students start with simple single-digit stems, while grades 7-8 work with larger datasets and decimal applications.
High school students revisit these concepts when analyzing more complex datasets in algebra and statistics courses, often comparing stem-and-leaf plots with histograms and box plots. Teachers find that students who master stem-and-leaf construction early show stronger performance in advanced data analysis topics, making these foundational worksheets valuable across multiple grade levels.
How do back-to-back stem and leaf plots help students analyze data?
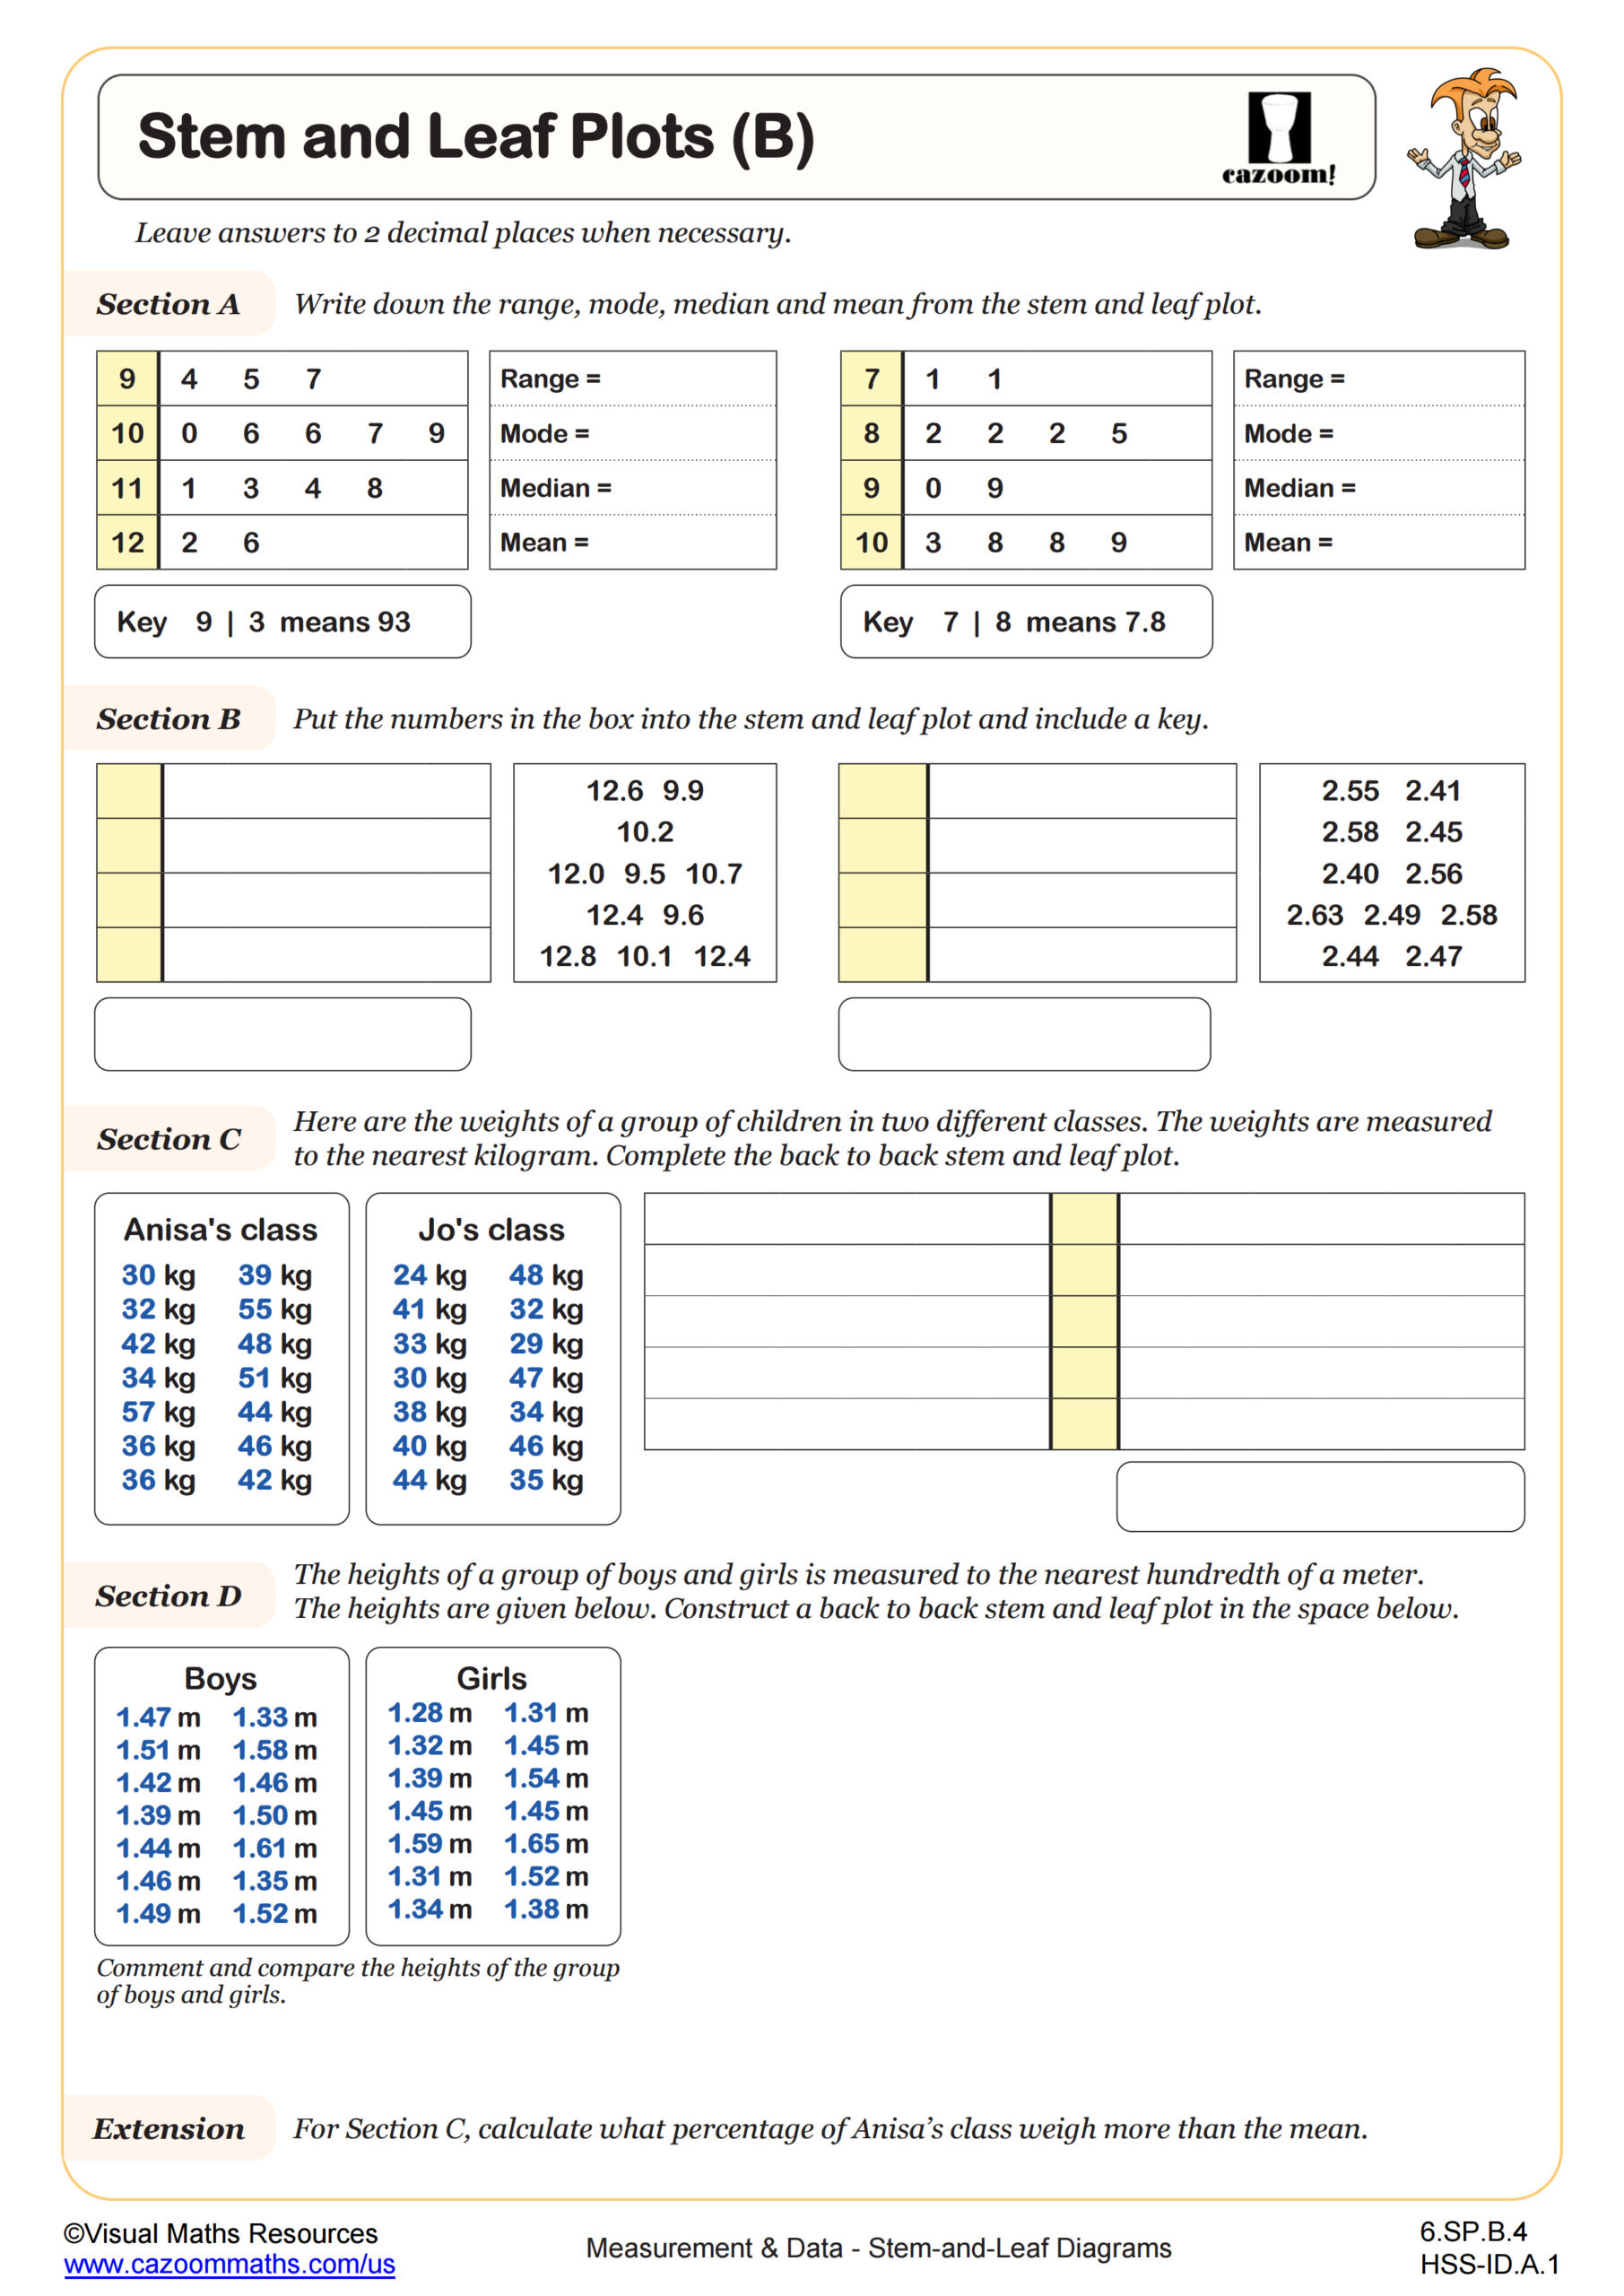
Back-to-back stem and leaf plots allow students to compare two related datasets side by side, using shared stems with leaves extending in both directions. This format helps students identify patterns, compare distributions, and make statistical inferences about two groups simultaneously.
Teachers observe that students initially struggle with reading back-to-back plots correctly, often mixing up which dataset corresponds to which side. Practice problems involving comparisons between male and female test scores, or before-and-after measurements in science experiments, help students understand this powerful comparative tool while connecting math concepts to real-world data analysis situations.
What makes stem and leaf plot worksheets effective for classroom instruction?
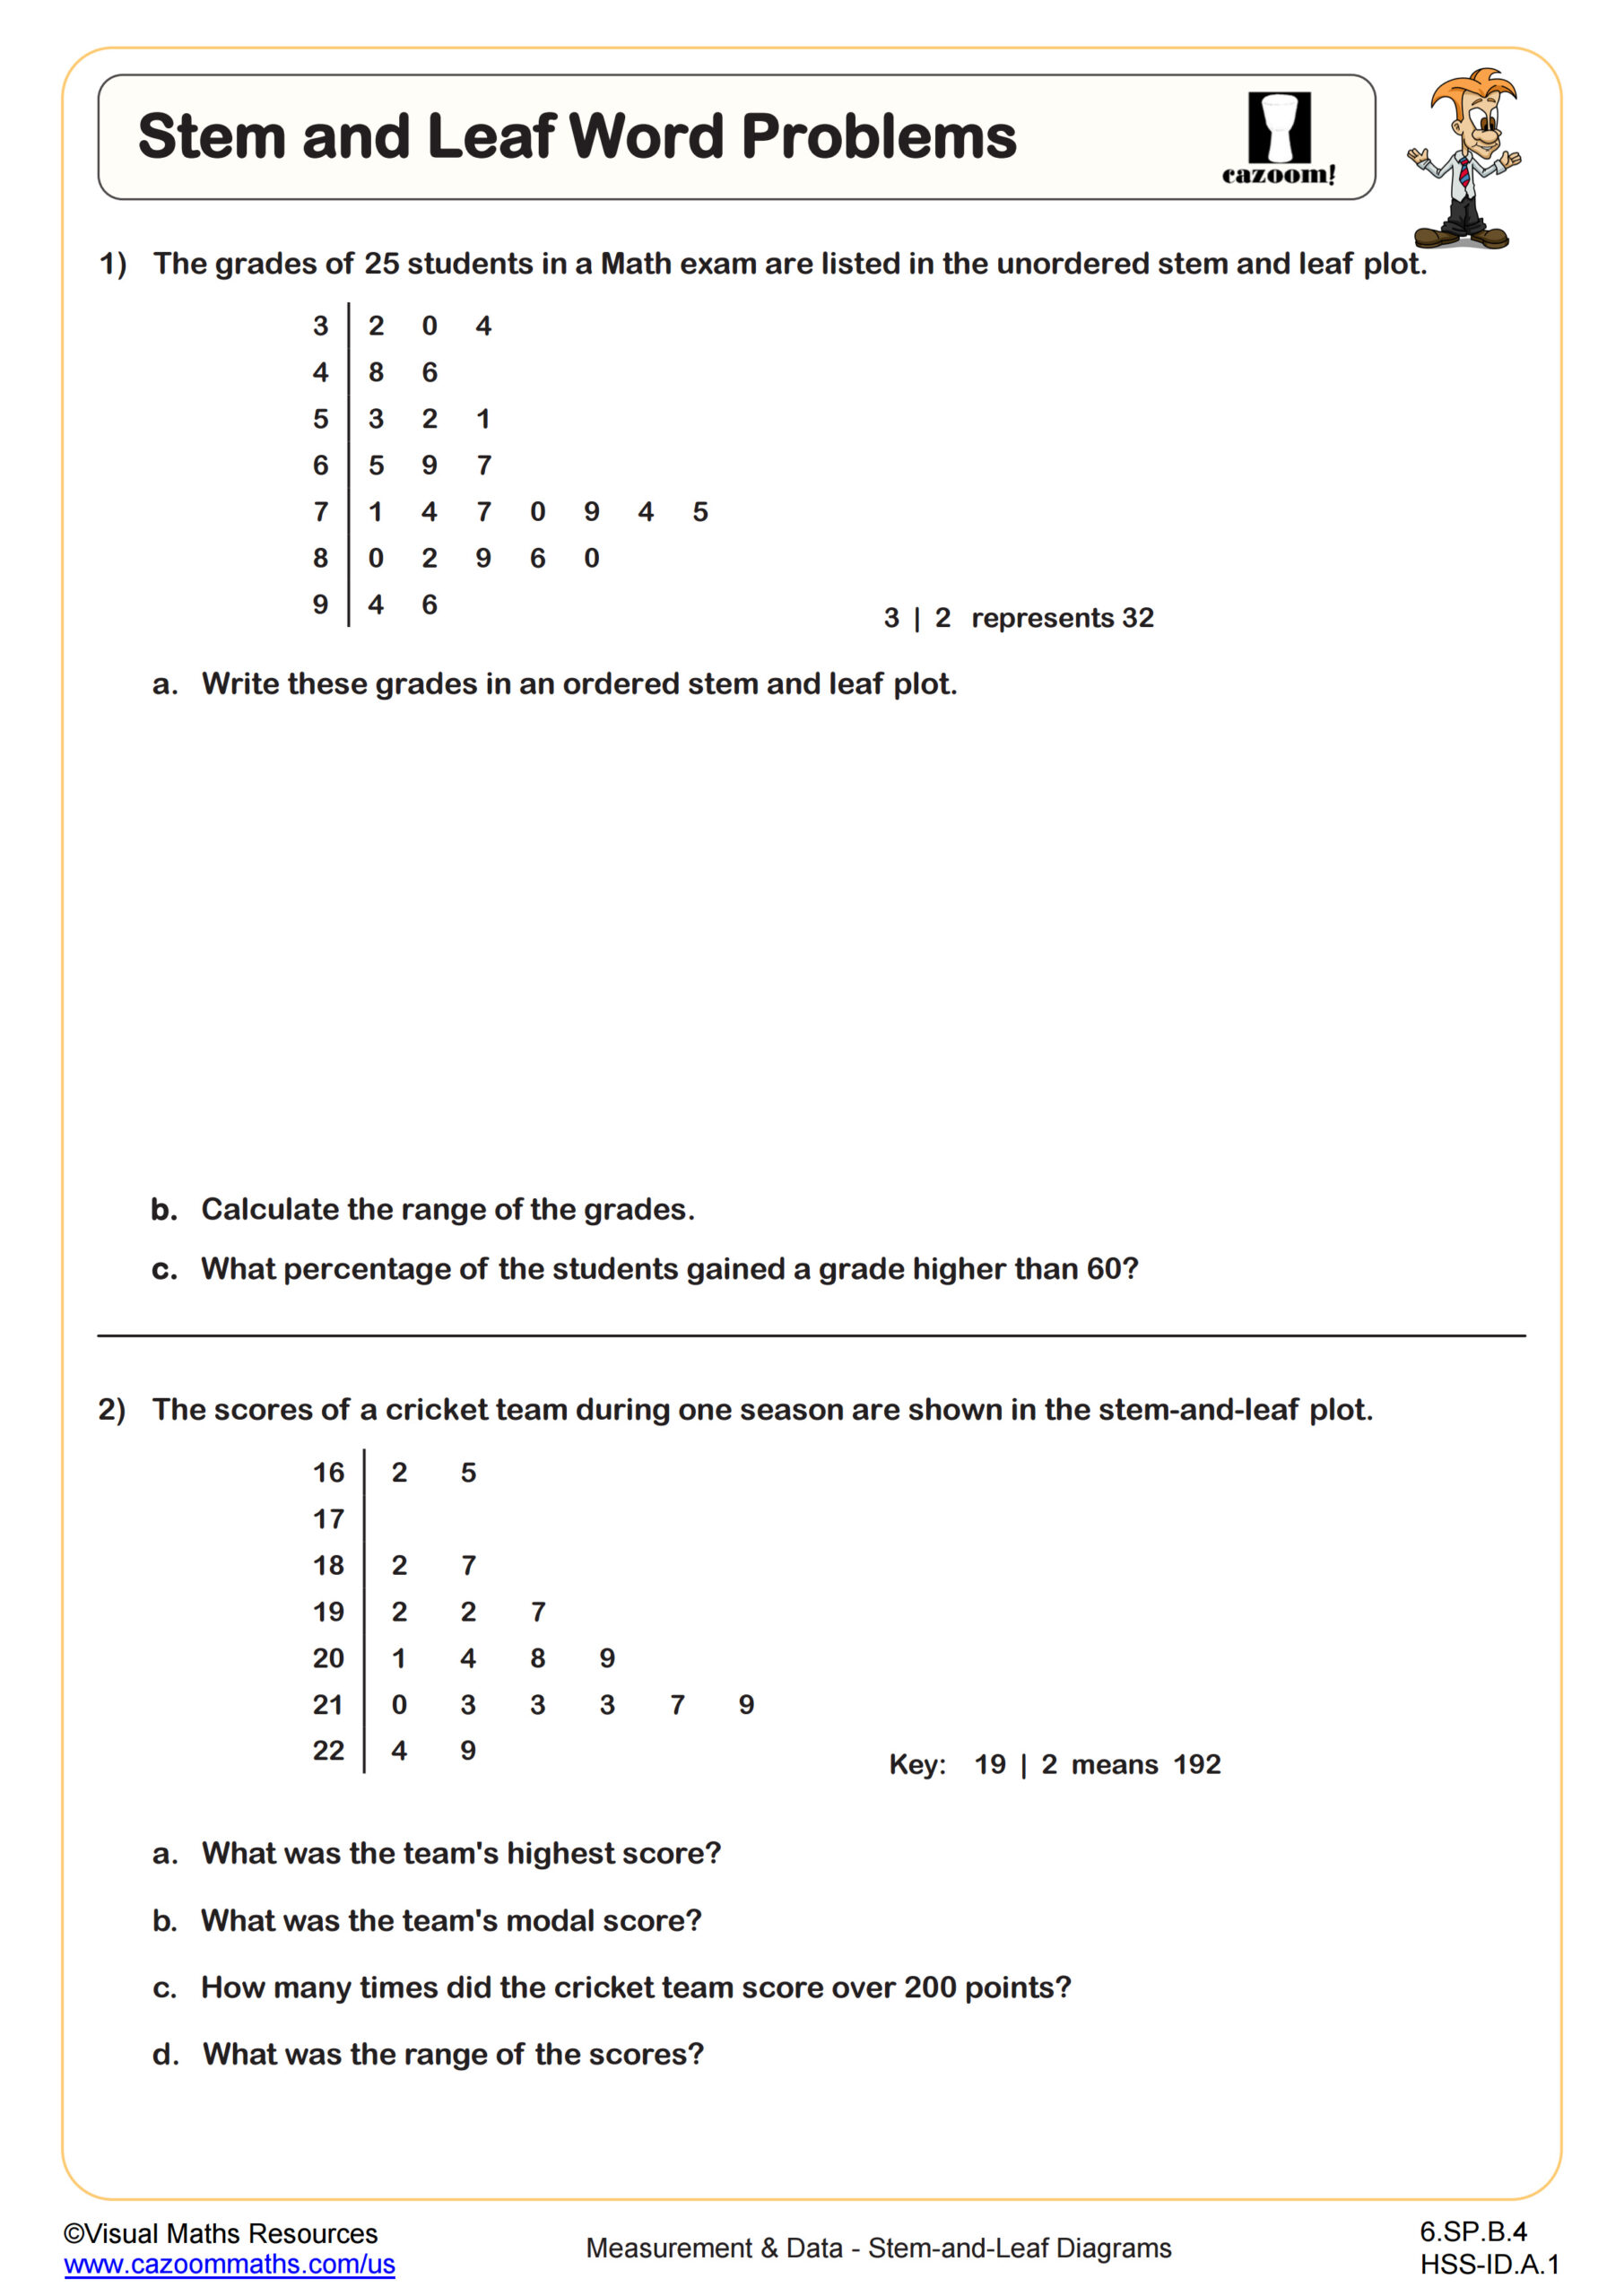
Effective stem and leaf plot worksheets progress systematically from guided examples through independent practice, including both construction and interpretation problems. Teachers should look for worksheets that provide datasets with varying complexity levels and include word problems requiring students to extract relevant data first.
Answer keys become particularly valuable when they show multiple acceptable arrangements and explain common student errors. Teachers find that worksheets incorporating real-world contexts like sports statistics, weather data, or scientific measurements help students understand why data organization matters beyond the math classroom, preparing them for data literacy requirements in STEM fields and standardized testing.
Requisite Knowledge Before Learning Stem and Leaf Diagrams
Before working on these worksheets, students should be able to:
• Order numbers from least to greatest
• Understand place value (ones, tens, hundreds)
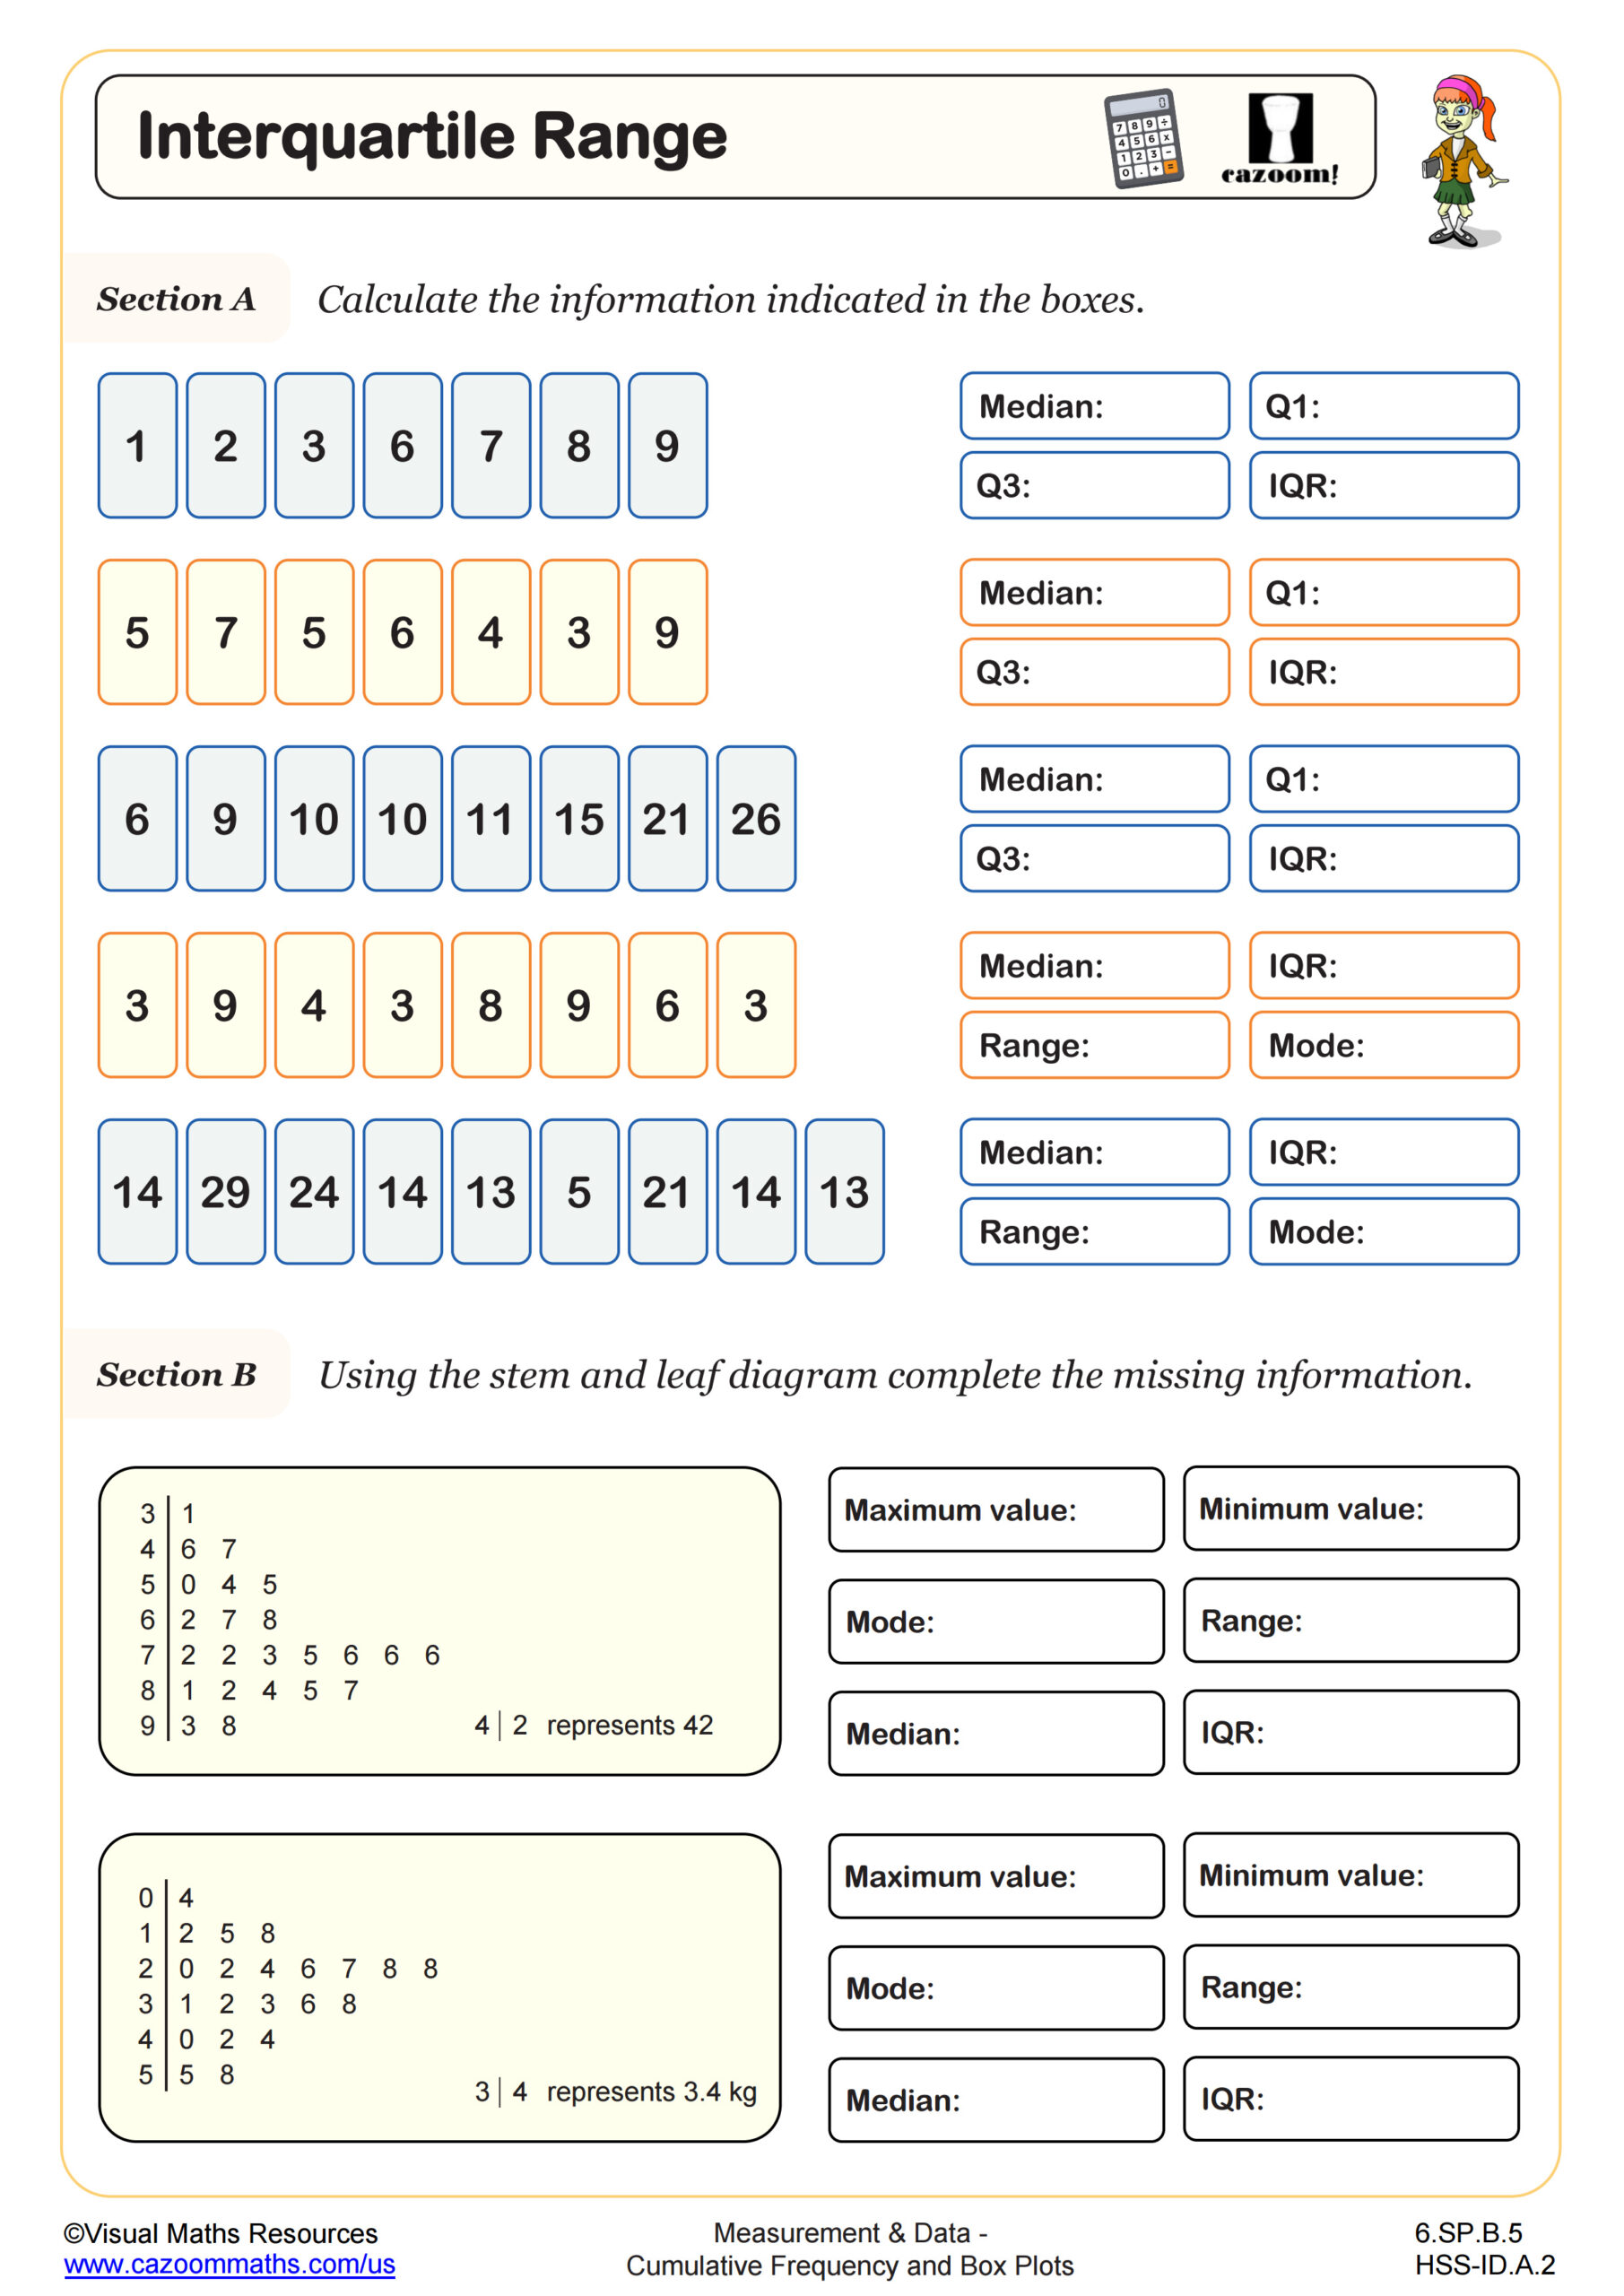
• Identify median, mode, and range
• Read and compare data from simple charts or tables
These foundational skills prepare students to successfully build and analyze stem and leaf plots with accuracy and understanding.