Printable Samples and Surveys Worksheets
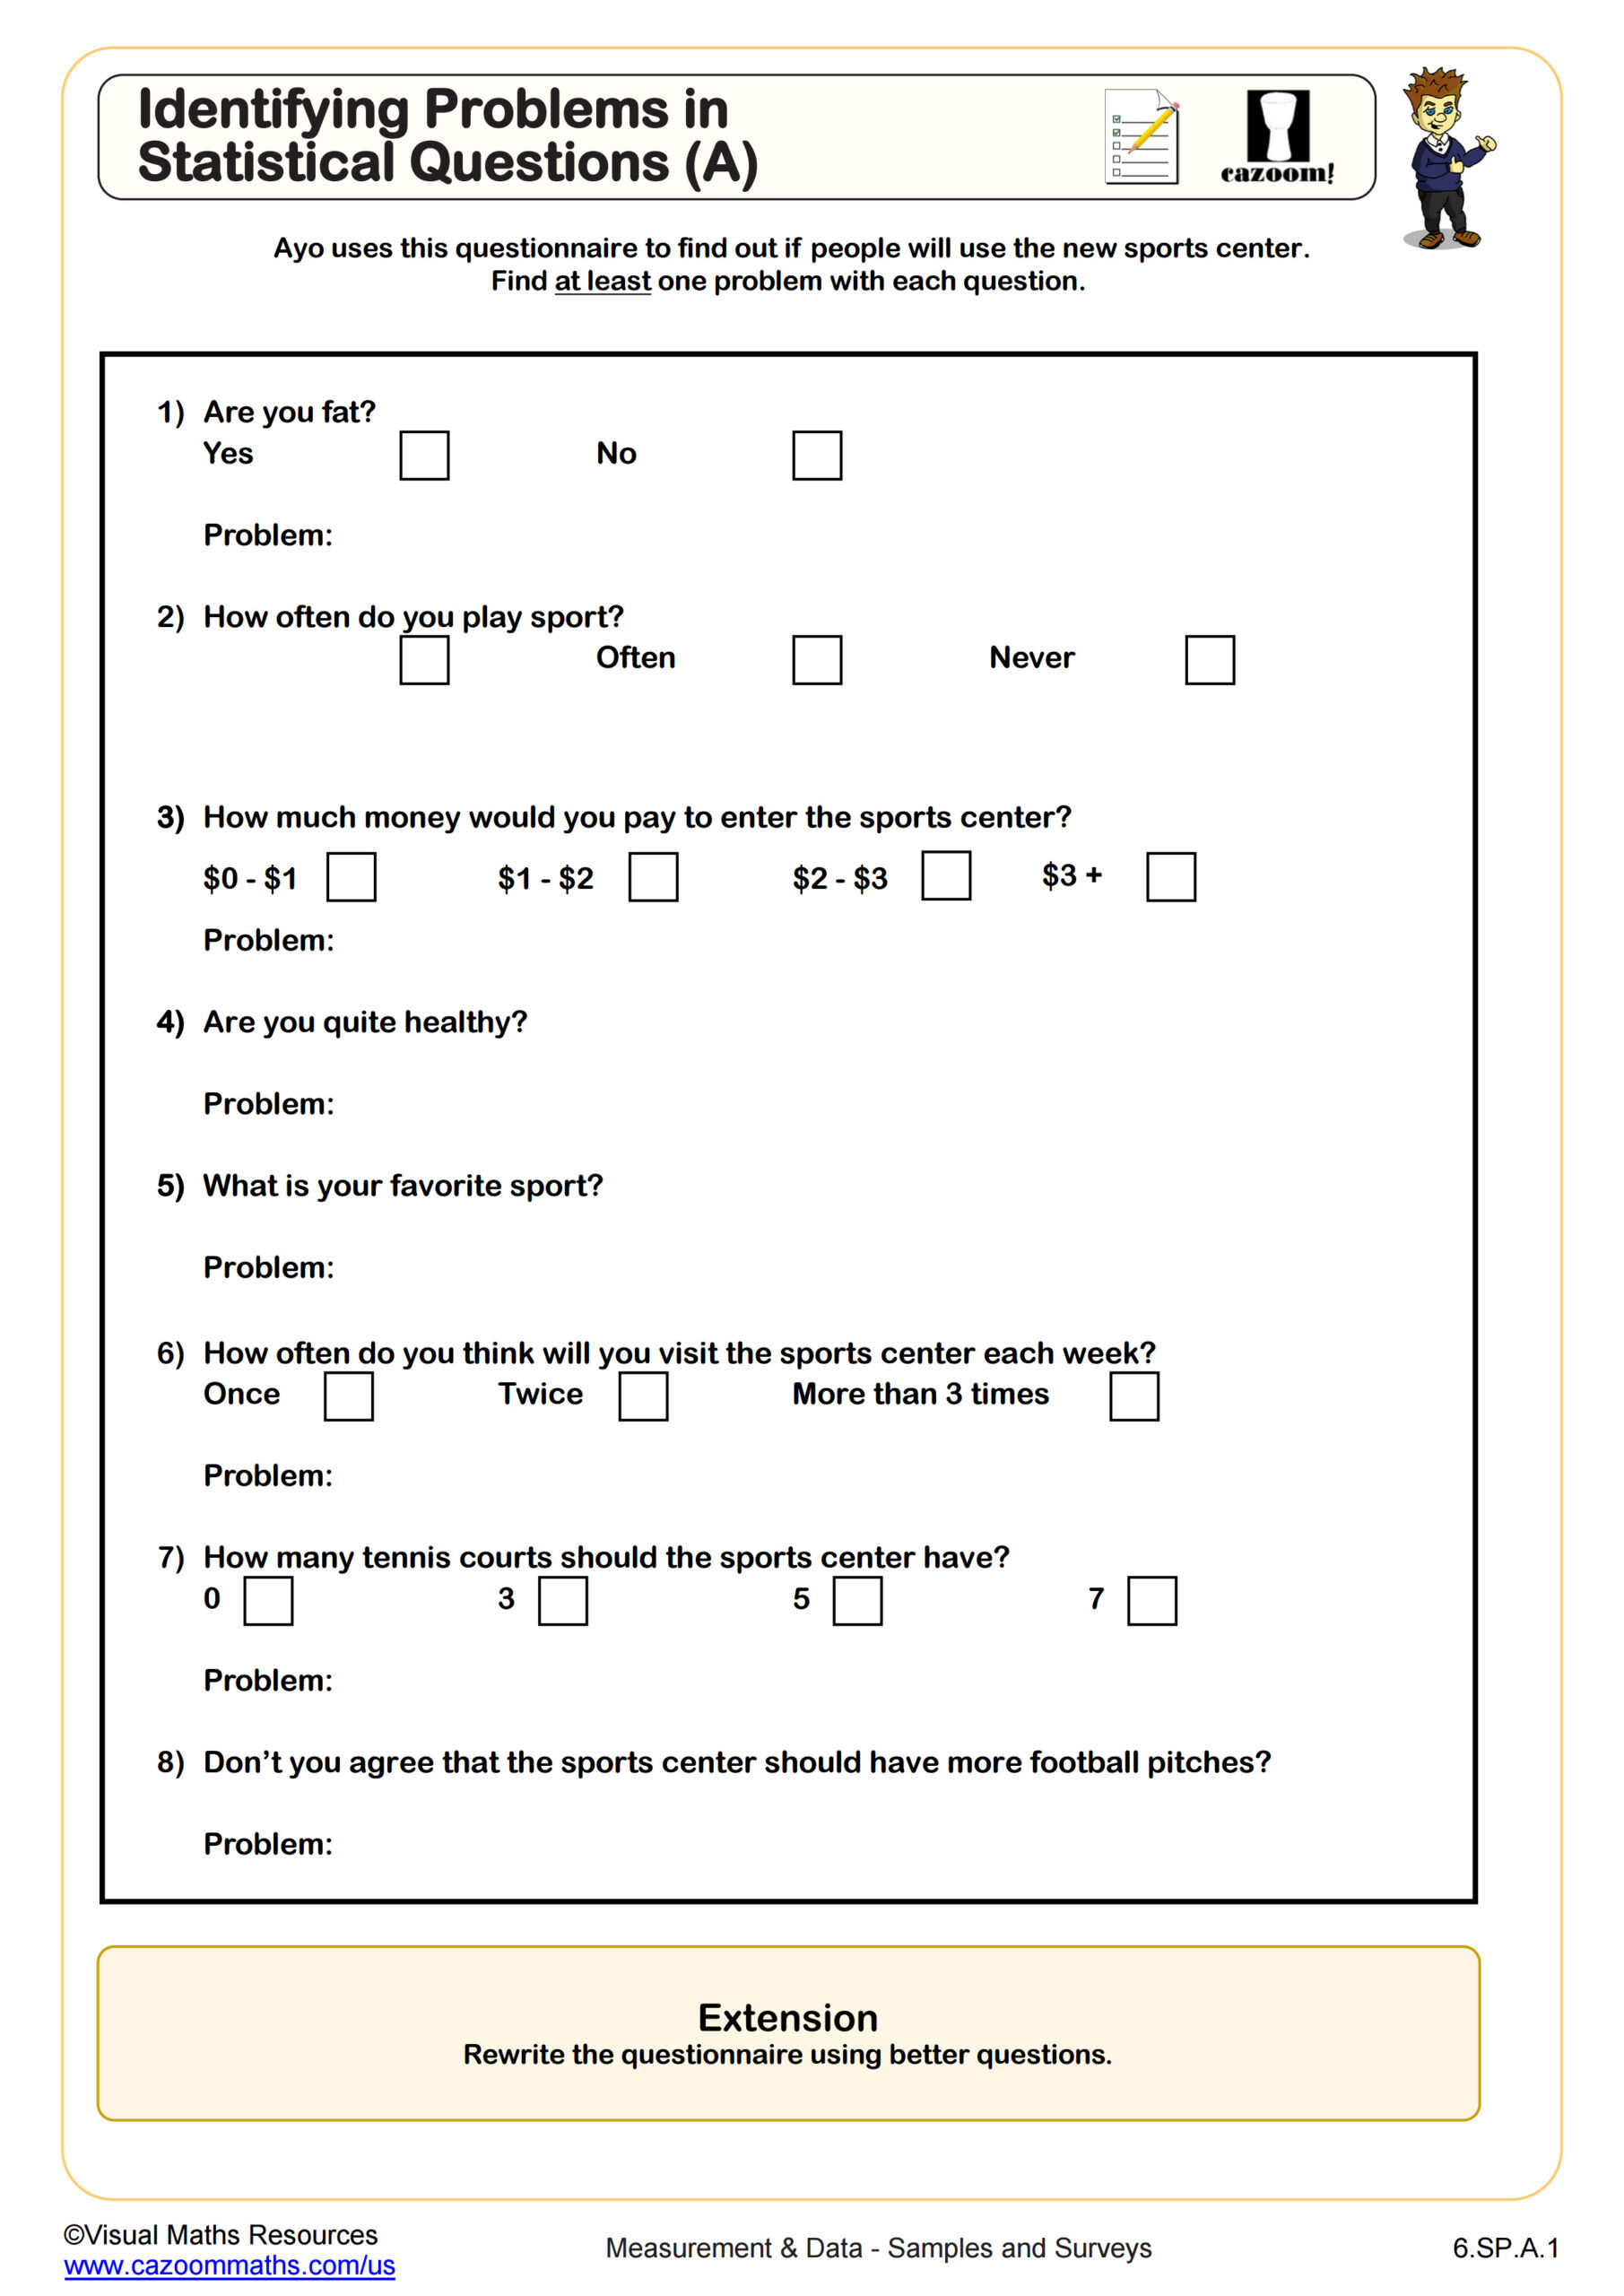
Identifying Problems in Statistical Questions (A)
Grades: 6th Grade
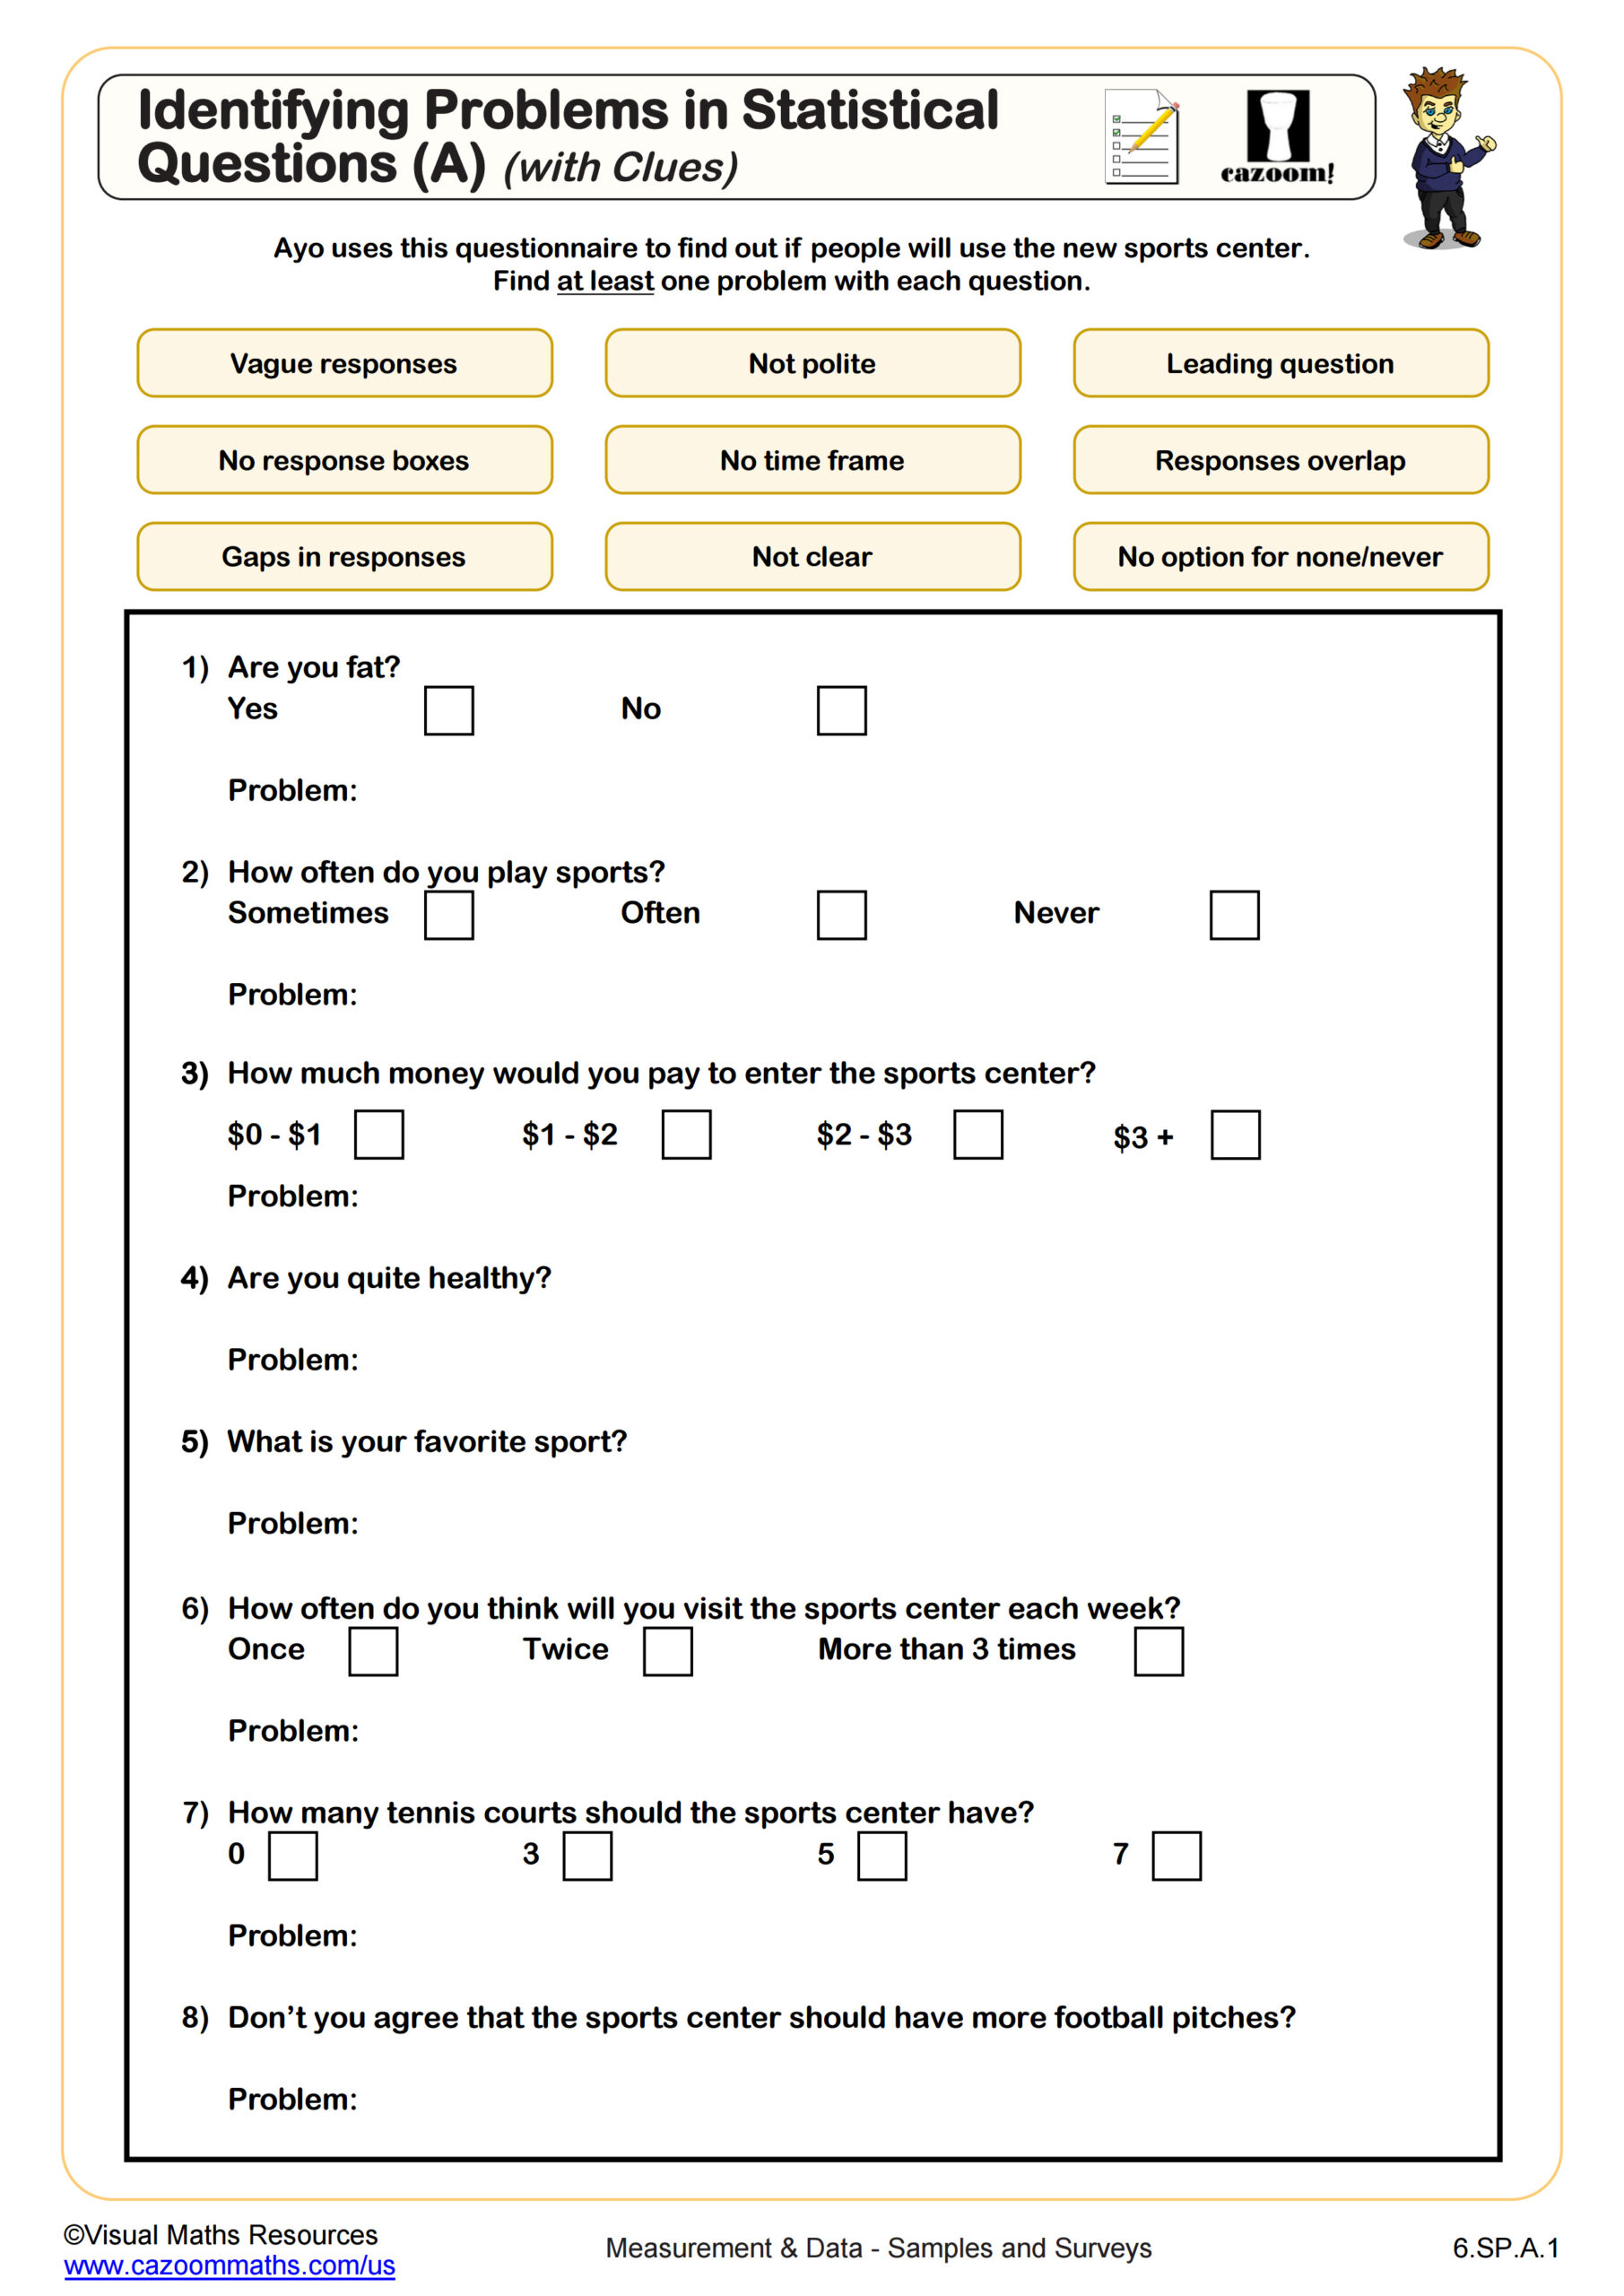
Identifying Problems in Statistical Questions (A) (With Clues)
Grades: 6th Grade
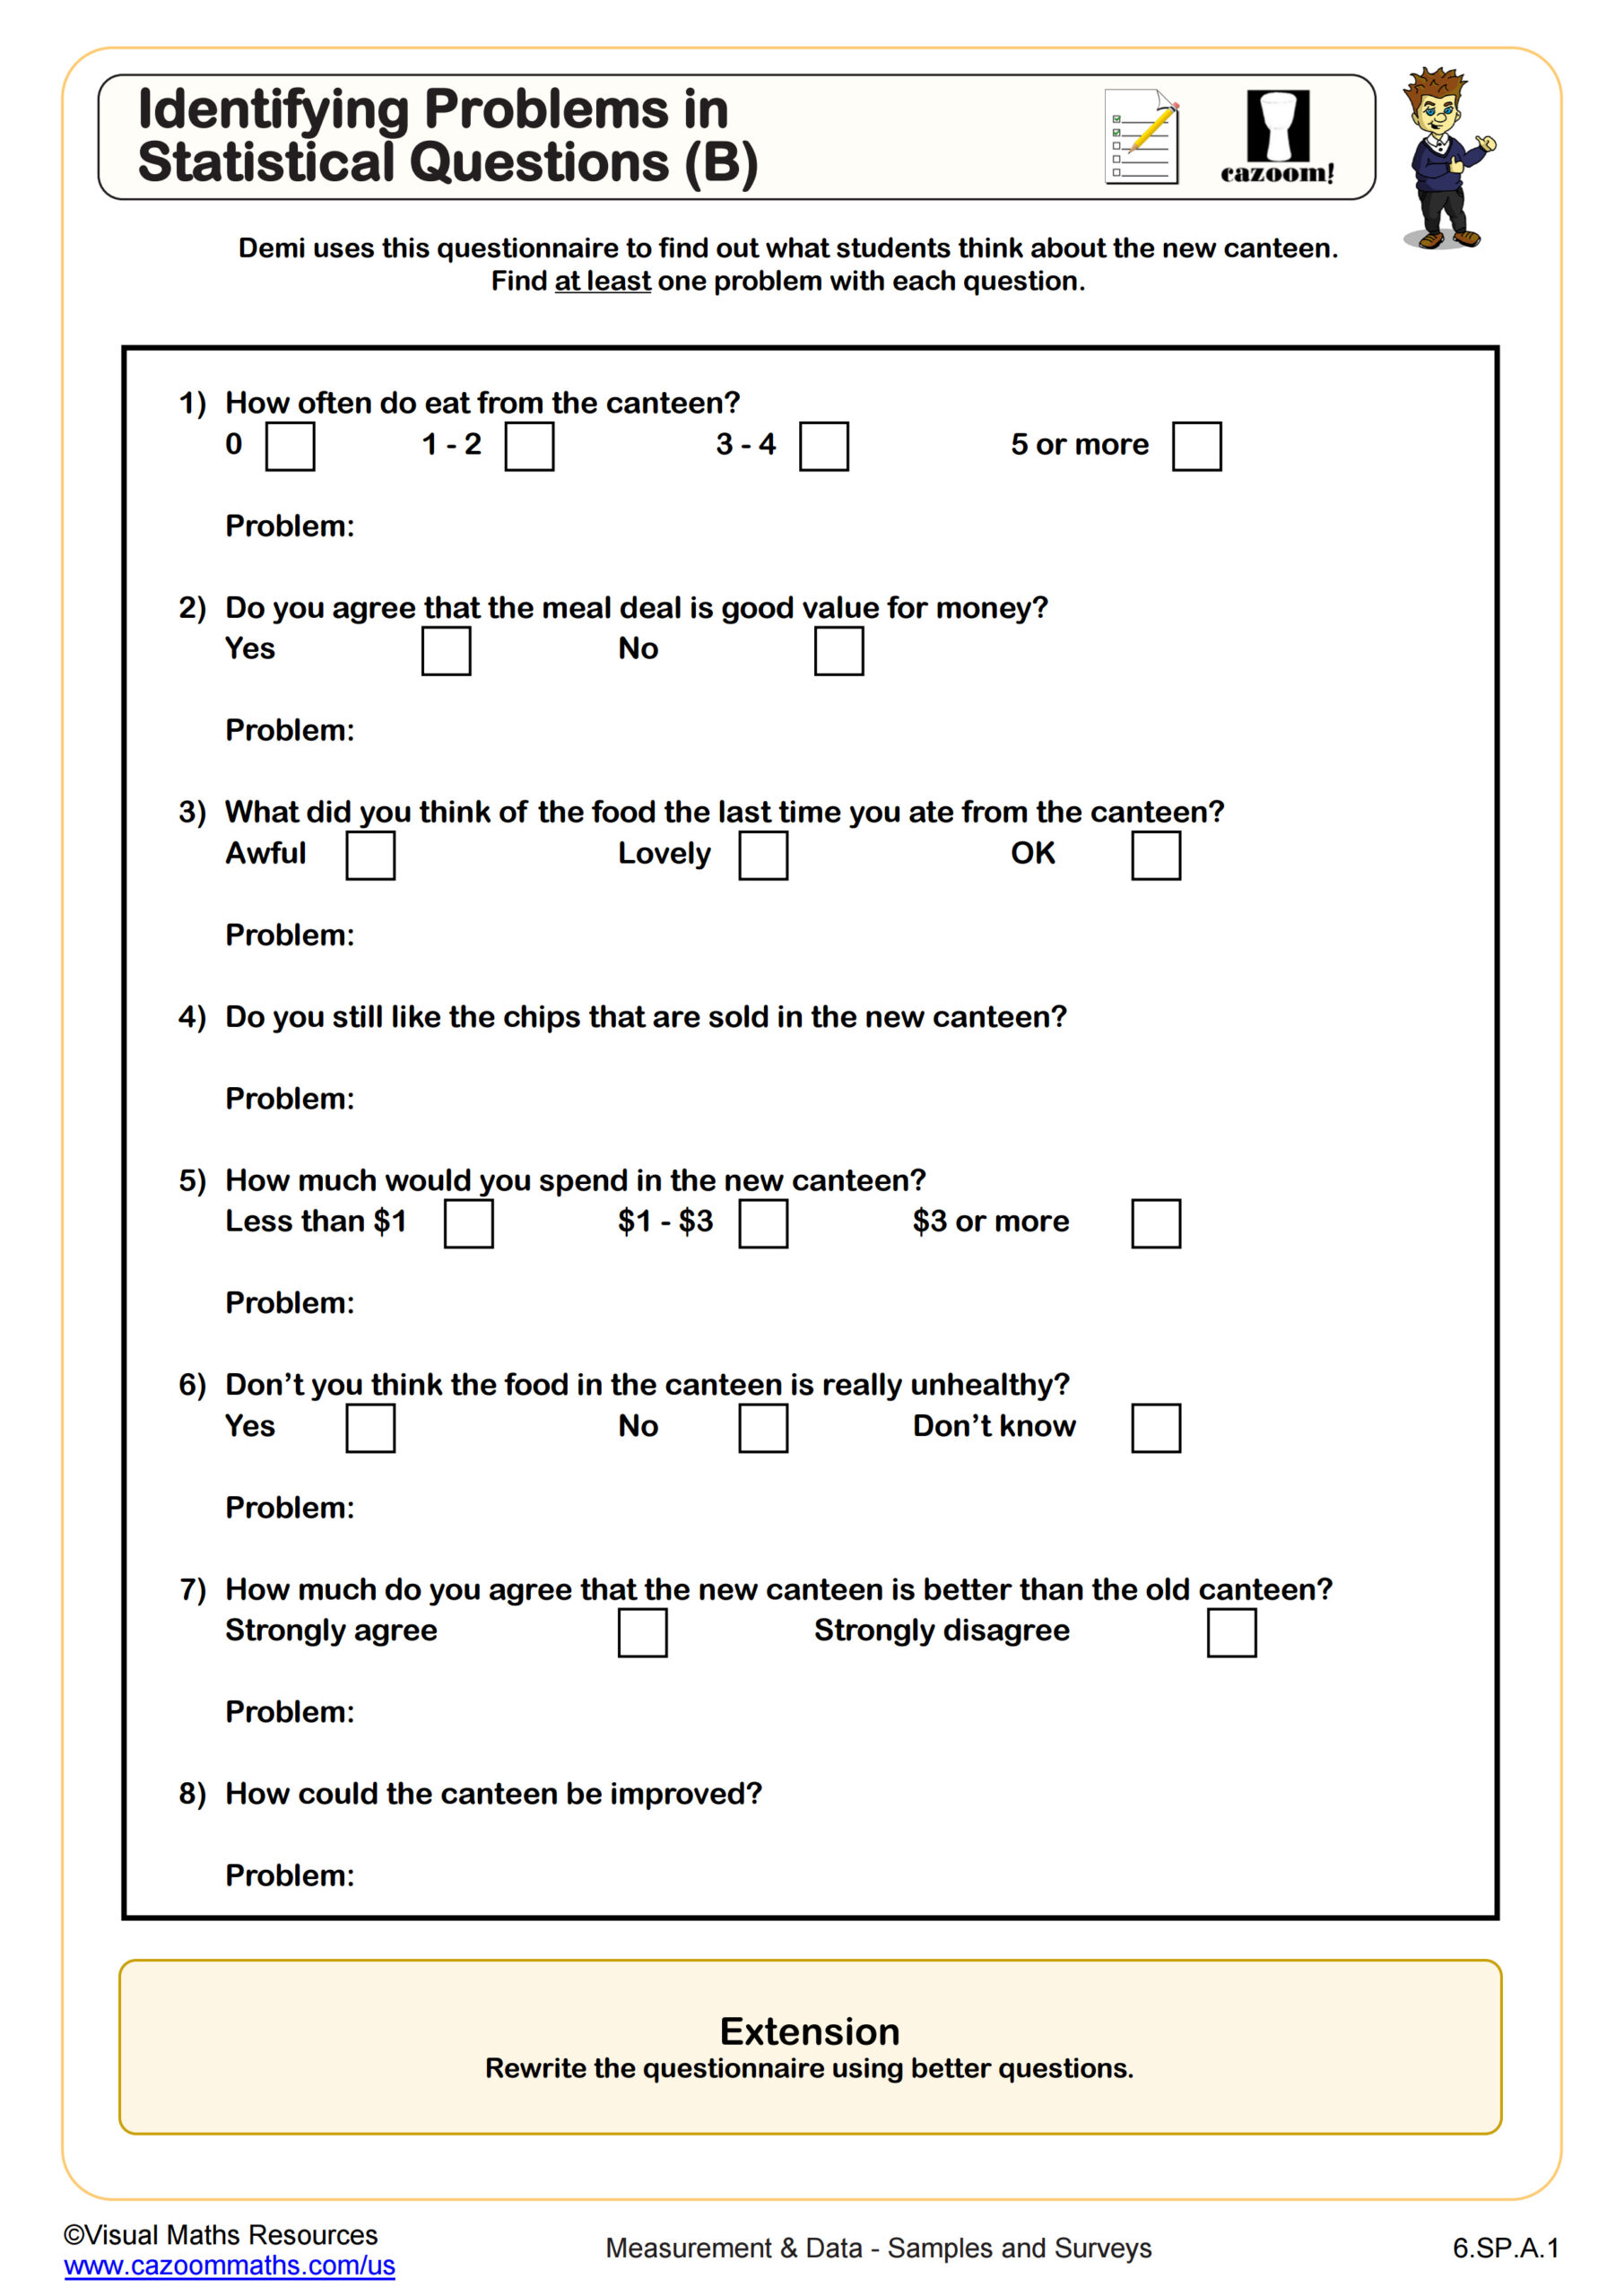
Identifying Problems in Statistical Questions (B)
Grades: 6th Grade
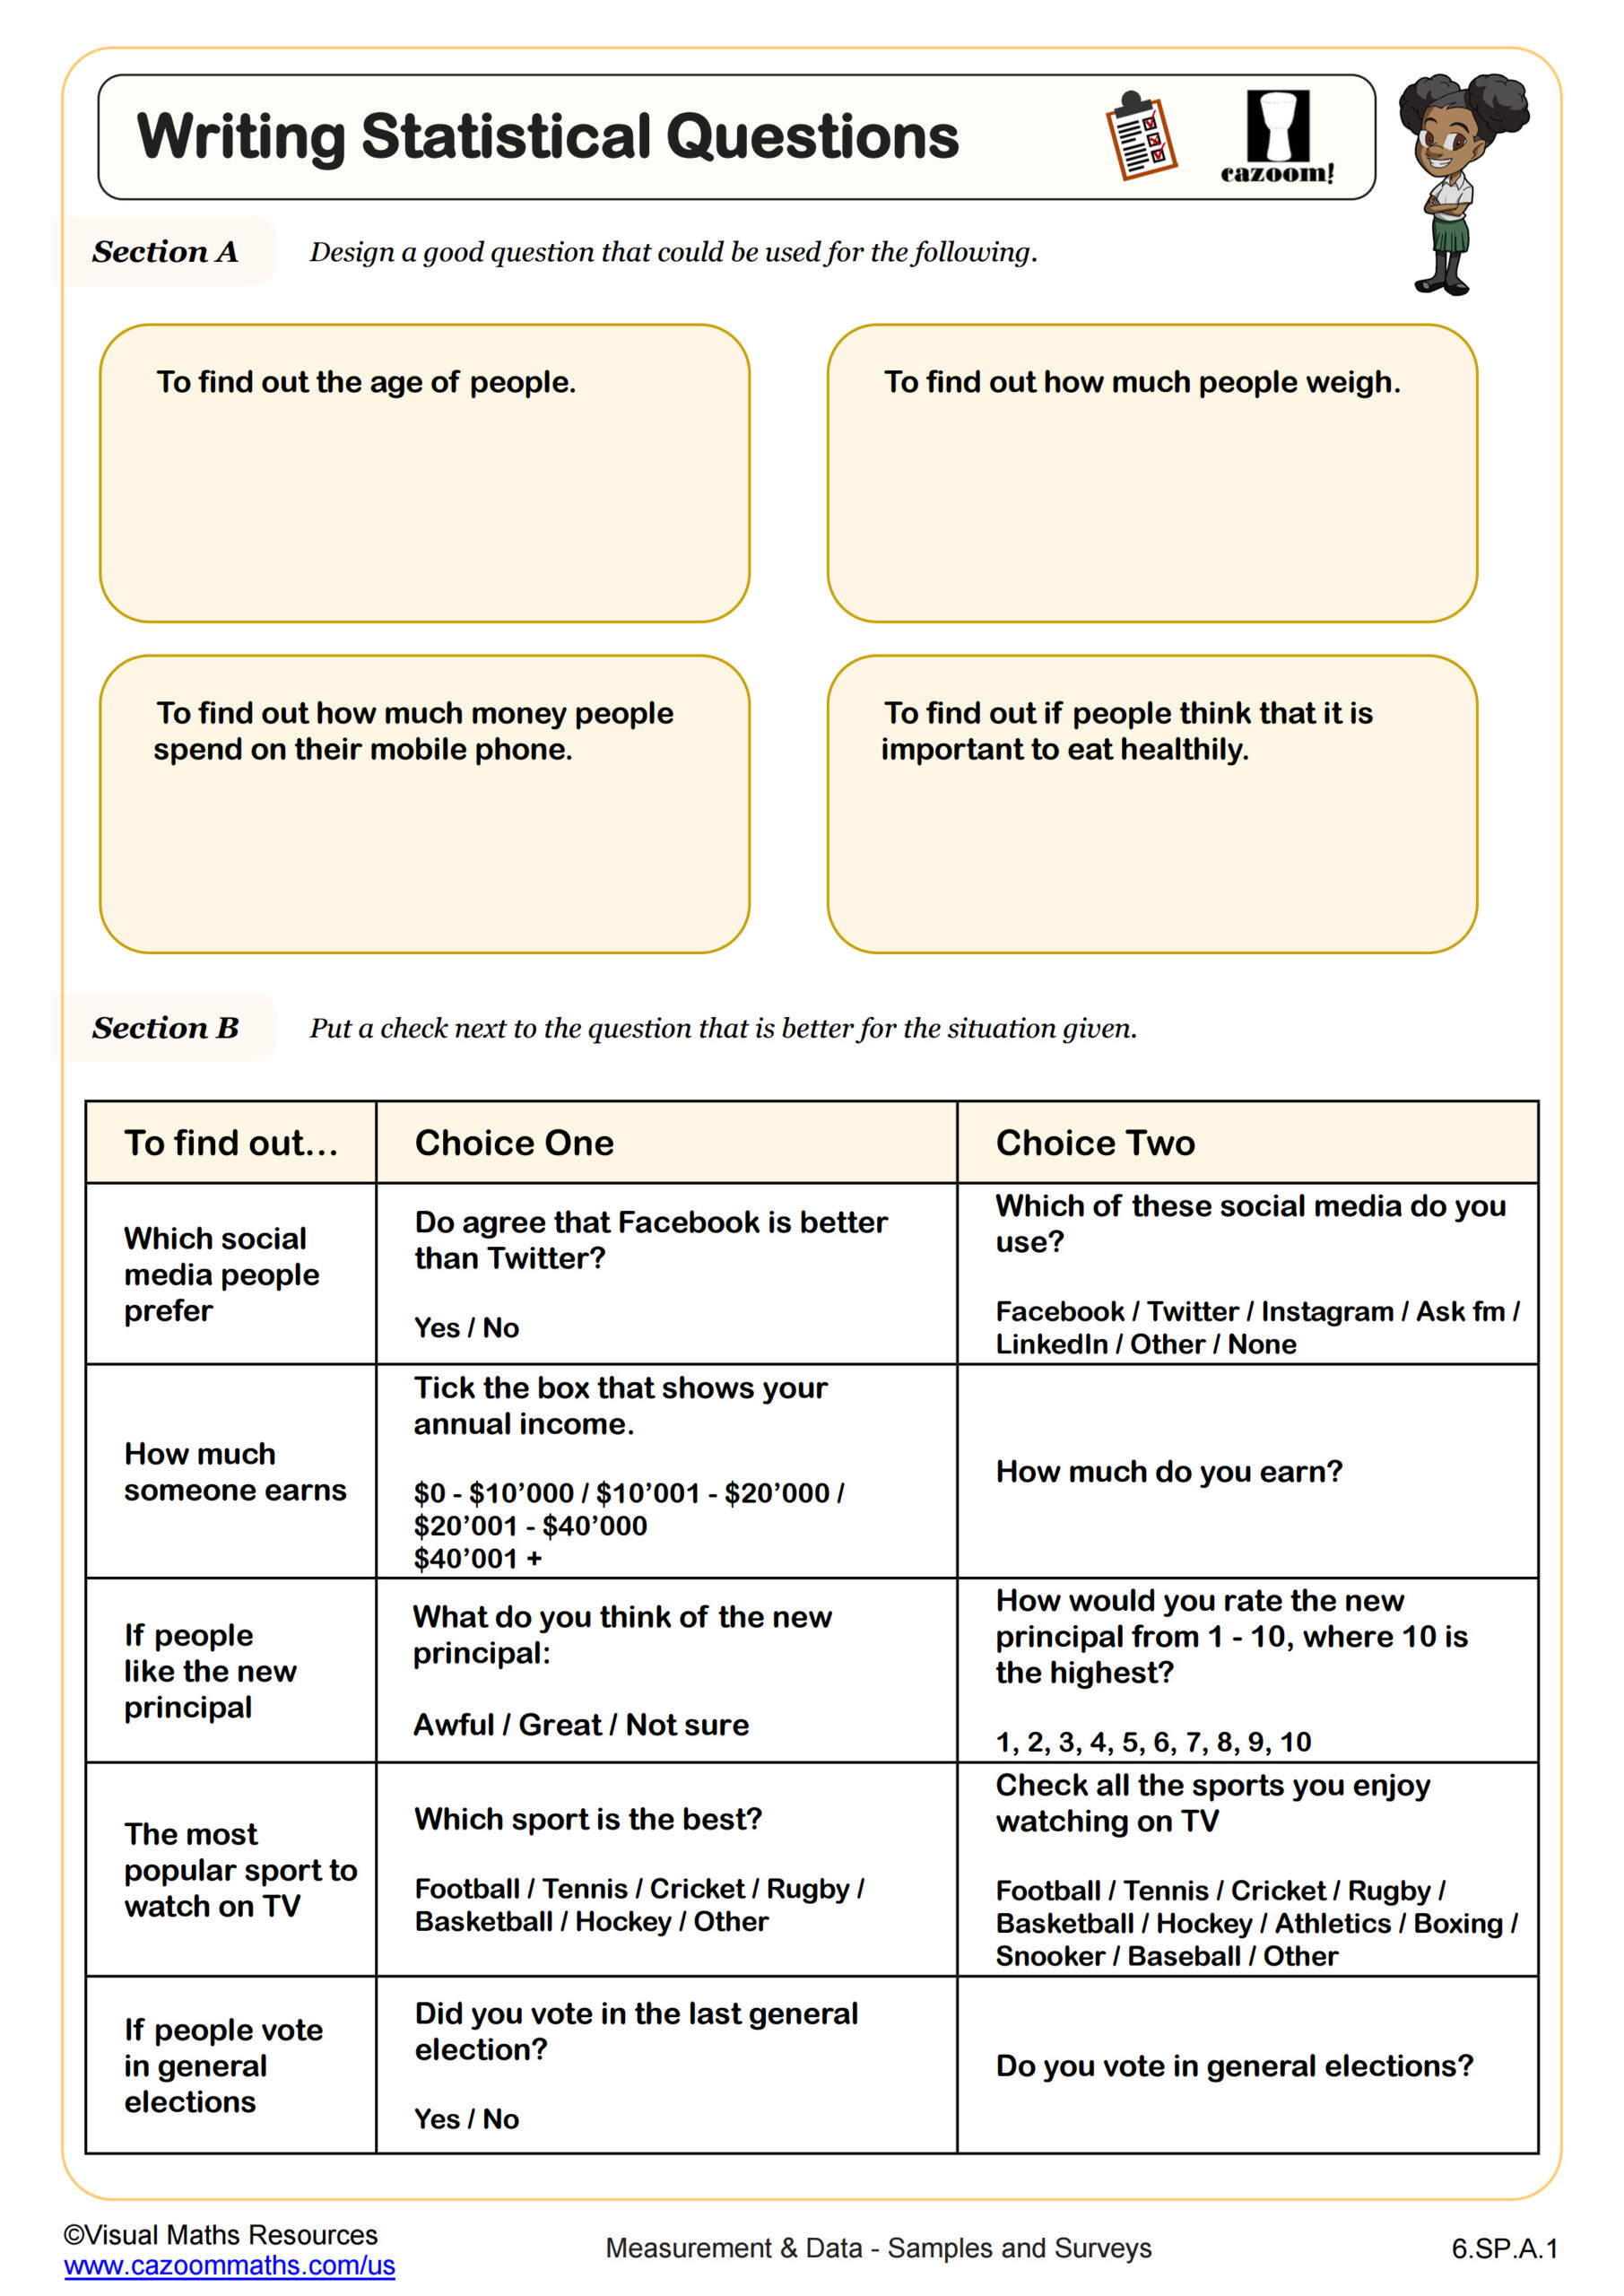
Writing Statistical Questions
Grades: 6th Grade
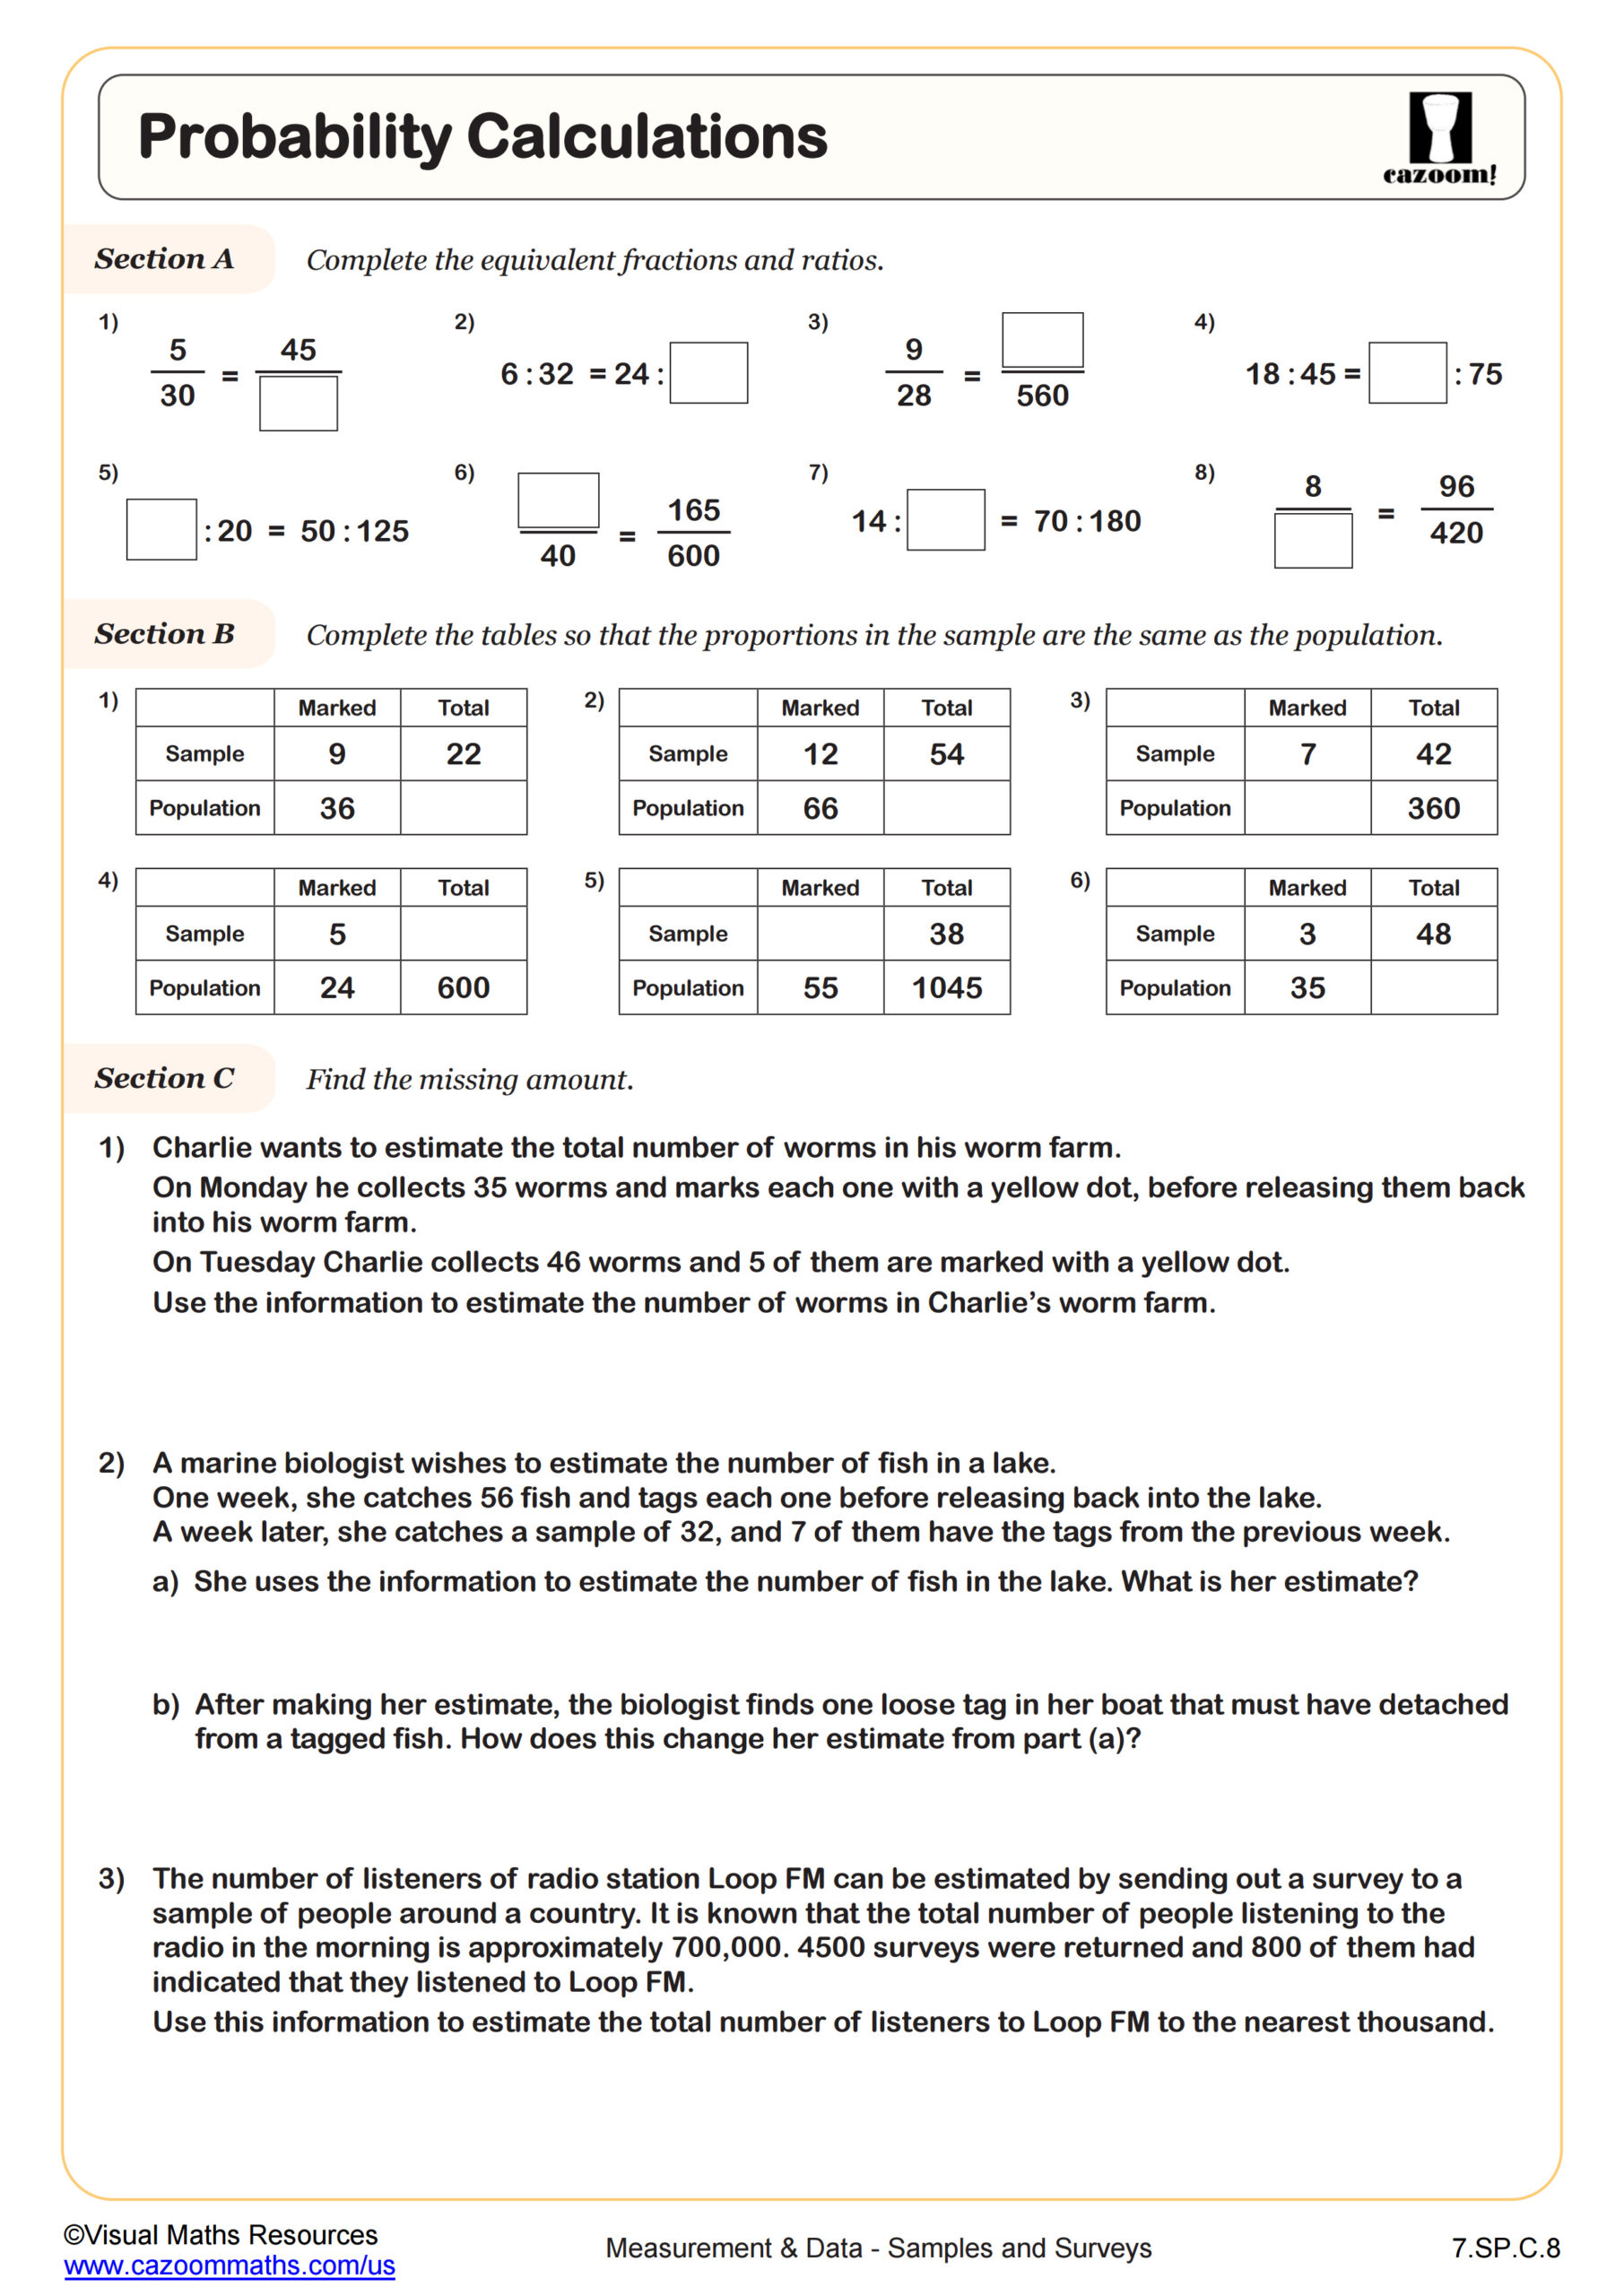
Probability Calculations
Grades: 7th Grade
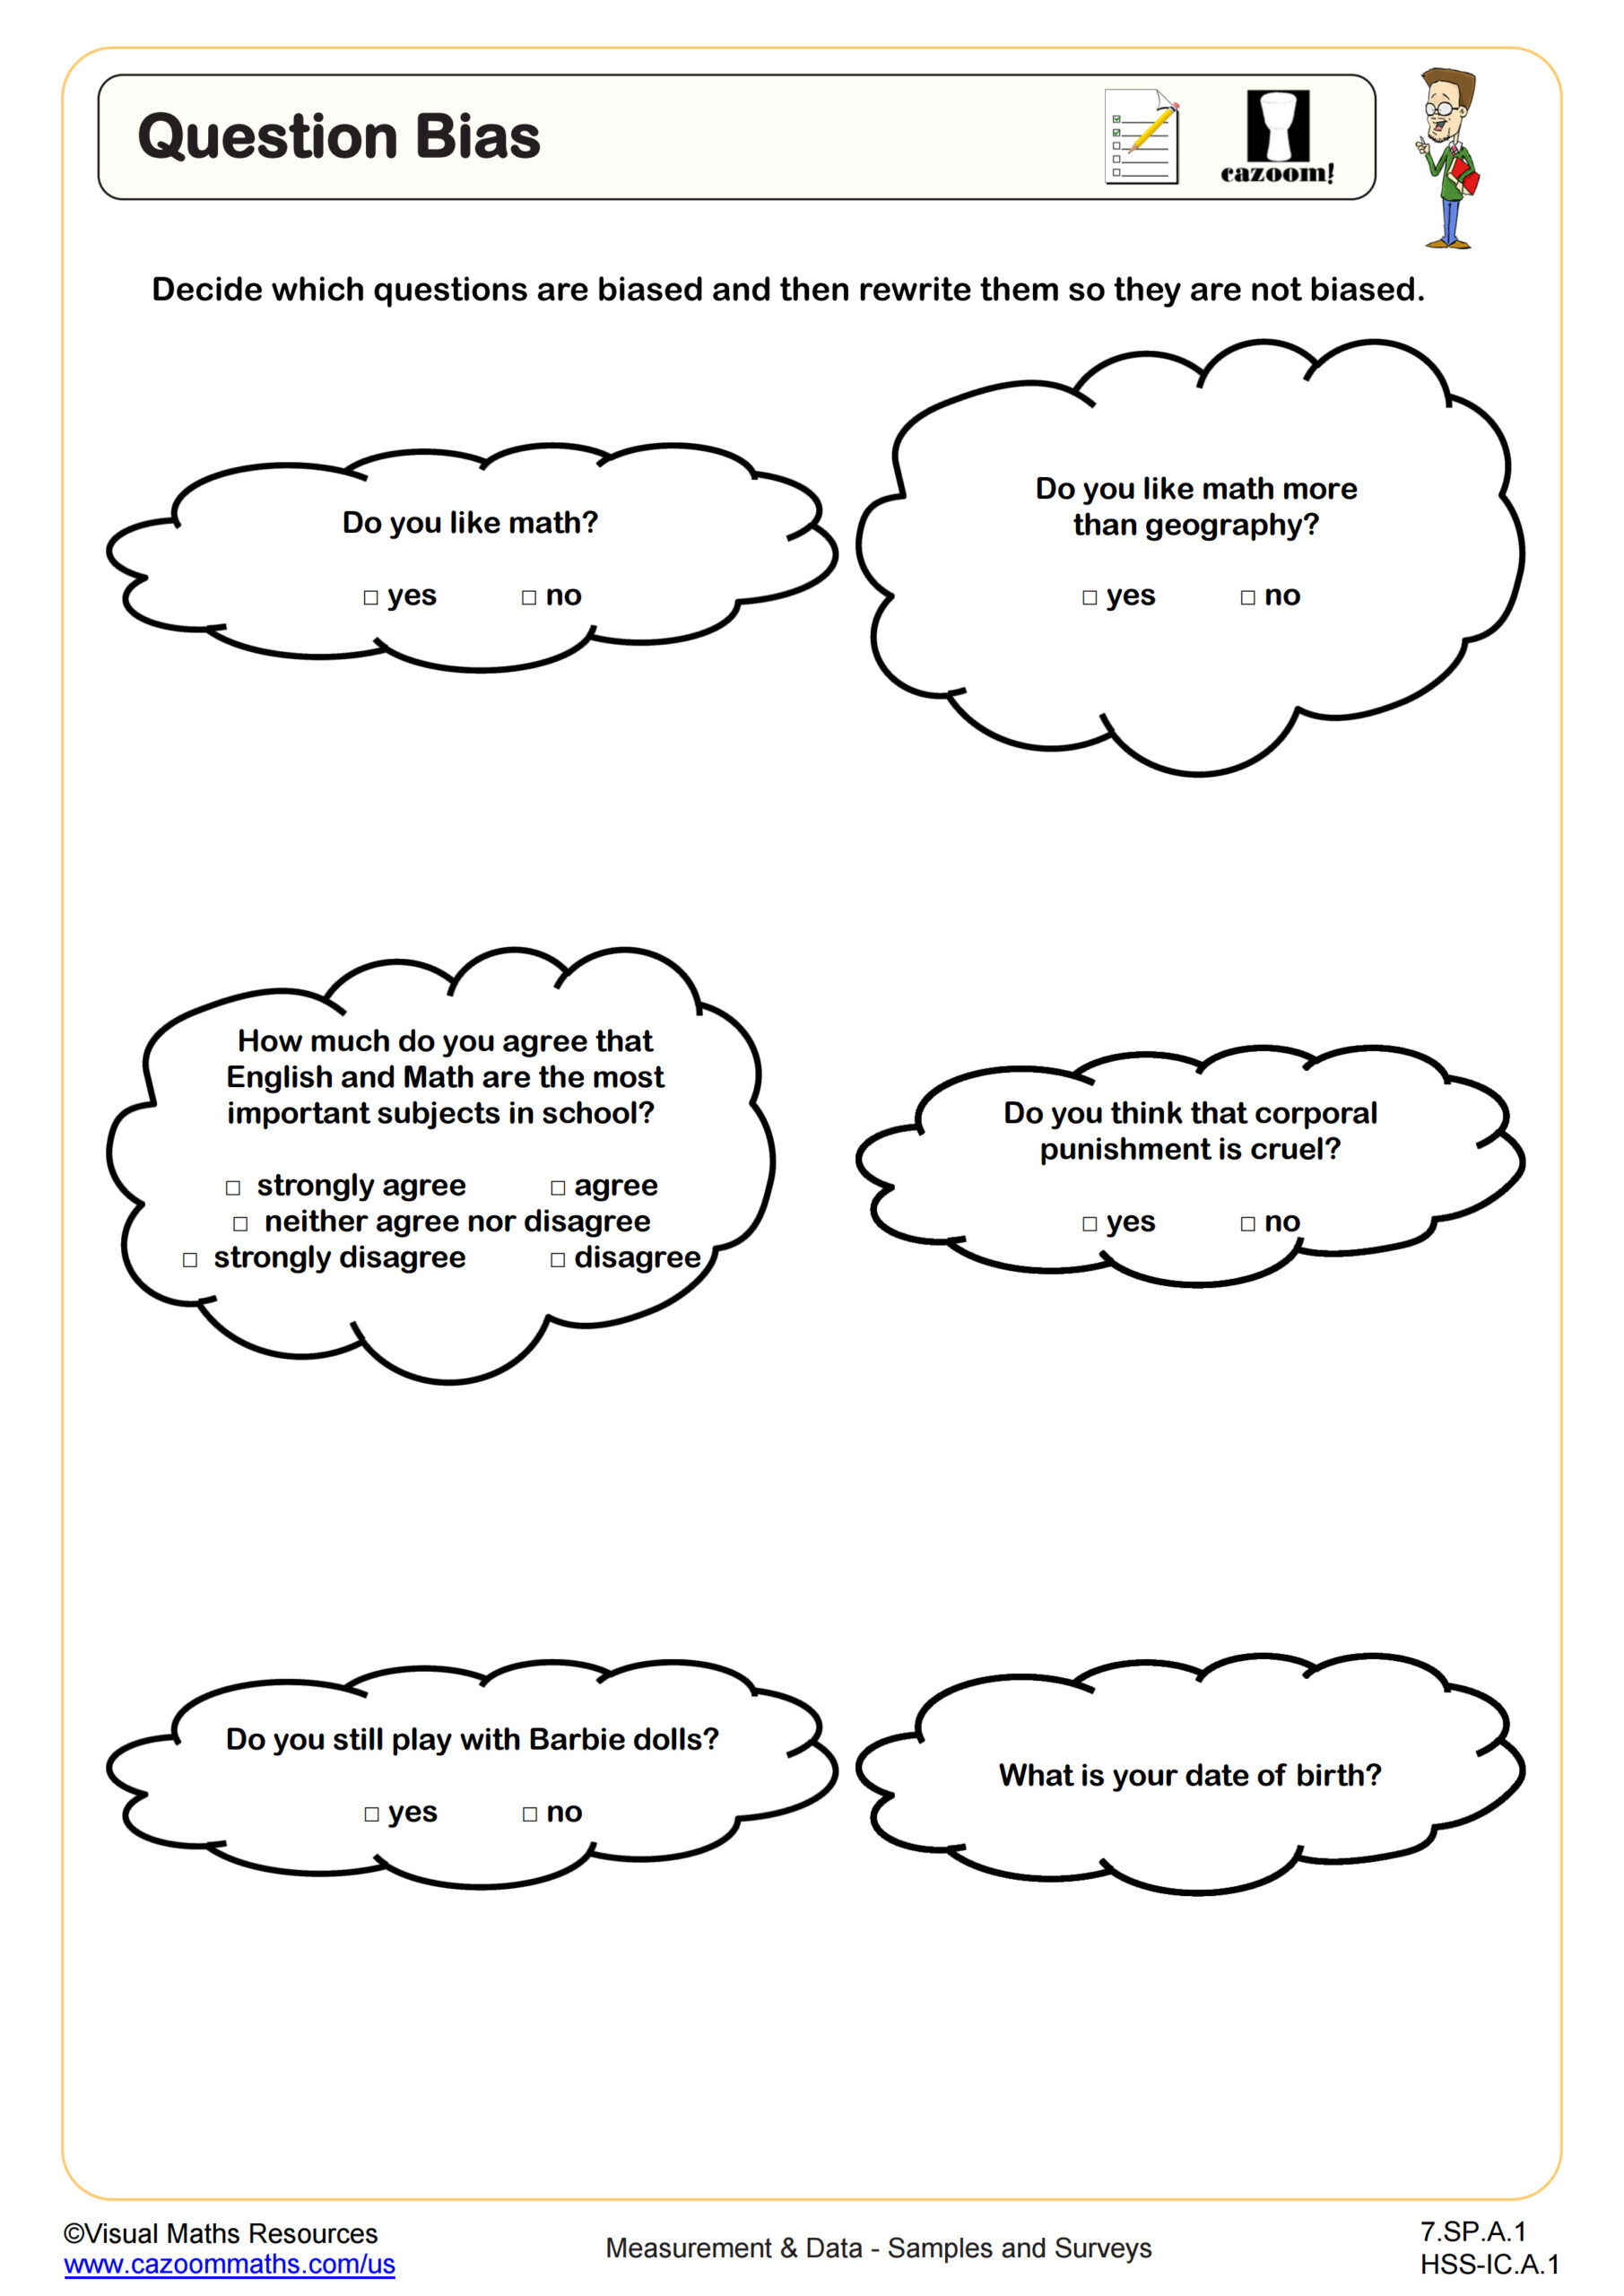
Question Bias
Grades: 7th Grade, Geometry
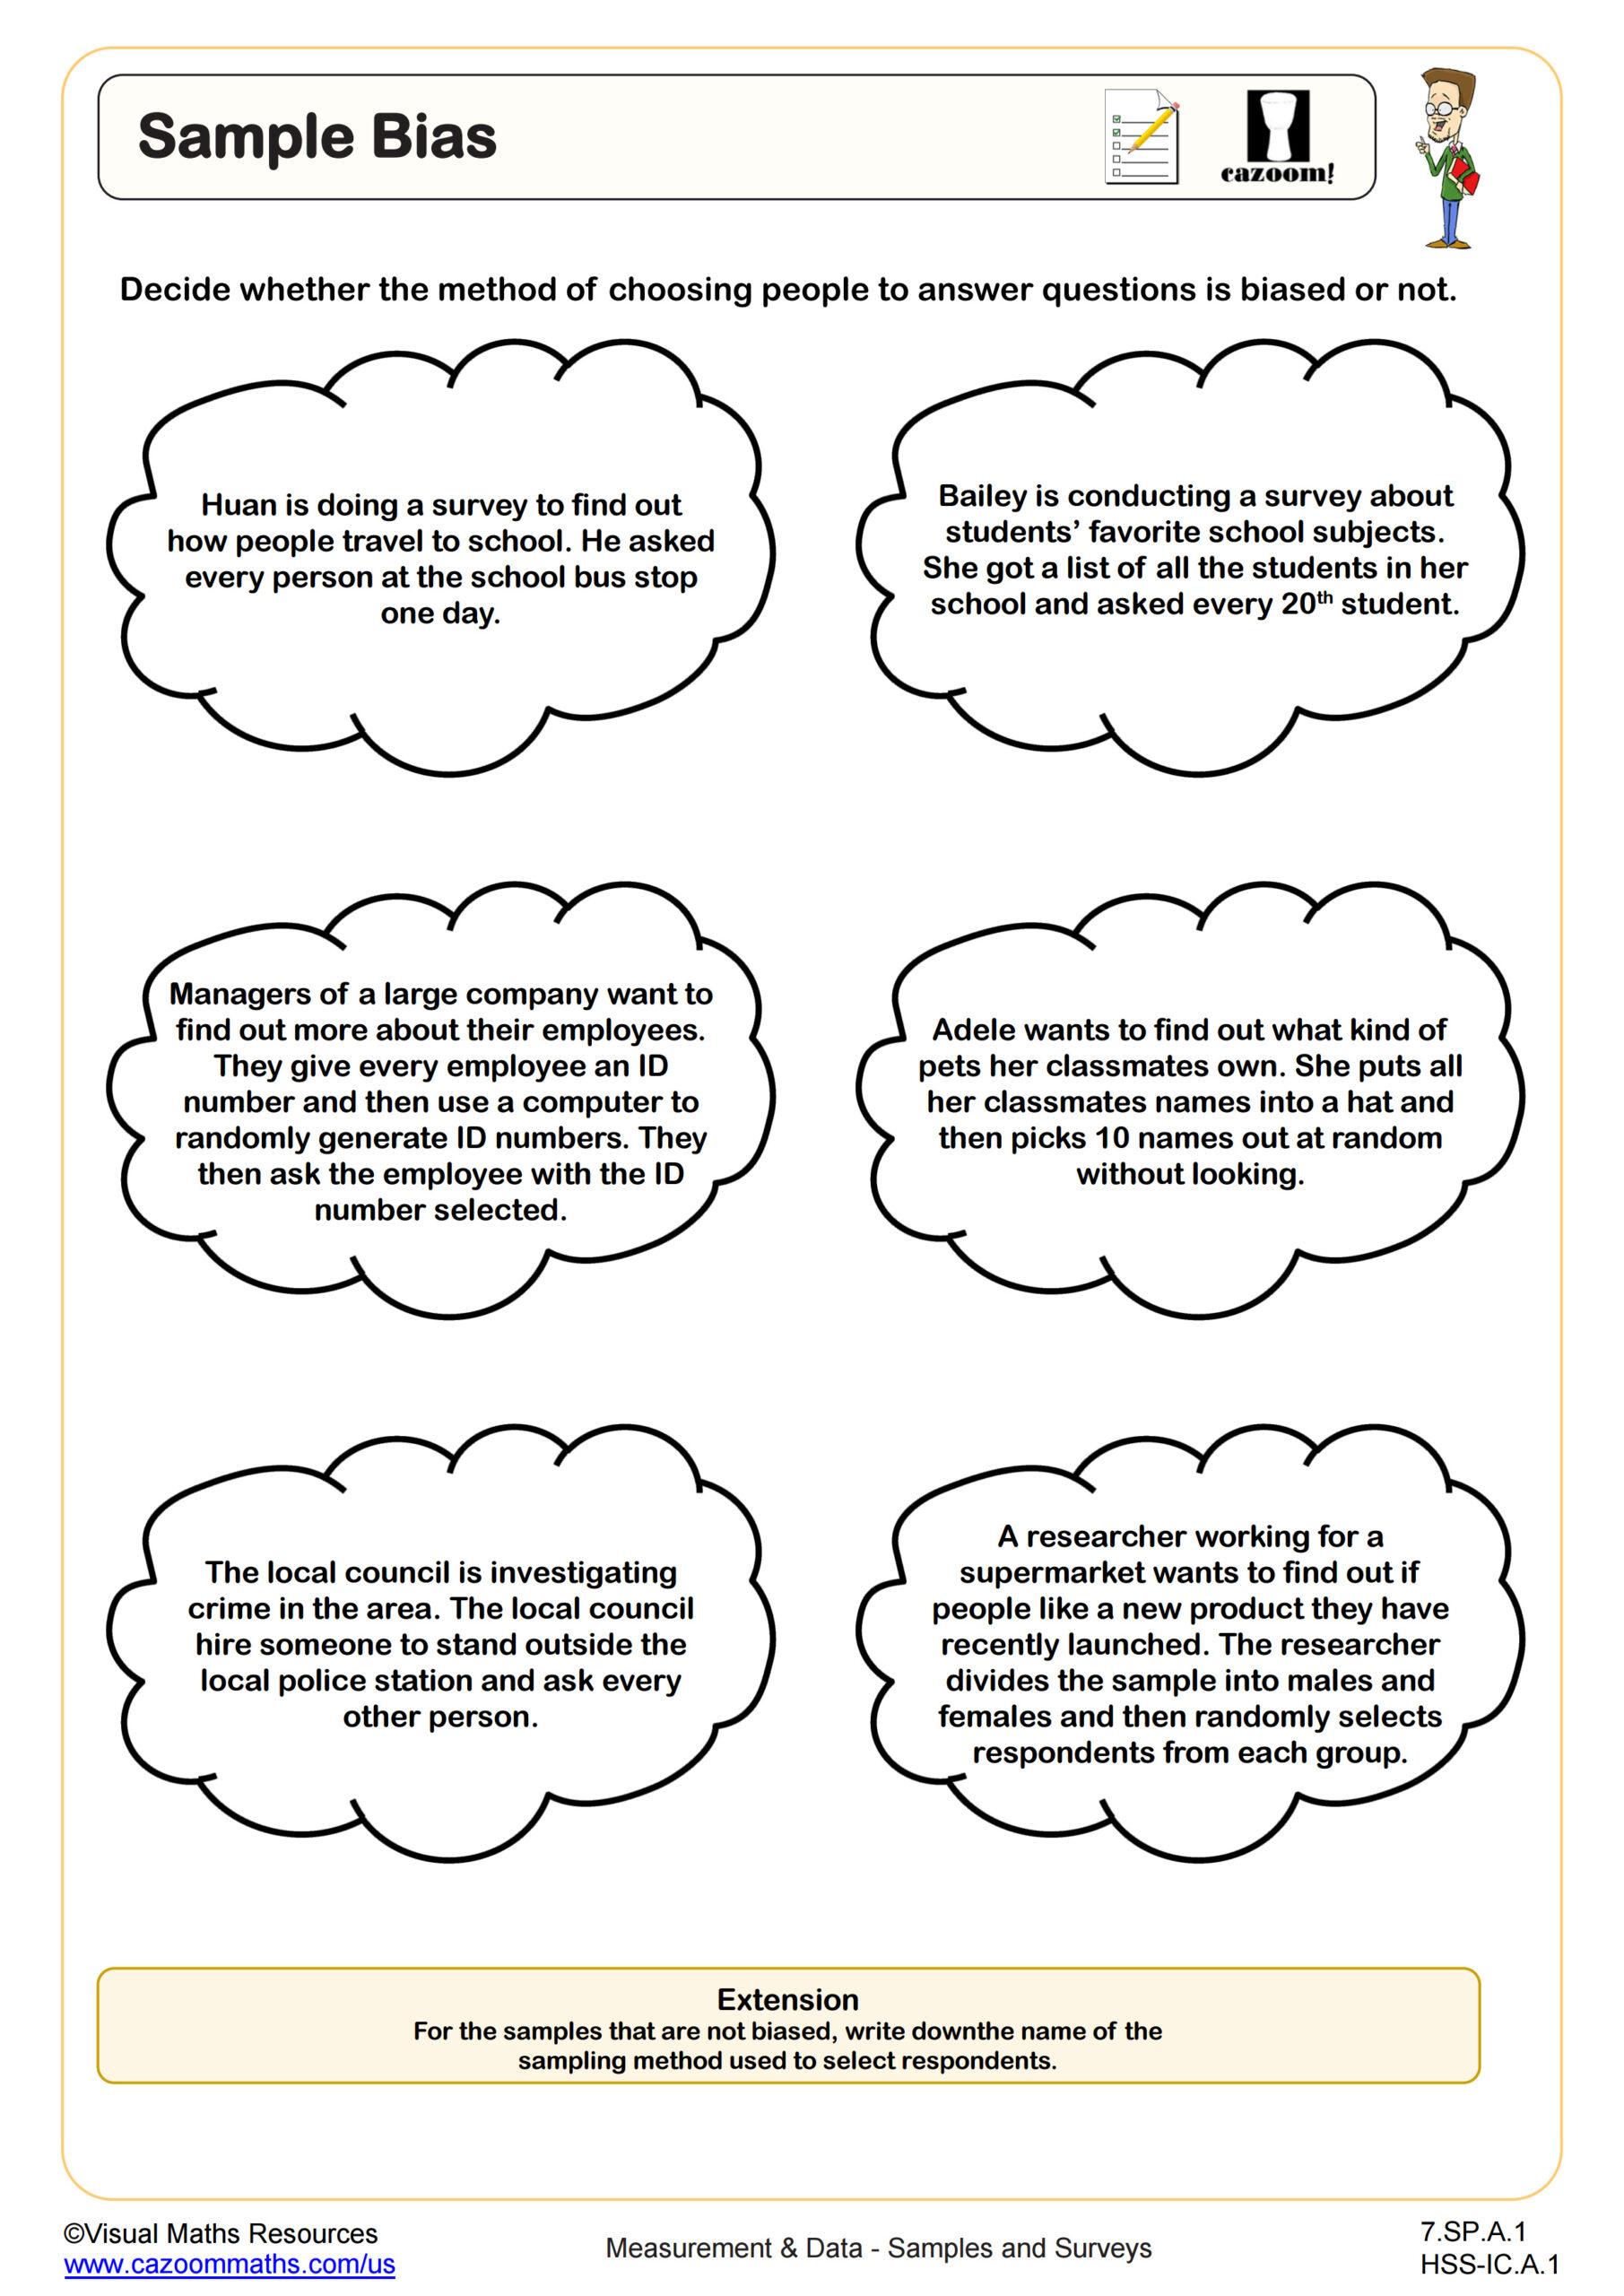
Sample Bias
Grades: 7th Grade, Geometry
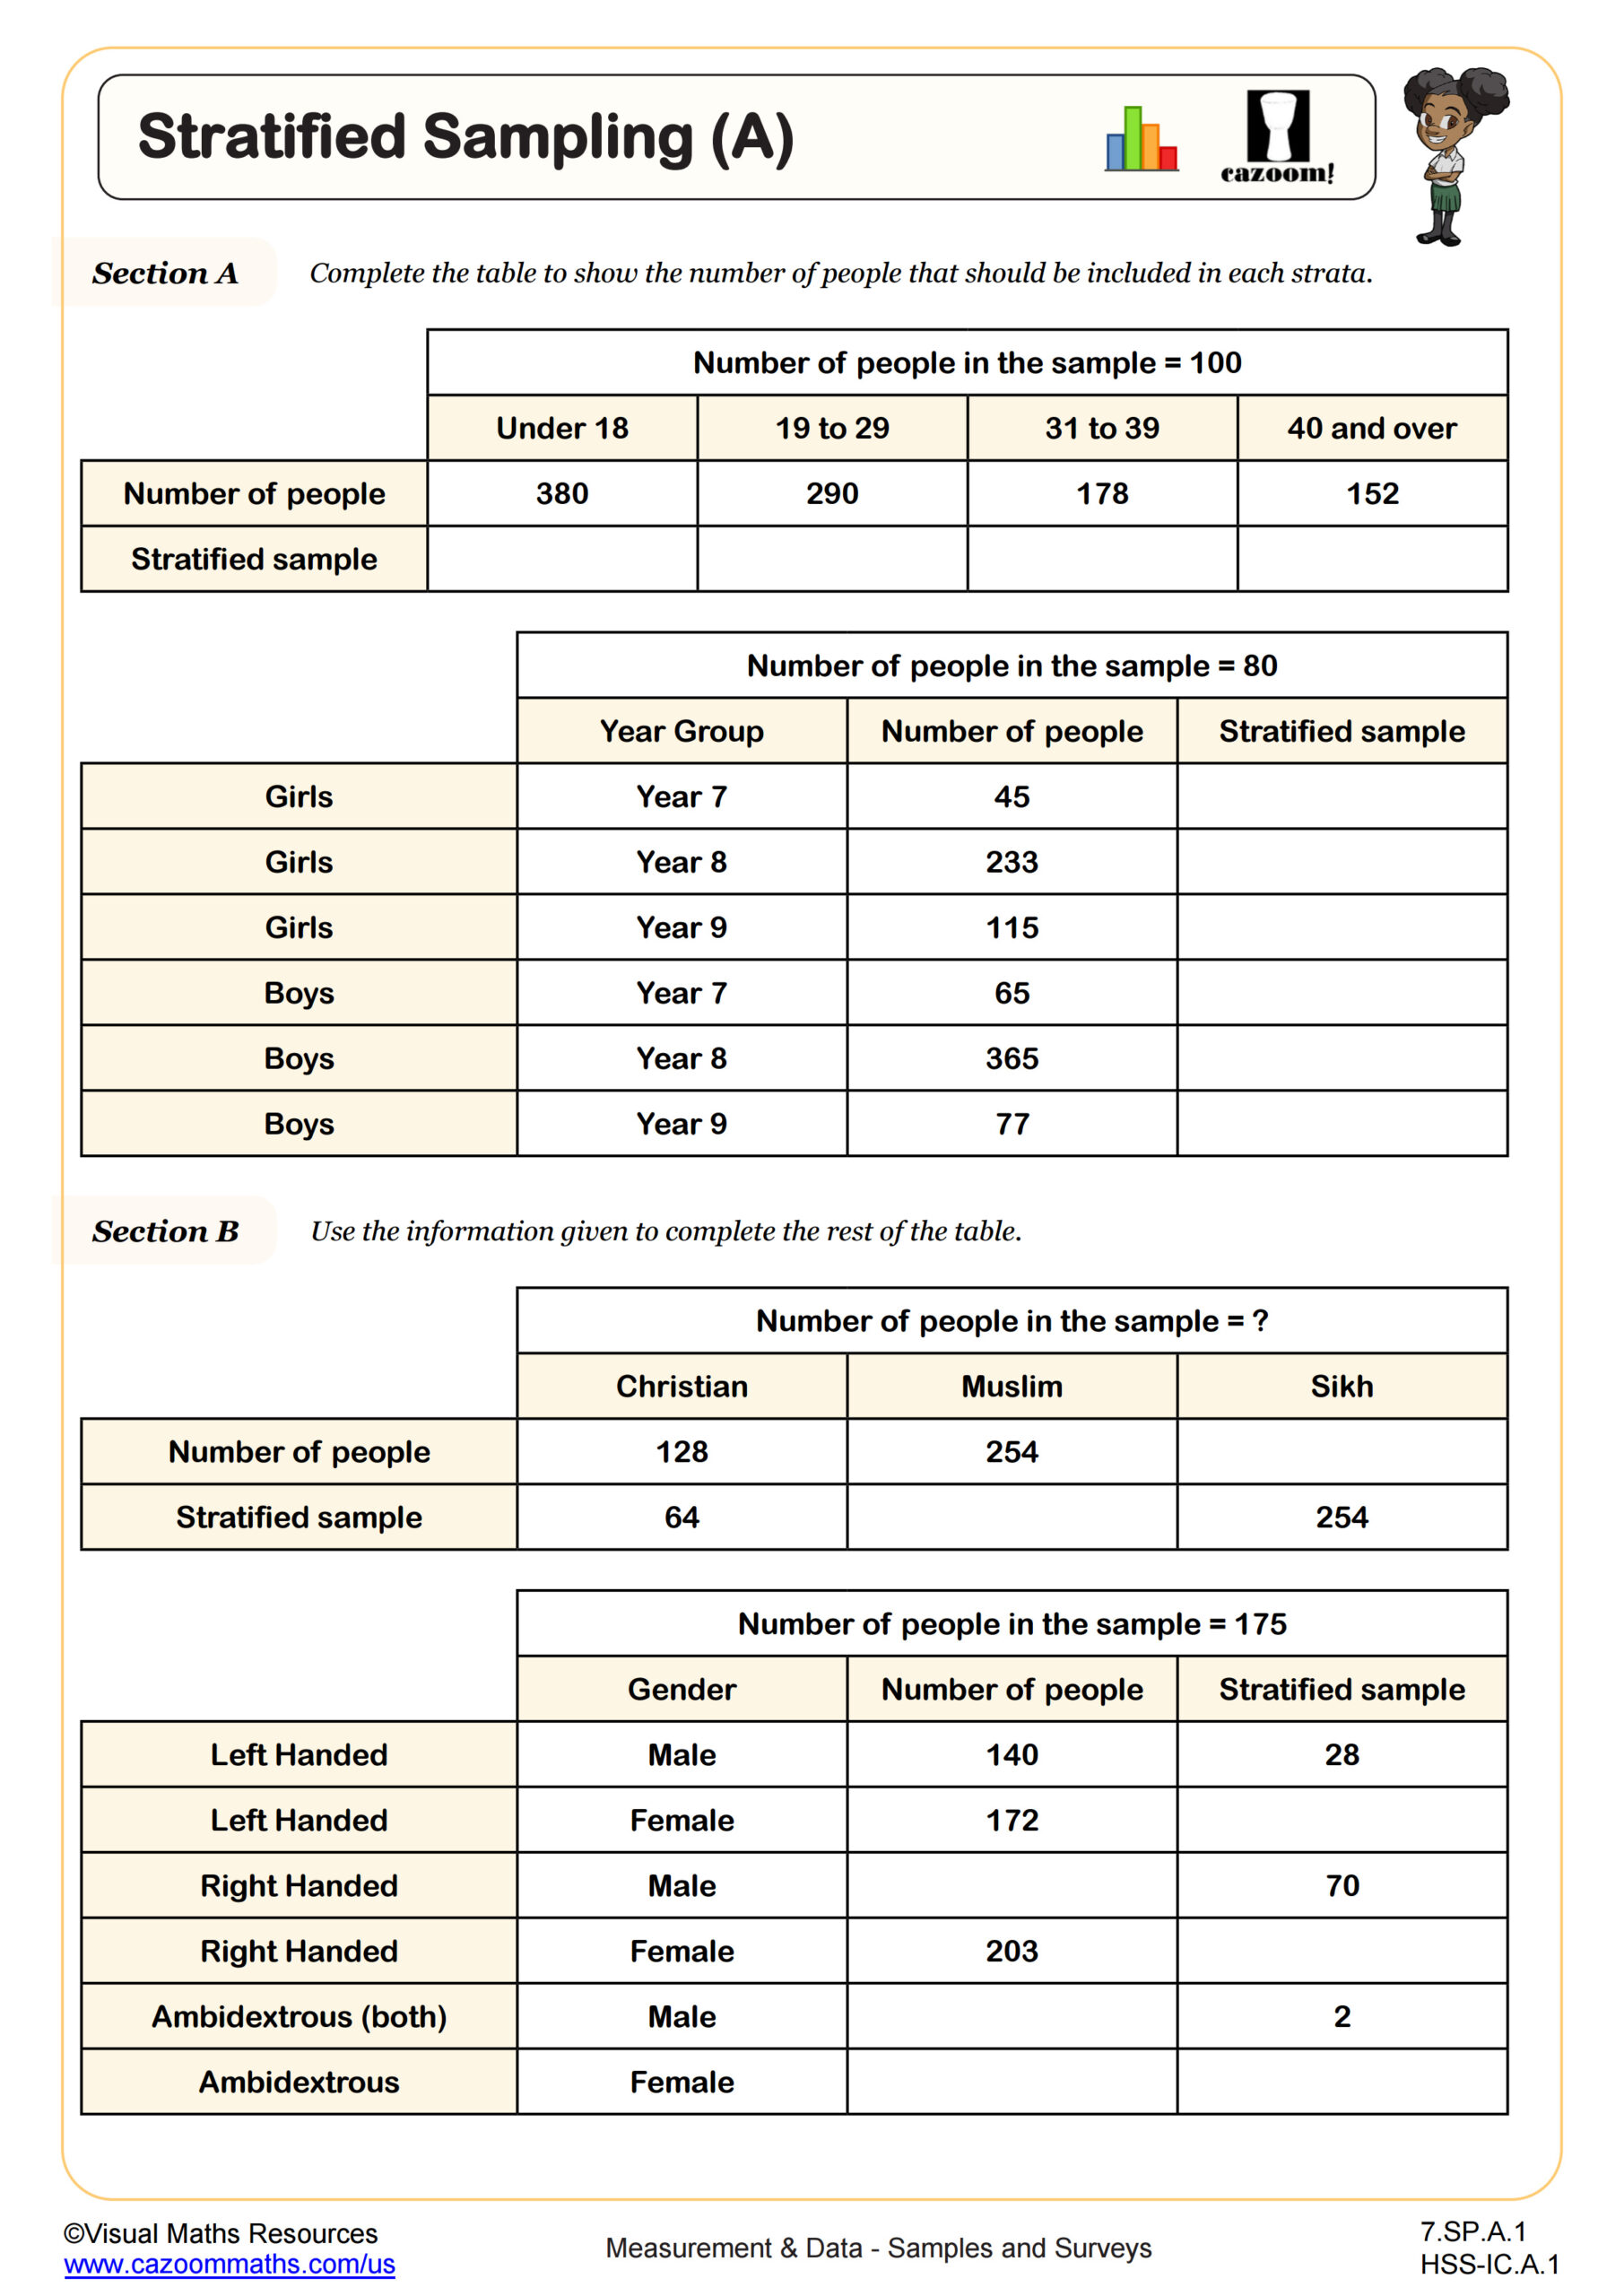
Stratified Sampling (A)
Grades: 7th Grade, Geometry
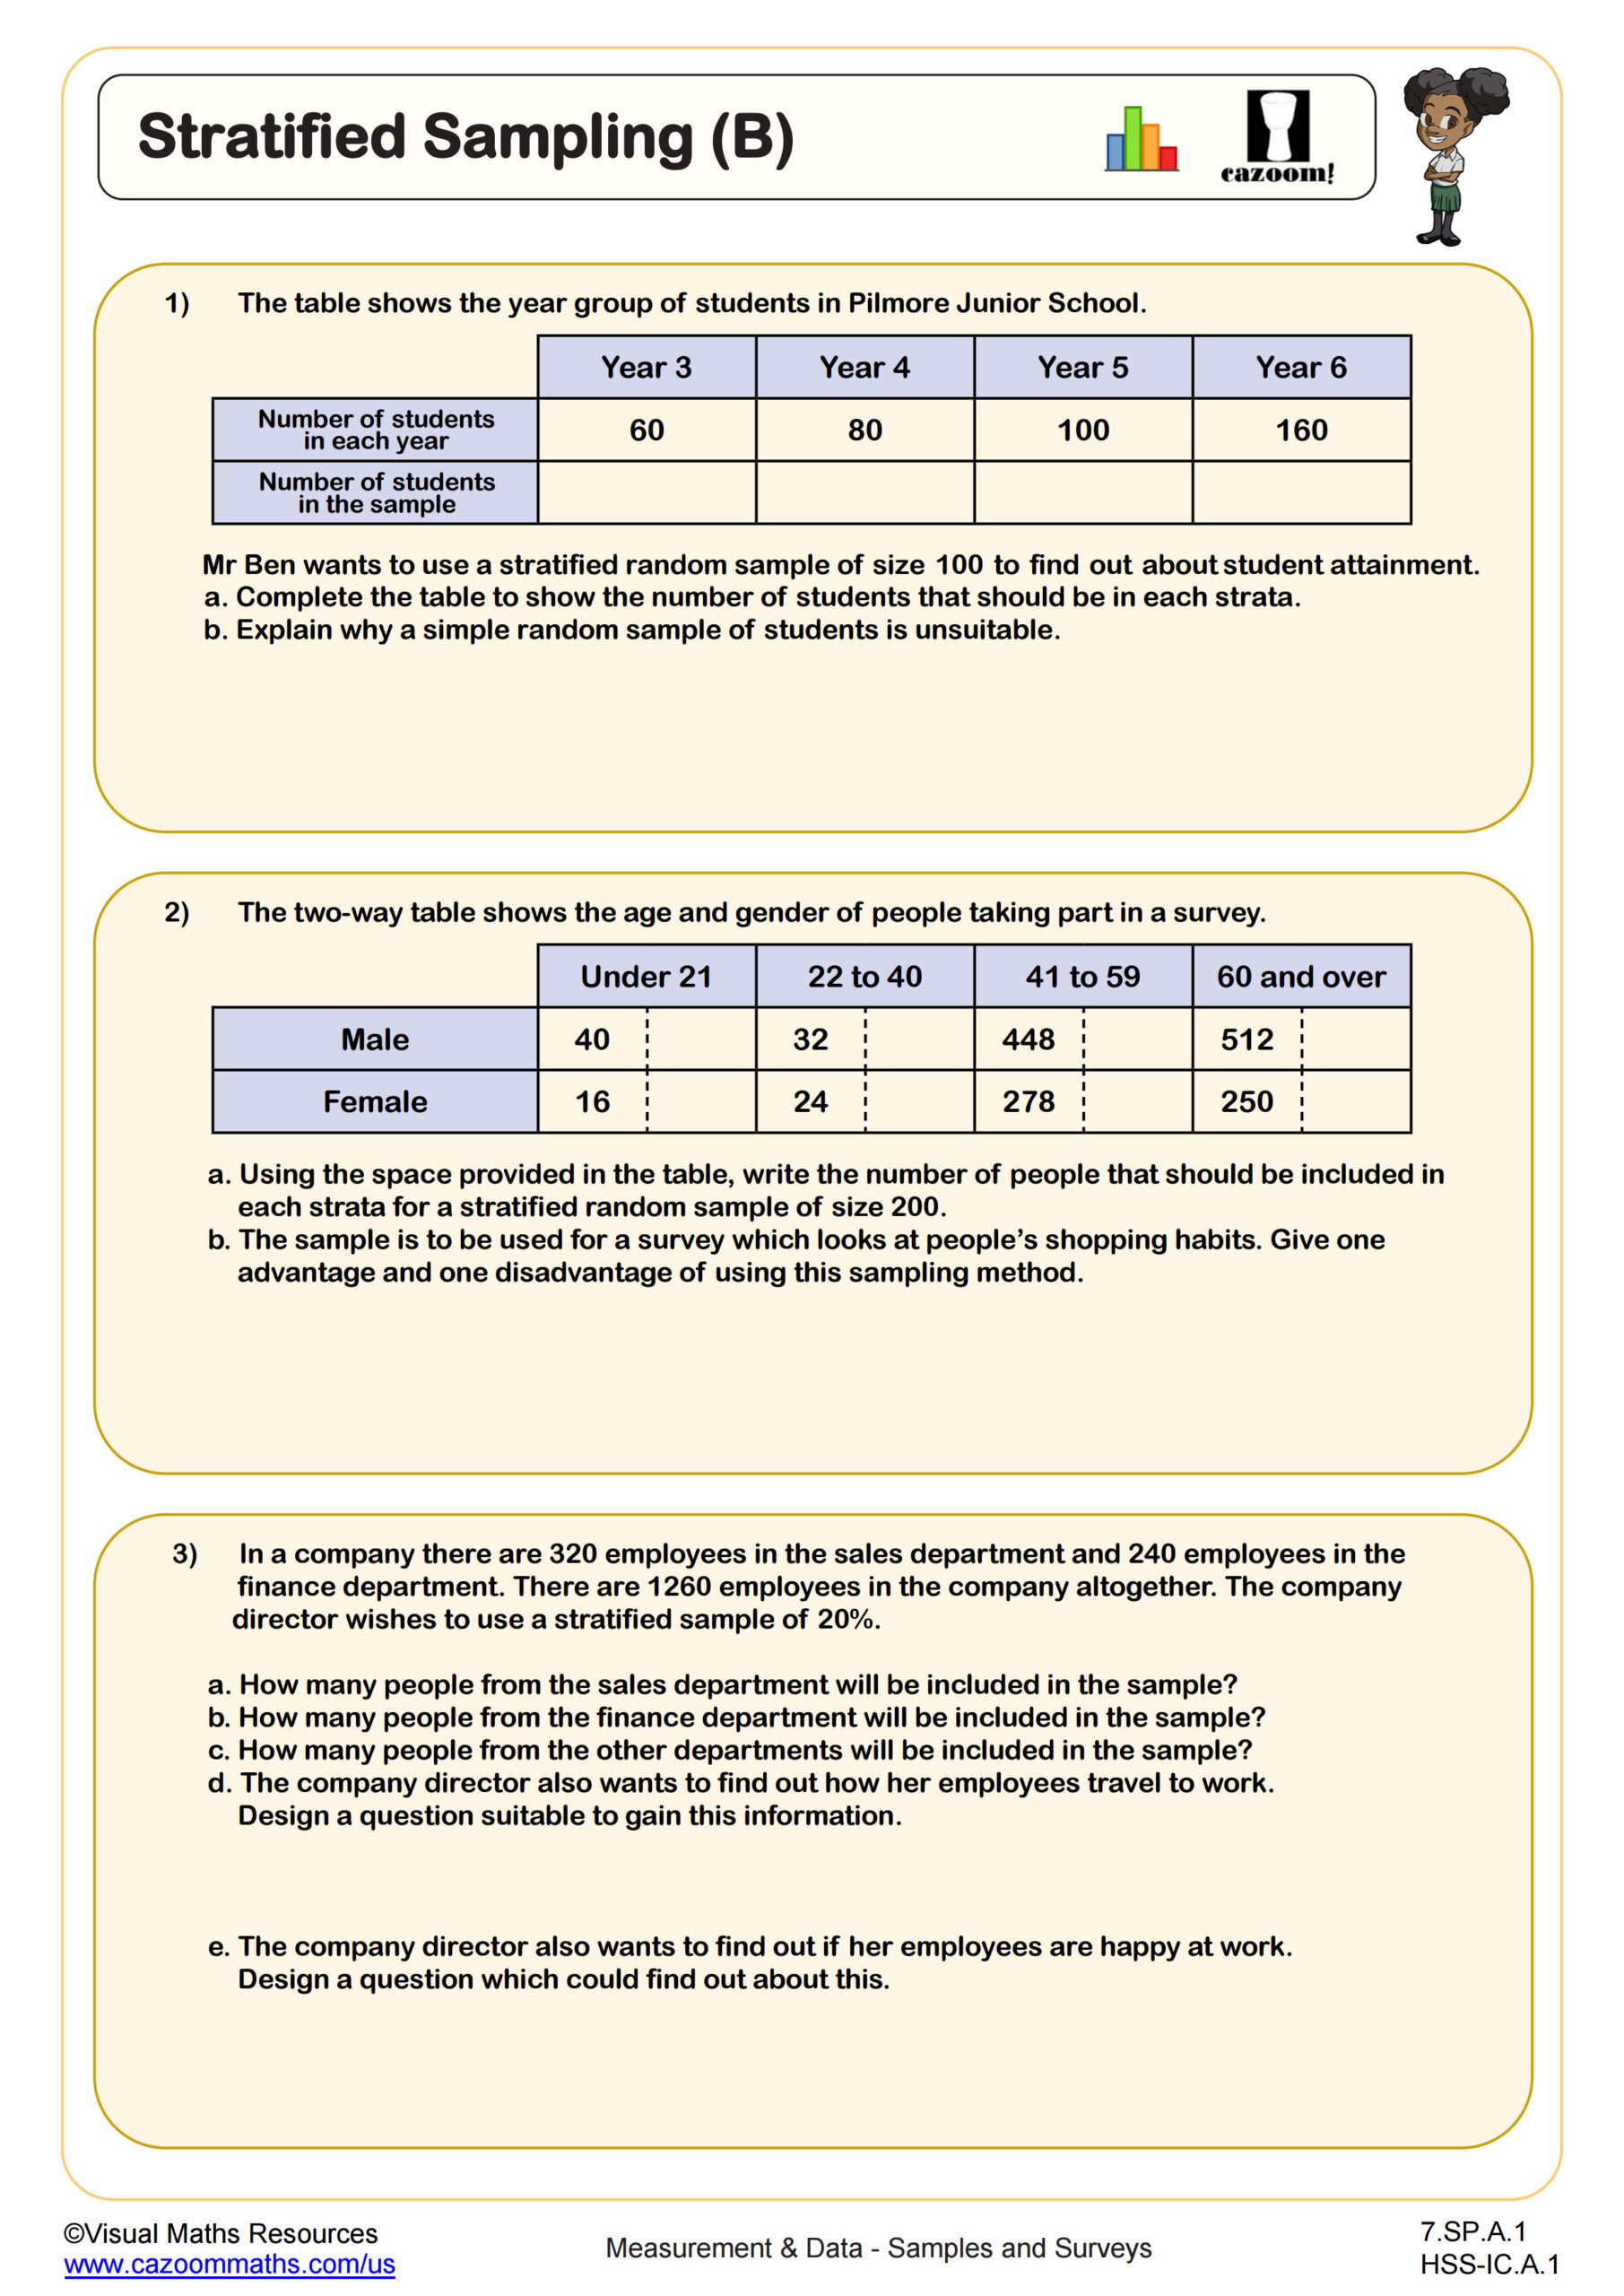
Stratified Sampling (B)
Grades: 7th Grade, Geometry
All worksheets are created by the team of experienced teachers at Cazoom Math.
What makes a good sample in statistics and surveys?
A good sample accurately represents the population being studied and eliminates bias through random selection methods. In statistics, the sample must be large enough and selected using techniques like simple random sampling, systematic sampling, or stratified sampling to ensure valid conclusions about the entire population.
Teachers notice students often confuse convenience samples with random samples, especially when analyzing real scenarios. For instance, when students evaluate whether surveying customers at a pool supply store represents all townspeople, many initially miss that this group already shows bias toward pool ownership. The worksheets help students recognize these subtle distinctions through guided practice problems.
What grade levels cover sampling methods and survey design?
Sampling methods typically appear in middle school statistics units around grades 6-8, with more advanced concepts introduced in high school statistics and AP Statistics courses. The Common Core State Standards introduce basic survey concepts in grade 6, progressing to more sophisticated sampling techniques in later grades.
Elementary teachers sometimes introduce basic survey concepts through classroom data collection, while middle school teachers focus on identifying bias and random selection. High school courses dive deeper into sampling distributions and margin of error calculations. The progression allows students to build understanding from simple data collection to complex statistical inference over multiple years.
How do students learn to identify biased sampling methods?
Students learn to spot biased sampling by examining who gets included or excluded from each sample and whether the selection method introduces systematic errors. They practice analyzing scenarios where the sample doesn't represent the target population, such as surveying only certain locations or times of day.
Mathematics teachers report that students initially accept any sampling method as valid, missing subtle sources of bias. For example, when evaluating mail-in surveys versus random telephone selection, students need explicit instruction to recognize that mail-in responses create self-selection bias. The worksheets provide structured practice comparing different sampling approaches side-by-side to highlight these important distinctions.
How can teachers use these sampling worksheets most effectively?
Teachers find these worksheets work best when students work through problems in pairs, discussing their reasoning before selecting answers. The collaborative approach helps students articulate why certain sampling methods create bias while others produce reliable results. Using the answer keys for immediate feedback prevents students from reinforcing incorrect understanding.
Many educators use these materials as warm-up activities before introducing new sampling concepts or as review before assessments. The real-world scenarios connect to STEM fields where proper sampling affects research validity, from medical studies to environmental monitoring. Teachers often extend the problems by having students design their own surveys and identify potential sources of bias in their methods.
Why Are Samples and Surveys Important?
Here is why samples and surveys are important: Surveys allow researchers to conclude without needing to know about every member of a group. Samples provide the required data.
What are Quantitative and Qualitative Data?
Both quantitative and qualitative data are important. Quantitative data is information that can be conveyed in the form of numbers, or quantities. Qualitative data describes other, non-numeric qualities of the individuals or objects being studied.
A person's age, weight and current heart rate are all quantitative data points. A person's middle name, occupation and birthplace are all qualitative pieces of data.
What are the Five Basic Survey Sampling Methods?
The five basic survey sampling methods are:
Random sampling, where survey samples are taken from the population according to unpredictable selection criteria. Rolling a pair of dice or picking names out of a hat would allow for random survey sampling.
Systematic sampling, where samples are selected according to a set, unvarying pattern. Questioning every third member of a class or every fifth guest at a party would be a systematic sampling method.
Cluster sampling, where a population is first broken up into subgroups according to location or some other characteristic. Every member of some number of these clusters then gets sampled.
Stratified sampling, where characteristics of interest are used to define subgroups, which are called "strata." Each stratum will then be sampled several times corresponding to its size relative to the others, using a different survey sampling method.
Convenience sampling, where survey samples are taken as they become available until enough have been acquired. Analyzing the first 50 responses to a survey sent to every member of a group would be convenience-based sampling.
These five basic sampling methods can also be used in combination, and often are. There are four common ways to conduct random sampling. Several of which include elements of other sampling methods.
What are the Four Types of Random Sampling?
There are four distinct types of random sampling:
Simple random sampling, where samples are chosen by chance from a single list identifying all the members of a population.
Cluster random sampling, where the clusters to be sampled are selected randomly.
Stratified random sampling, where the members of each stratum to be sampled are chosen at random.
Systematic random sampling, where one or more of the parameters of the system to be used are randomly determined.
Which Sampling Method Should You Use?
Each general type of sampling has its own distinctive strengths and appropriate use cases. Random sampling is the most common and versatile. Systematic sampling often proves to be the simplest option. Convenience sampling can be beneficial where ease of use is more important than statistical significance.
Cluster sampling is most often employed when easily identifiable subgroups occur naturally within a population. Finally, stratified sampling can be used to make sure samples are taken from all subgroups of interest.
What is a 'Biased Sample'?
A biased sample is one where the sampling method used did not produce a representative picture of the group or population. Professor Victor Bello Accioly, for example, once said that "Friendship is a totally biased sample of the population: we only pick out the best ones." (1)
It might be convenient to survey all of a person's close friends, but that would probably produce a biased sample of the population of the town they all live in. Your survey could reveal that you were the favorite person of all those sampled, but that might not be representative of the town as a whole.
Test Your Understanding
Answer the following questions about sampling and surveys to test your understanding of the subject:
• Why would a researcher conduct a sampling survey instead of learning about every member of a population?
• Is a person's weight a qualitative or quantitative data point?
• Is a person's favorite flavor of ice cream qualitative or quantitative data?
• If a researcher flips a coin to determine the samples to take, which sampling method is being used?
• What type of sampling would it be if a survey were given to people whose first names were an odd number of letters long?
• If you survey the five people closest to you on a train, what sampling method are you using?
• Suppose a sampling survey breaks a city down into neighborhoods and then samples all of the residents of two of them. What sampling method was employed?
• A researcher divides a group of people into age-defined subgroups and then takes a number of samples from each proportional to its size. What type of sampling is that?
• Can you name three different ways to incorporate random sampling into other sampling methods?
• Why do researchers try to avoid taking biased samples?